4712 Princeton Dr · Mobile, AL
Flood risk 1/10 · Minimal
- FEMA flood zone
- X (unshaded)
- Chance of flooding over 30 yrs
- 0.0%
- Est. flood insurance / yr
- $507 – $1,088
Fire risk 3/10 · Minor
- Est. fire insurance / yr
- $916 – $1,700
Heat risk 9/10 · Severe
- Hot days now (above 104°F)
- 7 days/yr
- Hot days in 30 yrs
- 21 days/yr
Wind risk 9/10 · Severe
- Chance of severe wind over 30 yrs
- 99.0%
Air-quality risk 1/10 · Minimal
- Unhealthy air days now
- 0 days/yr
- Unhealthy air days in 30 yrs
- 0 days/yr
Risk factors via First Street. Map © Google.
Why this score? — see what drove the C- grade
The composite is a weighted blend of 9 inputs, each scored 0–100. Each bar is that input's sub-score; the figure is the points it added to the 100-point composite (weight × sub-score).
- Cash flow +17.8/30.0
- ARV discount +12.1/15.0
- DSCR +5.6/10.0
- Livability +3.8/5.0
- 1% rule +3.6/10.0
- Rent growth +2.5/5.0
- Condition / age +2.5/5.0
- Schools +2.3/10.0
- Appreciation +0.0/10.0
$189,000
🖨 Deal sheet (PDF) 📄 Offer letter ✓ Due diligence
Listing remarks MLS
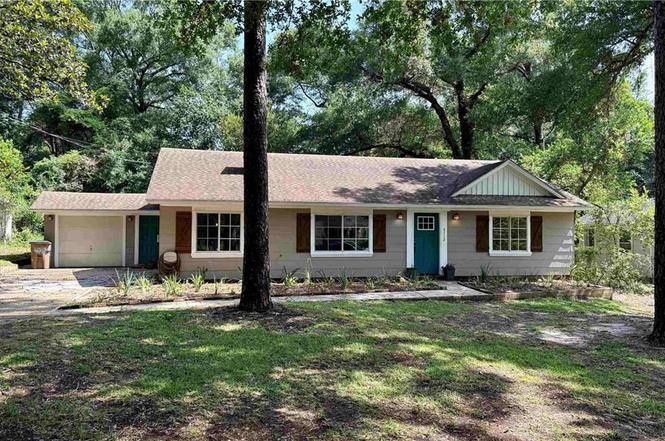
Interior photos coming 6/20. There’s an easy rhythm to this home - one that feels cared for, comfortable, and ready to begin a new chapter. Set in a well-loved pocket of Mobile, its location places you just minutes from the University of South Alabama campus, the Mobile Museum of Art, and the newly created Japanese Garden park. You will appreciate the front approach with natural charm that quietly draws you in, but it’s the backyard that truly changes the pace. Thoughtfully arranged with a patio and fire pit, it invites long evenings, casual gatherings, and a bit of breathing room thanks to its sense of privacy. Inside, the main living space flows directly into a dedicated dining room, creating a layout that feels both connected and defined. The kitchen offers generous room to gather, with space for a table beside the front windows where morning light can ease into the day. A large laundry room doubles easily as a utility or drop zone, adding flexibility to daily routines. The attached garage extends deeper than expected, offering valuable extra space for storage beyond just parking. The primary suite is set apart for a bit of separation, complete with two closets and a private bath. Two additional bedrooms and full bathroom are nearby. With shopping and dining just moments away, this home brings together comfort, function, and a location that keeps everything within easy reach - simply waiting for you to move in. Buyer to verify all information during due diligence.
Key facts
- 0.3 acre lot
- Garage
- Built 1985
Tags
Property features AI
Finance
- HOA & community: No transfer fees; No community amenities listed
Exterior
- Parking: Attached single-car garage; Total 2 parking spaces (1 covered)
- Utilities: Public water; Public sewer; Electric service by Alabama Power; Cable connected
- Home design: Single-family residence; One level (single-story); Resale condition
- Construction: Asbestos construction material; Composition roof; Slab foundation; Built area reported by seller (2035 square feet)
- Exterior features: Fenced yard; Patio; Rear porch; Few trees; No waterfront
Interior
- Kitchen: Dishwasher; Refrigerator
- Bedrooms: Primary bedroom with attached bath; 1st-floor primary with walk-in closet(s)
- Flooring: Tile; Vinyl
- Bathrooms: Two full bathrooms; Primary bathroom with tub/shower combo
- Heating & cooling: Electric heating; Ceiling fan(s) for cooling
- Interior features: Eat-in kitchen; Ceiling fan(s); En-suite bathroom; Living room fireplace
- Laundry & utility: Inside laundry
Neighborhood map
What this means for you Summary
Snapshot
- This is a 3-bed/2.0-bath single-family listed at $189k.
Deal economics
- At list price, monthly cash flow is $156 ($2k/yr) — positive.
- The deal already cash-flows at list — no discount required.
- To meet the 1% rule (rent ≥ 1% of price), the offer needs to be $163k (13.9% below list).
- Recommended offer: $163k (13.9% below list) — sets the bar for 1% rule.
- Cap rate 7.3% vs local median 4.9% in Mobile — top-decile yield for the area; either an underpriced asset or a hidden risk that comps aren't pricing in. Stress-test before assuming the spread holds.
Location & tenants
- Location reads 75/100 on livability (#20 in AL, #4,262 nationally) — a middle-class / working-renter tenant base. Strengths: commute A+, cost of living A+, housing A+; Watch: crime F, employment D-.
- Mobile County (urban): math 15% / reading 39% proficiency, ranked #81 of 129 in AL (top 63%) — low school quality limits family demand, transient renter base, plan for 1-2y turnover; 67% free/reduced lunch — lower-income household profile, screen leases tightly.
- Zoned schools: Forest Hill Elementary School (math 4% / reading 23%, grade F, #531 of 627 statewide, top 85%, 549 students, 93% FRL); Cl Scarborough Model Middle School (math 4% / reading 21%, grade F, #216 of 257 statewide, top 86%, 651 students, 94% FRL); Mattie T Blount High School (math 2% / reading 3%, grade F, #291 of 305 statewide, top 100%, 1,176 students, 86% FRL) — zoned schools average 91% FRL vs 67% district-wide (24 pts higher); higher-poverty schools than district average — tighter screening recommended.
- Zoned-school proficiency averages 10% at this address vs 27% district-wide (-18 pts) — the specific schools serving this property underperform the Mobile County average; the district grade overstates school quality for this exact location.
- Market conditions: 102 active listings in the ZIP; 11 comparable units currently listed for rent nearby; rentals lingering (median 46d on market — plan ~5-8 weeks vacancy on turnover, expect pricing pressure); 64% of comp listings sitting > 30 days — soft ceiling on asking rent; 1,678 units permitted in Mobile County in 2024 (264 in 5+ unit buildings).
- This rent runs 32% of the median local income ($62k/yr) — at the standard rent-burdened threshold; future hikes will face affordability resistance.
Forward outlook
- Local home prices are declining (-3.0%/yr); year-one equity from $1k of loan paydown is wiped out by about $6k of value loss. Plan a longer hold.
- Mobile County population projected to shrink 8% by 2050 — rents likely to lag national; underwrite the cash flow, not the appreciation.
Negotiation context
- Only 1 days on market — expect competitive offers; lowballing is unlikely to land.
- 2 sale attempts with the ask held roughly flat each time — persistent listings suggest the price (not the market) is what's stuck; bring a comps-based counter.
Risks & watch-outs
- Climate carrying-cost: severe wind risk, 99% chance of damaging wind over 30y; extreme-heat days projected 7→21/yr by 2055 (HVAC capex compounding) — expect insurance premiums to compound above CPI over the hold.
Questions for the listing agent
- Is there a deadline driving the sale (1031 exchange, divorce, estate, relocation)? That informs how much negotiation room exists.
- Schools are D-rated, which usually means shorter tenancies and higher turnover. Who's the typical renter profile here, and what's been the actual vacancy rate?
- Crime grade is F in this area — have there been break-ins, vandalism, or insurance claims at this property in the last 3 years? What carrier currently insures it and at what premium?
- What's the average days-on-market for RENTAL listings here right now (not sales)? A rising rental-DOM trend means longer vacancies and softer asking-rent achievability than the comps imply.
- What's the recent tenant-quality profile in this submarket — average credit score on applications, eviction rate, late-payment / NSF rate, and stable-employment percentage? A property-management company in the area should have these aggregated.
- How much new for-sale + rental construction is in the pipeline within 1–3 miles? Heavy new supply typically softens prices + rents 12–24 months out; constrained supply supports both.
Investment metrics
- 1% rule
- 0.86% ✗
- Cap rate
- 7.28%
- Cash-on-cash
- 3.54%
- DSCR
- 1.16
- GRM
- 9.7
CMA / ARV
- ARV (on-the-fly)
- $210,565
- Comps found
- 12
Show comp detail 12 sales within ~0.75 mi
| Address | Dist | Beds/Ba | Sqft | Sold | Price | $/sf | Match |
|---|---|---|---|---|---|---|---|
| 4724 Tulane Dr | 0.23mi | 3/2.0 | 1,870 (+2%) | 2mo | $256,000 | $137 | 84 |
| 4717 Bellewood Dr S | 0.12mi | 3/2.0 | 1,875 (+2%) | 10mo | $190,000 | $101 | 82 |
| 1166 Harvard Dr | 0.09mi | 3/2.0 | 2,037 (+11%) | 1mo | $139,505 | $68 | 76 |
| 1312 Forest Cove Dr | 0.29mi | 3/2.0 | 1,602 (-12%) | 4mo | $237,000 | $148 | 63 |
| 5055 Druid Dr S | 0.52mi | 4/2.0 (+1) | 1,858 (+2%) | 8mo | $201,400 | $108 | 61 |
| 4305 Moffett Rd | 0.70mi | 3/2.0 | 1,692 (-8%) | 1mo | $80,000 | $47 | 54 |
| 4929 Janice Dr | 0.40mi | 4/2.0 (+1) | 2,007 (+10%) | 12mo | $230,000 | $115 | 50 |
| 4558 Brookmoor Dr | 0.24mi | 4/3.0 (+1) | 1,560 (-15%) | 10mo | $220,000 | $141 | 47 |
| 1400 Forest Cove Dr | 0.40mi | 4/2.0 (+1) | 1,577 (-14%) | 15mo | $205,000 | $130 | 41 |
| 861 Knowles Ln | 0.64mi | 3/2.0 | 1,615 (-12%) | 12mo | $130,000 | $80 | 41 |
| 1112 Druid Dr | 0.61mi | 4/2.0 (+1) | 1,606 (-12%) | 12mo | $216,000 | $134 | 36 |
| 1259 Forest Dale Dr | 0.73mi | 4/2.0 (+1) | 1,650 (-10%) | 14mo | $176,500 | $107 | 33 |
Match score weights: distance 35% · size 25% · config 20% · recency 20%. Top-matched comps best support the ARV.
Projected returns pro-forma
-3.0% appreciation · 3.0% rent growth · sell at horizon
- IRR
- -10.8%
- Equity multiple
- 0.61×
- Total profit
- $-20,768
- Equity at exit
- $28,181
- IRR
- -1.6%
- Equity multiple
- 0.89×
- Total profit
- $-5,622
- Equity at exit
- $16,341
Cash invested: $52,920 (down + closing). Projections, not guarantees.
Landlord ↔ Tenant lean methodology
- Overall (STATE)
- 90 Strongly Landlord-Friendly
- State Alabama
- 90 Strongly Landlord-Friendly · R+15
- County
- — inherits STATE
- City
- — inherits STATE
ZIP-level market 36618
- Home prices YoY
- -22.8%
- Active inventory
- 102
- Price-to-rent
- 9.7×
Monthly cashflow live
- Estimated rent
- $1,628 high interval (Pro) →
- Mortgage (P&I)
- −$991
- Tax from tax record
- −$60 /mo · $723/yr
- Insurance
- −$79
- HOA
- −$0
- Vacancy / Maint / Mgmt
- −$342
- Net cashflow
- $156
Break-even live
Sensitivity live
| Price | -10% $263 | -5% $210 | +0% $156 | +5% $103 | +10% $49 |
|---|---|---|---|---|---|
| Rent | -10% $27 | -5% $92 | +0% $156 | +5% $220 | +10% $285 |
| Rate | -1.0pp $251 | -0.5pp $204 | base $156 | +0.5pp $107 | +1.0pp $57 |
UW: 25.0% down · 7.5% · 30yr · 1.5% tax · 5.0% vac · 8.0% maint · 8.0% mgmt
Financing live
Cash to close
- Down payment
- $47,250
- Closing costs
- $5,670
- Reserves months
- —
- Total cash needed
- —
Loan-product check · same deal, 3 products live
Conventional
25% down · 7.5% · 30yr
- Down + closing
- —
- Monthly P&I
- —
- Monthly cashflow
- —
- DSCR
- —
- Eligible?
- —
Personal DTI + credit; lowest rate.
DSCR
20% down · 8.5% · 30yr
- Down + closing
- —
- Monthly P&I
- —
- Monthly cashflow
- —
- DSCR
- —
- Eligible?
- —
No personal income docs; deal must DSCR.
Hard money
10% down · 12.0% · 12mo
- Down + closing
- —
- Monthly P&I
- —
- Monthly cashflow
- —
- DSCR
- —
- Eligible?
- —
Short-term bridge; refi at stabilization.
Rent comps 11 comps
| Address | Beds | Baths | Sqft | Rent | $/sqft | DOM | Units | Dist |
|---|---|---|---|---|---|---|---|---|
| 1063 Midmoor Dr Mobile, AL | 2.0 | 2.0 | 1695 | $1,450 | $0.86 | 45d | 1 | 0.18mi |
| 1104 Garland St Mobile, AL | 3.0 | 1.0 | 1377 | $1,450 | $1.05 | 23d | 1 | 0.58mi |
| 4174 Benson Dr Mobile, AL | 4.0 | 2.0 | 1288 | $1,400 | $1.09 | 45d | 1 | 0.77mi |
| 4410 The Cedars Ave Mobile, AL | 2.0 | 1.0 | 1232 | $1,500 | $1.22 | 15d | 1 | 0.89mi |
| 4410 The Cedars Ave Mobile, AL | 2.0 | 1.0 | 1232 | $1,500 | $1.22 | 45d | 1 | 0.89mi |
| 324 Dalewood Dr Mobile, AL | 4.0 | 3.0 | 2398 | $2,750 | $1.15 | 45d | 1 | 0.92mi |
| 5477 Ardell Dr Unit 1043691P Mobile, AL | 3.0 | 2.0 | 1496 | $2,680 | $1.79 | 15d | 1 | 1.23mi |
| 5508 Overlook Rd Mobile, AL | 3.0 | 2.0 | 1260 | $1,400 | $1.11 | 15d | 1 | 1.29mi |
| 3521 Stillwood Ln W Mobile, AL | 3.0 | 2.0 | 2126 | $2,900 | $1.36 | 45d | 1 | 1.29mi |
| 5520 Vienna Ave Mobile, AL | 3.0 | 2.0 | 1745 | $1,395 | $0.80 | 45d | 1 | 1.38mi |
| 5613 Overlook Rd Mobile, AL | 3.0 | 1.5 | 1520 | $1,450 | $0.95 | 45d | 1 | 1.41mi |
Listing history 2 events
-
2026-06-21remarks 687-char remark
-
2026-06-21$189,000 Active 1 DOM
ⓘ Source: listings_history table (triggers on properties + properties_extension) + one-shot
backfill from property_details.listing_events for pre-trigger history.
Tax reassessment forecast AL · Resets to sale price
- Current annual tax
- $723 · $60/mo
- Projected year-2 tax
- $775 · $65/mo
- Expected delta
- +$52/yr (+$4/mo · 7.2%)
ⓘ Screening estimate from a state-policy table — verify with the county assessor before closing.
Climate risk First Street
- Flood 1/10 Low FEMA zone X (unshaded) · 0% chance over 30 yrs
- Wildfire 3/10 Moderate
- Heat 9/10 Extreme 7 d/yr ≥104°F today · 21 d/yr by 30 yrs out
- Wind 9/10 Extreme 99% chance of damaging wind over 30 yrs
- Air quality 1/10 Low 0 unhealthy d/yr today · 0 by 30 yrs out
Nearby sold comps map
Loading sold comps map…
Walkable amenities ~0.75 mi
Loading nearby amenities…
Taxation est. · year 1
- Rental income
- $19,538
- − Mortgage interest
- −$10,587
- − Property taxes
- −$723
- − Insurance
- −$945
- − Repairs & maintenance
- −$1,563
- − Management
- −$1,563
- − Depreciation
- −$5,498
- Taxable loss
- −$1,341
- Est. tax savings @ 24.0%
- +$322
- After-tax cash flow
- $2,195/yr
For passive investors: Depreciation is non-cash, so a rental often shows a tax loss while cash-flowing — sheltering income. Rental losses are passive: they offset passive income freely, and up to $25,000/yr can offset ordinary (W-2) income if you actively participate and your MAGI is under $100k (phasing out to $0 by $150k); unused losses carry forward. On sale, claimed depreciation is recaptured at up to 25%, and gains may owe capital-gains tax (a 1031 exchange can defer both). Figures are a year-1 estimate at your 24.0% rate — not tax advice; consult a CPA.
Schools (NCES district)
- District
- Mobile County
- NCES district ID
- 0102370
- Math proficiency
- 15% ▼ -28.00%
- Reading proficiency
- 39% ▬ 0.00%
- Median HH income
- $42,455
- Composite
- 22.9/100
- National rank
- #8002
- State rank
- #81 of 129 in AL
Livability — Mobile
- Score
- 75/100
- State rank
- #20
- US rank
- #4262
Category grades
Schools grade is shown separately in the Schools card above.
Census & demographics
- Census place
- Mobile, AL
- County
- Mobile County · 246,577 people
- City population
- 205,729
- Metro
- Mobile, AL
- Population (ZIP)
- 17,892
- Household income
- $61,550
- Rent vs Own
- Severe rent burden
- 542.0
Population outlook (Mobile County) Hauer SSP2
- Today (2025)
- 415,303 people
- By 2030
- 411,755 · -0.9%
- By 2040
- 399,670 · -3.8%
- By 2050
- 382,616 · -7.9%
- By 2075
- 337,353 · -18.8%
- By 2100
- 283,391 · -31.8%
Race, ethnicity, and origin ACS 2023
- Neighborhood character
- Predominantly Black (65%)
- Race & ethnicity
- Black 65% White 27% Two or more races 3% Asian 3% Hispanic / Latino 2%
- Common ancestry
- Slovak 1% Serbian 1% Romanian 0%
- Foreign-born
- 4% · Canada, China
- Languages at home
- 94% English-only · Spanish 3% Chinese 2%
Political lean MEDSL · Mobile
- 2024 margin
- R (+16.4) · D 41.3% · R 57.7%
- 2008→2024 swing
- -7.7pp toward R · 2008: -8.7pp · 2024: -16.4pp
- All cycles
- 2024: R+16.4 2020: R+11.9 2016: R+13.9 2012: R+9.3 2008: R+8.7
Not yet ingested
- Civics
- —
Market trends
- HPI YoY
- ▼ -64.54%
- Current HPI
- 218.7133
- Rent YoY
- —
- Metro
- Mobile, AL
- State GDP YoY
- ▲ 2.94%
- F500 in state
- 4
Industry mix (Fortune 500 HQ in AL)
| Industry | F500 HQs | Revenue |
|---|---|---|
| Financial Services | 1 | $8B |
|
||
| Healthcare | 1 | $5B |
|
||
Price history
+0.0% since first listed2 events — show timeline
- 2026-06-19 Listed $189,000 GCMLS AL
- 2026-06-19 Listed $189,000 BCAR
Property tax history
+2.2%/yrLatest (2025): $723 · +0.9% YoY. Source: county tax records.
Cash-flow waterfall
monthlySold comps — $/sqft
last 12 mo · ≤1 miLoading sold comps…