122 Ridge Dr · Double Horn, TX
Flood risk 1/10 · Minimal
- FEMA flood zone
- X (unshaded)
- Chance of flooding over 30 yrs
- 0.0%
- Est. flood insurance / yr
- $507 – $1,088
Fire risk 4/10 · Minor
- Est. fire insurance / yr
- $1,222 – $2,270
Heat risk 8/10 · Major
- Hot days now (above 107°F)
- 7 days/yr
- Hot days in 30 yrs
- 22 days/yr
Wind risk 6/10 · Moderate
- Chance of severe wind over 30 yrs
- 60.0%
Air-quality risk 1/10 · Minimal
- Unhealthy air days now
- 0 days/yr
- Unhealthy air days in 30 yrs
- 0 days/yr
Risk factors via First Street. Map © Google.
Why this score? — see what drove the C- grade
The composite is a weighted blend of 9 inputs, each scored 0–100. Each bar is that input's sub-score; the figure is the points it added to the 100-point composite (weight × sub-score).
- Cash flow +16.6/30.0
- ARV discount +15.0/15.0
- DSCR +5.2/10.0
- 1% rule +5.0/10.0
- Rent growth +3.3/5.0
- Schools +3.0/10.0
- Livability +2.5/5.0
- Condition / age +2.5/5.0
- Appreciation +0.0/10.0
$299,750
🖨 Deal sheet (PDF) 📄 Offer letter ✓ Due diligence
Listing remarks MLS
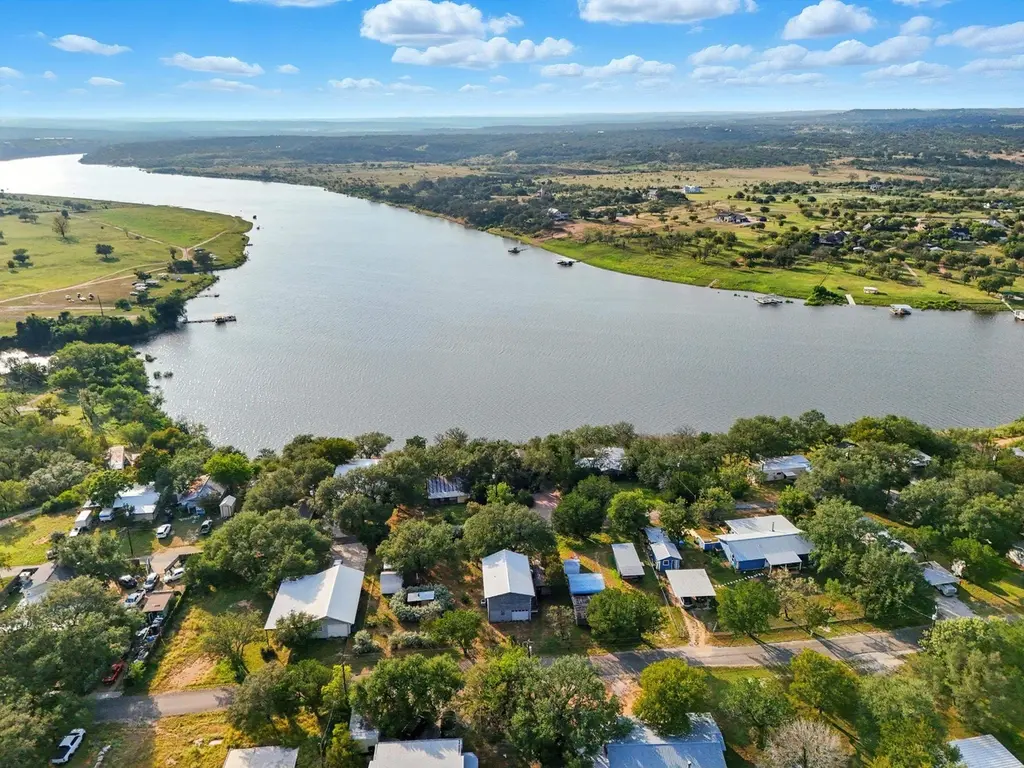
Lake Travis is beckoning!! Discover the lake lifestyle with Lake Travis living in this custom home in the quiet community of Eagle's Bluff, Spicewood, TX. This home may make an excellent multi-generational option. Downstairs boasts an open large area with window/ wall ac and electric heater, laundry/kitchenette, full bathroom, and additional room that is referenced as the third bedroom, alongside the one-car garage. Ascend upstairs to find the main living and dining, full kitchen, two bedrooms, and full bathroom. Large balcony extends across the back of the house. Tranquil setting is complemented by a private screened chiminea area for lounging and relaxing. Storage building/workshop is perfect for the hobbyist and attached to the two-car carport. This striking residence is perched on two generously sized lots, presenting a unique opportunity to own a piece of paradise with unparalleled potential for customization and expansion. With its blend of comfort and access to nature's finest, it's poised to be the backdrop for your most cherished moments. Welcome to your Lake Travis sanctuary, where every day feels like a getaway. This property has tons of opportunities and is priced to sell. Check it out today!
Key facts
- Full kitchen
- Storage building
- Custom home
Tags
Neighborhood map
What this means for you Summary
Snapshot
- This is a 3-bed/1.0-bath single-family listed at $300k.
Deal economics
- At list price, monthly cash flow is $183 ($2k/yr) — positive.
- The deal already cash-flows at list — no discount required.
- Meets the 1% rule at list price ($3k rent vs $300k).
- Recommended offer: $273k (9.0% below list) — sets the bar for market timing.
- Cap rate 7.0% vs local median 1.3% in Double Horn — top-decile yield for the area; either an underpriced asset or a hidden risk that comps aren't pricing in. Stress-test before assuming the spread holds.
Location & tenants
- Location reads: area grade C — affects rentability + tenant quality, not the cash-flow math above.
- Marble Falls ISD (town): math 32% / reading 38% proficiency, ranked #511 of 826 in TX (top 62%) — families likely to look elsewhere, expect single-tenant / working-renter base with shorter leases.
- Zoned schools: Spicewood El (math 52% / reading 62%, grade C+, #505 of 4,322 statewide, top 13%, 202 students, 49% FRL); Marble Falls Middle (math 32% / reading 37%, grade F, #858 of 1,662 statewide, top 54%, 911 students, 67% FRL); Marble Falls H S (math 29% / reading 47%, grade F, #880 of 1,632 statewide, top 54%, 1,145 students, 61% FRL).
- Market conditions: Rents rising (+3.4%/yr); 653 active listings in the ZIP; 2 comparable units currently listed for rent nearby; high-income renter base; 891 units permitted in Burnet County in 2024 (76 in 5+ unit buildings).
Forward outlook
- Local home prices are declining (-3.0%/yr); year-one equity from $2k of loan paydown is wiped out by about $9k of value loss. Plan a longer hold.
- Burnet County population projected at +22% by 2050 — long-run rental-demand tailwind backs the buy-and-hold thesis.
Negotiation context
- It's been on market 114 days — a 9% lower offer ($273k) is reasonable based on typical stale-listing flexibility.
- 2 sale attempts since 2y ago with the ask held roughly flat each time — persistent listings suggest the price (not the market) is what's stuck; bring a comps-based counter.
Risks & watch-outs
- Climate carrying-cost: major wind risk, 60% chance of damaging wind over 30y; extreme-heat days projected 7→22/yr by 2055 (HVAC capex compounding) — expect insurance premiums to compound above CPI over the hold.
Questions for the listing agent
- It's been on market 114 days. Have you received any prior offers? Is the seller open to a 9% concession, seller financing, or rate buy-down credit?
- Why hasn't it sold? Are there any deal-killer items the seller is aware of (foundation, flood, title, zoning, code violations)?
- Is there a deadline driving the sale (1031 exchange, divorce, estate, relocation)? That informs how much negotiation room exists.
- What's the average days-on-market for RENTAL listings here right now (not sales)? A rising rental-DOM trend means longer vacancies and softer asking-rent achievability than the comps imply.
- What's the recent tenant-quality profile in this submarket — average credit score on applications, eviction rate, late-payment / NSF rate, and stable-employment percentage? A property-management company in the area should have these aggregated.
- How much new for-sale + rental construction is in the pipeline within 1–3 miles? Heavy new supply typically softens prices + rents 12–24 months out; constrained supply supports both.
Investment metrics
- 1% rule
- 1.00% ✓
- Cap rate
- 7.03%
- Cash-on-cash
- 2.62%
- DSCR
- 1.12
- GRM
- 8.3
CMA / ARV
- ARV (median comp)
- $412,547
- List price
- $299,750
- Delta
- -27.34%
- Verdict
- UNDERPRICED
- Comps
- 20 within 1.0 mi
Show comp detail 4 sales within ~0.75 mi
| Address | Dist | Beds/Ba | Sqft | Sold | Price | $/sf | Match |
|---|---|---|---|---|---|---|---|
| 112 Mari Ln | 0.23mi | 3/2.0 | 1,812 (-3%) | 3mo | $375,000 | $207 | 78 |
| 118 Midnight Sun Dr | 0.58mi | 3/2.0 | 1,772 (-5%) | 1mo | $350,000 | $198 | 60 |
| 409 Lake View Dr | 0.32mi | 3/2.0 | 1,607 (-14%) | 5mo | $634,900 | $395 | 54 |
| 216 Crest Dr | 0.43mi | 2/2.0 (-1) | 1,700 (-9%) | 23mo | $189,000 | $111 | 37 |
Match score weights: distance 35% · size 25% · config 20% · recency 20%. Top-matched comps best support the ARV.
Projected returns pro-forma
-3.0% appreciation · 3.36% rent growth · sell at horizon
- IRR
- -11.7%
- Equity multiple
- 0.57×
- Total profit
- $-35,690
- Equity at exit
- $44,694
- IRR
- -1.9%
- Equity multiple
- 0.87×
- Total profit
- $-11,064
- Equity at exit
- $25,917
Cash invested: $83,930 (down + closing). Projections, not guarantees.
Landlord ↔ Tenant lean methodology
- Overall (STATE)
- 87 Strongly Landlord-Friendly
- State Texas
- 87 Strongly Landlord-Friendly · R+5
- County
- — inherits STATE
- City
- — inherits STATE
ZIP-level market 78669
- Home prices YoY
- -16.6%
- Rents YoY
- 3.4%
- Active inventory
- 653
- Price-to-rent
- 8.3×
Monthly cashflow live
- Estimated rent
- $3,000 medium interval (Pro) →
- Mortgage (P&I)
- −$1,572
- Tax from tax record
- −$490 /mo · $5,878/yr
- Insurance
- −$125
- HOA
- −$0
- Vacancy / Maint / Mgmt
- −$630
- Net cashflow
- $183
Break-even live
Sensitivity live
| Price | -10% $353 | -5% $268 | +0% $183 | +5% $98 | +10% $14 |
|---|---|---|---|---|---|
| Rent | -10% $-54 | -5% $65 | +0% $183 | +5% $302 | +10% $420 |
| Rate | -1.0pp $334 | -0.5pp $260 | base $183 | +0.5pp $106 | +1.0pp $27 |
UW: 25.0% down · 7.5% · 30yr · 1.5% tax · 5.0% vac · 8.0% maint · 8.0% mgmt
Financing live
Cash to close
- Down payment
- $74,938
- Closing costs
- $8,992
- Reserves months
- —
- Total cash needed
- —
Loan-product check · same deal, 3 products live
Conventional
25% down · 7.5% · 30yr
- Down + closing
- —
- Monthly P&I
- —
- Monthly cashflow
- —
- DSCR
- —
- Eligible?
- —
Personal DTI + credit; lowest rate.
DSCR
20% down · 8.5% · 30yr
- Down + closing
- —
- Monthly P&I
- —
- Monthly cashflow
- —
- DSCR
- —
- Eligible?
- —
No personal income docs; deal must DSCR.
Hard money
10% down · 12.0% · 12mo
- Down + closing
- —
- Monthly P&I
- —
- Monthly cashflow
- —
- DSCR
- —
- Eligible?
- —
Short-term bridge; refi at stabilization.
Rent comps 2 comps
| Address | Beds | Baths | Sqft | Rent | $/sqft | DOM | Units | Dist |
|---|---|---|---|---|---|---|---|---|
| 500 Wanta Hideaway Spicewood, TX | 3.0 | 2.0 | 1585 | $2,250 | $1.42 | 45d | 1 | 0.68mi |
| 408 Breezing Ln Spicewood, TX | 3.0 | 2.0 | 1232 | $2,200 | $1.79 | 17d | 1 | 0.77mi |
Listing history 19 events
-
2026-06-21days on market $299,750 Active 114 DOM
-
2026-06-18days on market $299,750 Active 111 DOM
-
2026-06-17days on market $299,750 Active 110 DOM
-
2026-06-16days on market $299,750 Active 109 DOM
-
2026-06-15days on market $299,750 Active 108 DOM
-
2026-06-13days on market $299,750 Active 106 DOM
-
2026-06-13days on market $299,750 Active 105 DOM
-
2026-06-09days on market $299,750 Active 102 DOM
-
2026-06-08days on market $299,750 Active 101 DOM
-
2026-06-07days on market $299,750 Active 100 DOM
-
2026-06-05days on market $299,750 Active 97 DOM
-
2026-06-03days on market $299,750 Active 96 DOM
-
2026-06-01days on market $299,750 Active 94 DOM
-
2026-05-31days on market $299,750 Active 93 DOM
-
2026-02-27$299,750 Active 1223-char remark
Show marketing remark (1223 chars)
Lake Travis is beckoning!! Discover the lake lifestyle with Lake Travis living in this custom home in the quiet community of Eagle's Bluff, Spicewood, TX. This home may make an excellent multi-generational option. Downstairs boasts an open large area with window/ wall ac and electric heater, laundry/kitchenette, full bathroom, and additional room that is referenced as the third bedroom, alongside the one-car garage. Ascend upstairs to find the main living and dining, full kitchen, two bedrooms, and full bathroom. Large balcony extends across the back of the house. Tranquil setting is complemented by a private screened chiminea area for lounging and relaxing. Storage building/workshop is perfect for the hobbyist and attached to the two-car carport. This striking residence is perched on two generously sized lots, presenting a unique opportunity to own a piece of paradise with unparalleled potential for customization and expansion. With its blend of comfort and access to nature's finest, it's poised to be the backdrop for your most cherished moments. Welcome to your Lake Travis sanctuary, where every day feels like a getaway. This property has tons of opportunities and is priced to sell. Check it out today!
-
2025-08-12price $299,999
-
2025-08-12price
-
2024-07-15price $350,000
-
2024-07-15Active
ⓘ Source: listings_history table (triggers on properties + properties_extension) + one-shot
backfill from property_details.listing_events for pre-trigger history.
Tax reassessment forecast TX · Resets to sale price
- Current annual tax
- $5,878 · $490/mo
- Projected year-2 tax
- $5,878 · $490/mo
- Expected delta
- $0/yr ($0/mo · 0.0%)
ⓘ Screening estimate from a state-policy table — verify with the county assessor before closing.
Climate risk First Street
- Flood 1/10 Low FEMA zone X (unshaded) · 0% chance over 30 yrs
- Wildfire 4/10 Moderate
- Heat 8/10 Severe 7 d/yr ≥107°F today · 22 d/yr by 30 yrs out
- Wind 6/10 Major 60% chance of damaging wind over 30 yrs
- Air quality 1/10 Low 0 unhealthy d/yr today · 0 by 30 yrs out
Nearby sold comps map
Loading sold comps map…
Walkable amenities ~0.75 mi
Loading nearby amenities…
Taxation est. · year 1
- Rental income
- $36,000
- − Mortgage interest
- −$16,791
- − Property taxes
- −$5,878
- − Insurance
- −$1,499
- − Repairs & maintenance
- −$2,880
- − Management
- −$2,880
- − Depreciation
- −$8,720
- Taxable loss
- −$2,648
- Est. tax savings @ 24.0%
- +$635
- After-tax cash flow
- $2,835/yr
For passive investors: Depreciation is non-cash, so a rental often shows a tax loss while cash-flowing — sheltering income. Rental losses are passive: they offset passive income freely, and up to $25,000/yr can offset ordinary (W-2) income if you actively participate and your MAGI is under $100k (phasing out to $0 by $150k); unused losses carry forward. On sale, claimed depreciation is recaptured at up to 25%, and gains may owe capital-gains tax (a 1031 exchange can defer both). Figures are a year-1 estimate at your 24.0% rate — not tax advice; consult a CPA.
Schools (NCES district)
- District
- Marble Falls ISD
- NCES district ID
- 4829010
- Math proficiency
- 32% ▼ -8.00%
- Reading proficiency
- 38% ▼ -4.00%
- Median HH income
- $49,663
- Composite
- 30.3/100
- National rank
- #6278
- State rank
- #511 of 826 in TX
Livability — Double Horn
No livability data for this city. (Only ~50 U.S. cities are tracked.)
Census & demographics
- County
- Travis County · 1,299,254 people
- Metro
- Austin-Round Rock-Georgetown, TX
- Population (ZIP)
- 12,592
- Household income
- $128,000
- Rent vs Own
- Severe rent burden
- 45.0
Population outlook (Burnet County) Hauer SSP2
- Today (2025)
- 50,492 people
- By 2030
- 52,995 · +5.0%
- By 2040
- 57,528 · +13.9%
- By 2050
- 61,444 · +21.7%
- By 2075
- 71,098 · +40.8%
- By 2100
- 74,634 · +47.8%
Race, ethnicity, and origin ACS 2023
- Neighborhood character
- Predominantly White (81%)
- Race & ethnicity
- White 81% Hispanic / Latino 13% Two or more races 8% Black 1% Asian 1%
- Hispanic origin (detail)
- Mexican 9%
- Common ancestry
- Italian 5% Slovak 3% Lithuanian 3%
- Foreign-born
- 5% · Canada
- Languages at home
- 93% English-only · Spanish 5% Other Asian/Pacific 1%
Political lean MEDSL · Burnet
- 2024 margin
- Solid R (+55.7) · D 21.7% · R 77.4%
- 2008→2024 swing
- -11.6pp toward R · 2008: -44.1pp · 2024: -55.7pp
- All cycles
- 2024: R+55.7 2020: R+53.1 2016: R+56.8 2012: R+54.6 2008: R+44.1
Not yet ingested
- Civics
- —
Market trends
- HPI YoY
- ▼ -50.06%
- Current HPI
- 251.3551
- Rent YoY
- ▲ 3.36%
- Metro
- Austin-Round Rock-Georgetown, TX
- State GDP YoY
- ▲ 3.95%
- F500 in state
- 110
Industry mix (Fortune 500 HQ in TX)
| Industry | F500 HQs | Revenue |
|---|---|---|
| Energy | 16 | $1,198B |
|
||
| Technology | 5 | $198B |
|
||
| Engineering / Construction | 4 | $72B |
|
||
| Energy Services | 3 | $60B |
|
||
| Utilities | 3 | $41B |
|
||
| Healthcare | 2 | $330B |
|
||
Price history
-14.4% since first listed5 events — show timeline
- 2026-02-27 Listed $299,750 HLMLS as distributed by MLS GRID
- 2025-08-12 Price Changed $299,999 HLMLS as distributed by MLS GRID
- 2025-08-12 Price Changed — Unlock MLS
- 2024-07-15 Price Changed $350,000 HLMLS as distributed by MLS GRID
- 2024-07-15 Listed — Unlock MLS
Property tax history
+11.7%/yrLatest (2026): $5,878 · +93.8% YoY. Source: county tax records.
Cash-flow waterfall
monthlySold comps — $/sqft
last 12 mo · ≤1 miLoading sold comps…