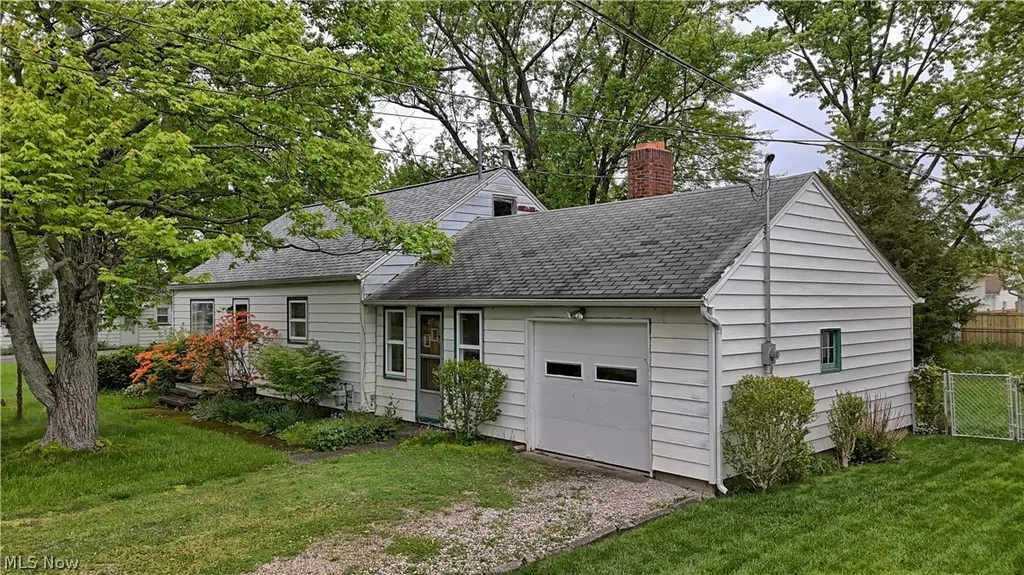
10071 Colfax Dr · Olmsted Falls, OH
Flood risk 1/10 · Minimal
- FEMA flood zone
- X (unshaded)
- Chance of flooding over 30 yrs
- 0.0%
- Est. flood insurance / yr
- $473 – $860
Fire risk 1/10 · Minimal
- Est. fire insurance / yr
- $713 – $1,323
Heat risk 2/10 · Minimal
- Hot days now (above 96°F)
- 7 days/yr
- Hot days in 30 yrs
- 15 days/yr
Wind risk 1/10 · Minimal
- Chance of severe wind over 30 yrs
- —
Air-quality risk 2/10 · Minimal
- Unhealthy air days now
- 1 days/yr
- Unhealthy air days in 30 yrs
- 2 days/yr
Risk factors via First Street. Map © Google.
Why this score? — see what drove the C grade
The composite is a weighted blend of 9 inputs, each scored 0–100. Each bar is that input's sub-score; the figure is the points it added to the 100-point composite (weight × sub-score).
- Cash flow +19.8/30.0
- ARV discount +15.0/15.0
- DSCR +6.3/10.0
- Schools +5.5/10.0
- 1% rule +4.6/10.0
- Livability +3.7/5.0
- Rent growth +2.5/5.0
- Condition / age +2.5/5.0
- Appreciation +0.0/10.0
$180,000
🖨 Deal sheet 📄 Offer letter ✓ Due diligence
Listing remarks
Located in desirable Columbia Station, this 3 bedroom 1 bath ranch offers a great opportunity for investors, flippers, or buyers looking to add their personal touch. The home features 2 bedrooms on the main level with an additional dormer-style bedroom upstairs, providing flexible living space. Bring your imagination and a little elbow grease to restore this property to its full potential. Conveniently located near local amenities, shopping, and major highways. Property is being sold AS-IS.
Key facts
- Local amenities
- Dormer-style bedroom
- Major highways
Tags
Property features AI
Finance
- Other:
- Financial info:
- HOA & community:
Exterior
- Parking: Detached or attached garage with 1-car capacity; Gravel parking area
- Security:
- Utilities: Public water; Public sewer
- Home design: Single-story home (with usable second-level bedroom); Wood siding exterior; Asphalt/fiberglass roof
- Construction: Built per public records (year built from public records); Wood siding construction; Asphalt/fiberglass roof
- Exterior features: Lot approximately 0.21 acres
Interior
- Kitchen:
- Bedrooms: Two main-level bedrooms; One bedroom on the second level (large 21 x 11)
- Flooring: Wood flooring in several bedrooms; Carpet in the living room; Linoleum in family room and bathroom
- Bathrooms: One full bathroom on the main level
- Heating & cooling: Forced-air heating; Central air conditioning
- Interior features: One fireplace
- Laundry & utility: Main-level laundry room (7 x 6) with concrete flooring
Neighborhood map
What this means for you Summary
Snapshot
- This is a 2-bed/1.0-bath single-family listed at $180k.
Deal economics
- At list price, monthly cash flow is $215 ($3k/yr) — positive.
- The deal already cash-flows at list — no discount required.
- To meet the 1% rule (rent ≥ 1% of price), the offer needs to be $173k (3.7% below list).
- Recommended offer: $173k (3.7% below list) — sets the bar for 1% rule.
- Cap rate 7.7% vs local median 4.2% in Olmsted Falls — top-decile yield for the area; either an underpriced asset or a hidden risk that comps aren't pricing in. Stress-test before assuming the spread holds.
Location & tenants
- Location reads 73/100 on livability (#343 in OH) — a middle-class / working-renter tenant base. Strengths: schools A+, crime A+, employment A+; Watch: amenities F, commute F, health & safety F.
- Columbia Local (rural): math 55% / reading 71% proficiency, ranked #211 of 656 in OH (top 32%) — acceptable for families but not a draw, mixed tenant base, ~2y average lease.
- Market conditions: 93 active listings in the ZIP; 3 comparable units currently listed for rent nearby; rentals leasing fast (median 2d on market — plan ~1-2 weeks tenant-placement turnaround); solid renter incomes; 1,098 units permitted in Lorain County in 2024 (20 in 5+ unit buildings).
Forward outlook
- Local home prices are declining (-3.0%/yr); year-one equity from $1k of loan paydown is wiped out by about $5k of value loss. Plan a longer hold.
Negotiation context
- It's been on market 16 days — a 2% lower offer ($177k) is reasonable based on typical stale-listing flexibility.
- 2 sale attempts with the ask held roughly flat each time — persistent listings suggest the price (not the market) is what's stuck; bring a comps-based counter.
Risks & watch-outs
- Watch-outs: built in 1951 — expect roof / HVAC / electrical / plumbing capex.
Questions for the listing agent
- Built in 1951 — when were the roof, HVAC, electrical panel, plumbing, and water heater last replaced?
- Is there a deadline driving the sale (1031 exchange, divorce, estate, relocation)? That informs how much negotiation room exists.
- Schools are A-rated — typically a magnet for longer-tenancy family renters. What's the average tenant stay here, and is there a school-zone premium baked into asking?
- What's the average days-on-market for RENTAL listings here right now (not sales)? A rising rental-DOM trend means longer vacancies and softer asking-rent achievability than the comps imply.
- What's the recent tenant-quality profile in this submarket — average credit score on applications, eviction rate, late-payment / NSF rate, and stable-employment percentage? A property-management company in the area should have these aggregated.
- How much new for-sale + rental construction is in the pipeline within 1–3 miles? Heavy new supply typically softens prices + rents 12–24 months out; constrained supply supports both.
Investment metrics
- 1% rule
- 0.96% ✗
- Cap rate
- 7.72%
- Cash-on-cash
- 5.11%
- DSCR
- 1.23
- GRM
- 8.7
CMA / ARV
- ARV (median comp)
- $239,897
- List price
- $180,000
- Delta
- -24.97%
- Verdict
- UNDERPRICED
- Comps
- 20 within 1.0 mi
Show comp detail 12 sales within ~0.75 mi
| Address | Dist | Beds/Ba | Sqft | Sold | Price | $/sf | Match |
|---|---|---|---|---|---|---|---|
| 9990 Aldridge Dr | 0.09mi | 3/1.5 (+1) | 1,300 (-5%) | 10mo | $202,000 | $155 | 72 |
| 9855 Dupont Dr | 0.15mi | 3/1.0 (+1) | 1,271 (-7%) | 6mo | $175,000 | $138 | 71 |
| 24628 Sprague Rd | 0.45mi | 3/1.5 (+1) | 1,381 (+1%) | 6mo | $244,000 | $177 | 66 |
| 10128 Valleyview Dr | 0.18mi | 3/1.5 (+1) | 1,482 (+8%) | 7mo | $270,000 | $182 | 65 |
| 10209 Bryant Ave | 0.11mi | 3/2.0 (+1) | 1,540 (+12%) | 1mo | $315,000 | $205 | 64 |
| 10176 Dupont Ave | 0.11mi | 3/2.0 (+1) | 1,540 (+12%) | 7mo | $289,900 | $188 | 60 |
| 10310 Greenview Dr | 0.31mi | 3/1.5 (+1) | 1,482 (+8%) | 9mo | $225,300 | $152 | 57 |
| 9749 E River Rd N | 0.73mi | 3/1.5 (+1) | 1,292 (-6%) | 8mo | $236,000 | $183 | 43 |
| 771 Trotter Ln | 0.71mi | 3/2.0 (+1) | 1,428 (+4%) | 11mo | $246,000 | $172 | 42 |
| 23165 Sprague Rd | 0.47mi | 3/2.0 (+1) | 1,500 (+9%) | 14mo | $215,000 | $143 | 41 |
| 8302 Lorraine Dr | 0.72mi | 3/2.0 (+1) | 1,280 (-7%) | 9mo | $280,000 | $219 | 38 |
| 9604 Grist Mill Run | 0.52mi | 3/2.5 (+1) | 1,562 (+14%) | 10mo | $233,000 | $149 | 33 |
Match score weights: distance 35% · size 25% · config 20% · recency 20%. Top-matched comps best support the ARV.
Projected returns pro-forma
-3.0% appreciation · 3.0% rent growth · sell at horizon
- IRR
- -8.4%
- Equity multiple
- 0.69×
- Total profit
- $-15,529
- Equity at exit
- $26,839
- IRR
- 1.1%
- Equity multiple
- 1.08×
- Total profit
- $3,961
- Equity at exit
- $15,563
Cash invested: $50,400 (down + closing). Projections, not guarantees.
Landlord ↔ Tenant lean methodology
- Overall (STATE)
- 73 Landlord-Friendly
- State Ohio
- 73 Landlord-Friendly · R+6
- County
- — inherits STATE
- City
- — inherits STATE
ZIP-level market 44028
- Home prices YoY
- -29.7%
- Active inventory
- 93
- Price-to-rent
- 8.7×
Monthly cashflow live
- Estimated rent
- $1,733 medium interval (Pro) →
- Mortgage (P&I)
- −$944
- Tax from tax record
- −$136 /mo · $1,628/yr
- Insurance
- −$75
- HOA
- −$0
- Vacancy / Maint / Mgmt
- −$364
- Net cashflow
- $215
Break-even live
UW: 25.0% down · 7.5% · 30yr · 1.5% tax · 5.0% vac · 8.0% maint · 8.0% mgmt
Financing live
Cash to close
- Down payment
- $45,000
- Closing costs
- $5,400
- Reserves months
- —
- Total cash needed
- —
Loan-product check · same deal, 3 products live
Conventional
25% down · 7.5% · 30yr
- Down + closing
- —
- Monthly P&I
- —
- Monthly cashflow
- —
- DSCR
- —
- Eligible?
- —
Personal DTI + credit; lowest rate.
DSCR
20% down · 8.5% · 30yr
- Down + closing
- —
- Monthly P&I
- —
- Monthly cashflow
- —
- DSCR
- —
- Eligible?
- —
No personal income docs; deal must DSCR.
Hard money
10% down · 12.0% · 12mo
- Down + closing
- —
- Monthly P&I
- —
- Monthly cashflow
- —
- DSCR
- —
- Eligible?
- —
Short-term bridge; refi at stabilization.
Rent comps 3 comps
| Address | Beds | Baths | Sqft | Rent | $/sqft | DOM | Units | Dist |
|---|---|---|---|---|---|---|---|---|
| 9745 Douglas Ln Olmsted Falls, OH | 1.0–3.0 | 1.0 | 1000 | $1,372 | $1.37 | 1d | 2 | 0.63mi |
| 480 Haverhill Cir Berea, OH | 3.0 | 2.0 | 1864 | $1,945 | $1.04 | 1d | 1 | 0.86mi |
| 9299 Columbia Rd Olmsted Falls, OH | 1.0–2.0 | 1.0–1.5 | 782 | $2,120 | $2.71 | 1d | 1 | 0.93mi |
Listing history 11 events
-
2026-06-18status $180,000 Pending 16 DOM
-
2026-06-18days on market $180,000 Active 16 DOM
-
2026-06-17days on market $180,000 Active 15 DOM
-
2026-06-16days on market $180,000 Active 14 DOM
-
2026-06-15days on market $180,000 Active 13 DOM
-
2026-06-13days on market $180,000 Active 11 DOM
-
2026-06-12days on market $180,000 Active 10 DOM
-
2026-06-09days on market $180,000 Active 7 DOM
-
2026-06-08days on market $180,000 Active 6 DOM
-
2026-06-08status $180,000 Active 5 DOM
-
2026-05-15$180,000 Active 495-char remark
ⓘ Source: listings_history table (triggers on properties + properties_extension) + one-shot
backfill from property_details.listing_events for pre-trigger history.
Tax reassessment forecast OH · Partial reset (capped growth)
- Current annual tax
- $1,628 · $136/mo
- Projected year-2 tax
- $2,218 · $185/mo
- Expected delta
- +$590/yr (+$49/mo · 36.3%)
ⓘ Screening estimate from a state-policy table — verify with the county assessor before closing.
Climate risk First Street
- Flood 1/10 Low FEMA zone X (unshaded) · 0% chance over 30 yrs
- Wildfire 1/10 Low
- Heat 2/10 Low 7 d/yr ≥96°F today · 15 d/yr by 30 yrs out
- Wind 1/10 Low
- Air quality 2/10 Low 1 unhealthy d/yr today · 2 by 30 yrs out
Nearby sold comps map
Loading sold comps map…
Walkable amenities ~0.75 mi
Loading nearby amenities…
Taxation est. · year 1
- Rental income
- $20,797
- − Mortgage interest
- −$10,083
- − Property taxes
- −$1,628
- − Insurance
- −$900
- − Repairs & maintenance
- −$1,664
- − Management
- −$1,664
- − Depreciation
- −$5,236
- Taxable loss
- −$377
- Est. tax savings @ 24.0%
- +$90
- After-tax cash flow
- $2,666/yr
For passive investors: Depreciation is non-cash, so a rental often shows a tax loss while cash-flowing — sheltering income. Rental losses are passive: they offset passive income freely, and up to $25,000/yr can offset ordinary (W-2) income if you actively participate and your MAGI is under $100k (phasing out to $0 by $150k); unused losses carry forward. On sale, claimed depreciation is recaptured at up to 25%, and gains may owe capital-gains tax (a 1031 exchange can defer both). Figures are a year-1 estimate at your 24.0% rate — not tax advice; consult a CPA.
Schools (NCES district)
- District
- Columbia Local
- NCES district ID
- 3904814
- Math proficiency
- 55% ▼ -22.00%
- Reading proficiency
- 71% ▼ -5.00%
- Median HH income
- $68,862
- Composite
- 55.31/100
- National rank
- #1261
- State rank
- #211 of 656 in OH
Livability — Olmsted Falls
- Score
- 73/100
- State rank
- #343
- US rank
- #5595
Category grades
Schools grade is shown separately in the Schools card above.
Census & demographics
- County
- Lorain · 305,041 people
- Metro
- Cleveland, OH
- Population (ZIP)
- 9,313
- Household income
- $86,991
- Rent vs Own
Population outlook (Lorain County) Hauer SSP2
- Today (2025)
- 314,924 people
- By 2030
- 317,546 · +0.8%
- By 2040
- 317,962 · +1.0%
- By 2050
- 312,872 · -0.7%
- By 2075
- 301,806 · -4.2%
- By 2100
- 278,271 · -11.6%
Race, ethnicity, and origin ACS 2023
- Neighborhood character
- Predominantly White (93%)
- Race & ethnicity
- White 93% Two or more races 5% Hispanic / Latino 2%
- Common ancestry
- Romanian 8% Italian 1% Subsaharan African 1%
- Foreign-born
- 3%
- Languages at home
- 96% English-only · Arabic 1% Russian/Polish/Slavic 1% Spanish 1%
Political lean MEDSL · Lorain
- 2024 margin
- Lean R (+5.7) · D 46.7% · R 52.4%
- 2008→2024 swing
- -23.6pp toward R · 2008: 17.9pp · 2024: -5.7pp
- All cycles
- 2024: R+5.7 2020: R+2.5 2016: R+0.3 2012: D+14.4 2008: D+17.9
Not yet ingested
- Civics
- —
Market trends
- HPI YoY
- ▼ -94.16%
- Current HPI
- 223.2008
- Rent YoY
- —
- Metro
- —
- State GDP YoY
- ▲ 1.98%
- F500 in state
- 48
Industry mix (Fortune 500 HQ in OH)
| Industry | F500 HQs | Revenue |
|---|---|---|
| Insurance | 3 | $145B |
|
||
| Industrial Machinery | 3 | $49B |
|
||
| Financial Services | 3 | $24B |
|
||
| Consumer Goods | 2 | $93B |
|
||
| Aerospace / Defense | 2 | $47B |
|
||
| Utilities | 2 | $33B |
|
||
Price history
3 events — show timeline
- 2026-06-07 Relisted — MLSNOW
- 2026-05-20 Pending — MLSNOW
- 2026-05-15 Listed $180,000 MLSNOW
Property tax history
+1.1%/yrLatest (2025): $1,628 · -21.0% YoY. Source: county tax records.
Cash-flow waterfall
monthlySold comps — $/sqft
last 12 mo · ≤1 miLoading sold comps…