 Duplex
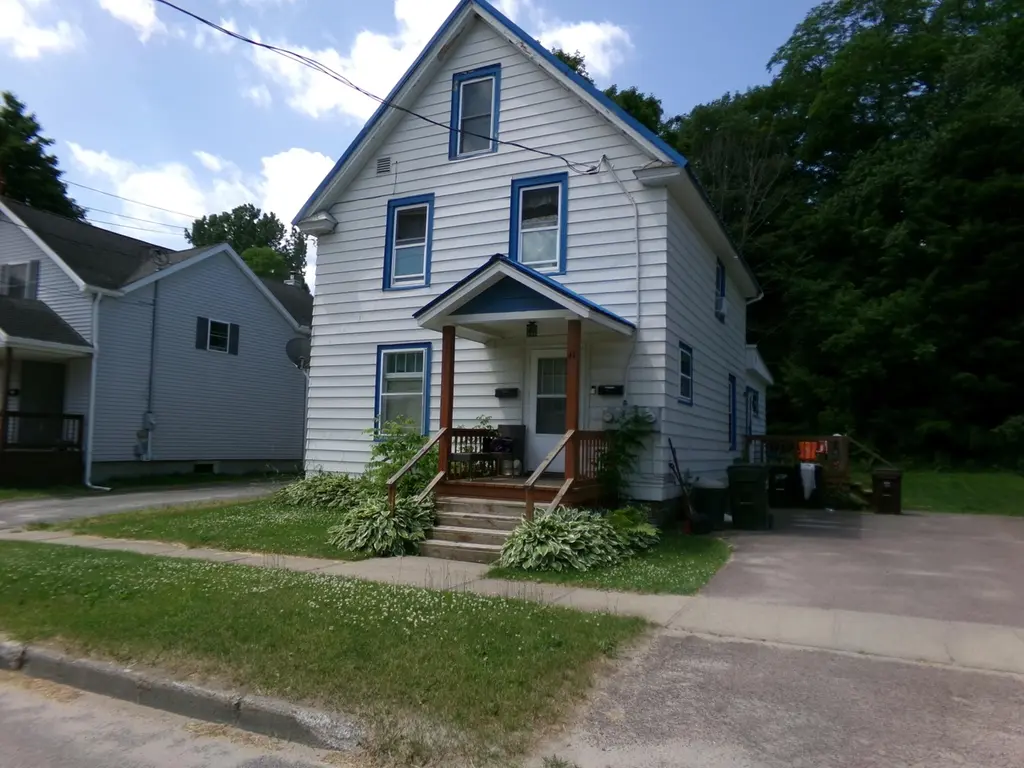
41 Howard Avenue Ave · Malone, NY
Flood risk 9/10 · Severe
- FEMA flood zone
- X
- Chance of flooding over 30 yrs
- 0.99%
- Est. flood insurance / yr
- $473 – $860
Fire risk 3/10 · Minor
- Est. fire insurance / yr
- $691 – $1,283
Heat risk 2/10 · Minimal
- Hot days now (above 90°F)
- 7 days/yr
- Hot days in 30 yrs
- 17 days/yr
Wind risk 1/10 · Minimal
- Chance of severe wind over 30 yrs
- —
Air-quality risk 1/10 · Minimal
- Unhealthy air days now
- 0 days/yr
- Unhealthy air days in 30 yrs
- 0 days/yr
Risk factors via First Street. Map © Google.
Why this score? — see what drove the B+ grade
The composite is a weighted blend of 9 inputs, each scored 0–100. Each bar is that input's sub-score; the figure is the points it added to the 100-point composite (weight × sub-score).
- Cash flow +27.2/30.0
- ARV discount +11.9/15.0
- Appreciation +10.0/10.0
- DSCR +9.5/10.0
- 1% rule +7.8/10.0
- Livability +3.5/5.0
- Rent growth +2.5/5.0
- Condition / age +2.5/5.0
- Schools +2.4/10.0
$139,000
🖨 Deal sheet 📄 Offer letter ✓ Due diligence
Multi-family units
County records classify this as Multi-Family (2-4 Unit). Listing-text estimate: 2 units. confirmed
Listing remarks MLS
This two family is rented with a total of $1,650.00 per month income.
Key facts
- 8,276 sq ft lot
- 2 parking spots
- Built 1880
Neighborhood map
What this means for you Summary
Snapshot
- This is a 2 × 2-bed/1-bath units multifamily listed at $139k.
Deal economics
- At list price, monthly cash flow is $343 ($4k/yr) — positive. Per door: $172/mo.
- The deal already cash-flows at list — no discount required.
- Meets the 1% rule at list price ($2k rent vs $139k).
- Recommended offer: $122k (12.0% below list) — sets the bar for market timing.
- Cap rate 9.7% vs local median 5.3% in Malone — top-decile yield for the area; either an underpriced asset or a hidden risk that comps aren't pricing in. Stress-test before assuming the spread holds.
Location & tenants
- Location reads 70/100 on livability (#437 in NY) — a middle-class / working-renter tenant base. Strengths: cost of living A+, housing A+, health & safety A+; Watch: schools D+, employment D+, crime D-.
- Malone Central School District (town): math 27% / reading 29% proficiency, ranked #581 of 590 in NY (top 98%) — low school quality limits family demand, transient renter base, plan for 1-2y turnover.
- Market conditions: 113 active listings in the ZIP; 124 units permitted in Franklin County in 2024 (0 in 5+ unit buildings).
Forward outlook
- In year one you build about $15k of equity ($961 loan paydown + $14k appreciation (10.0% local appreciation)).
- Franklin County population projected at -14% by 2050 — secular population decline; favor cash flow + early exit over multi-decade hold.
- At projected returns (10.0% appreciation + 3.0% rent growth), your $39k cash investment doubles in ~2 years — after that, you're playing with house money.
- By year 3, paydown + projected appreciation supports a ~$38k cash-out refi (75% LTV) — recoverable capital for the next deal without selling this one.
Negotiation context
- It's been on market 330 days — a 12% lower offer ($122k) is reasonable based on typical stale-listing flexibility.
- 2 sale attempts with the ask held roughly flat each time — persistent listings suggest the price (not the market) is what's stuck; bring a comps-based counter.
- Current owner paid $62k; list at $139k implies a 124% gain — meaningful room to come down on a strong offer.
Risks & watch-outs
- Watch-outs: flood insurance adds $56/mo; built in 1880 — expect roof / HVAC / electrical / plumbing capex.
- Climate carrying-cost: severe flood risk — expect insurance premiums to compound above CPI over the hold.
Questions for the listing agent
- It's been on market 330 days. Have you received any prior offers? Is the seller open to a 12% concession, seller financing, or rate buy-down credit?
- Can we see the unit-by-unit rent roll, current vacancy, and any below-market leases? What's the average tenancy length?
- What capital expenditures (roof, boiler, parking lot, exteriors) have been made in the last 5 years, and what's planned in the next 2?
- Built in 1880 — when were the roof, HVAC, electrical panel, plumbing, and water heater last replaced?
- What's the actual annual flood-insurance premium (NFIP or private), and is the property in a SFHA with mandatory coverage?
- Why hasn't it sold? Are there any deal-killer items the seller is aware of (foundation, flood, title, zoning, code violations)?
- Is there a deadline driving the sale (1031 exchange, divorce, estate, relocation)? That informs how much negotiation room exists.
- Schools are D-rated, which usually means shorter tenancies and higher turnover. Who's the typical renter profile here, and what's been the actual vacancy rate?
- Crime grade is D in this area — have there been break-ins, vandalism, or insurance claims at this property in the last 3 years? What carrier currently insures it and at what premium?
- What's the average days-on-market for RENTAL listings here right now (not sales)? A rising rental-DOM trend means longer vacancies and softer asking-rent achievability than the comps imply.
- What's the recent tenant-quality profile in this submarket — average credit score on applications, eviction rate, late-payment / NSF rate, and stable-employment percentage? A property-management company in the area should have these aggregated.
- How much new apartment / multifamily construction is in the pipeline within 1–3 miles? Heavy new supply (>2% of stock underway) typically softens rents 12–24 months out; light construction supports rent growth.
Investment metrics
- 1% rule
- 1.28% ✓
- Cap rate
- 9.73%
- Cash-on-cash
- 12.29%
- DSCR
- 1.55
- GRM
- 6.5
CMA / ARV
- ARV (median comp)
- $154,022
- List price
- $139,000
- Delta
- -9.75%
- Verdict
- FAIR
- Comps
- 10 within 1.0 mi
Projected returns pro-forma
10.0% appreciation · 3.0% rent growth · sell at horizon
- IRR
- 32.1%
- Equity multiple
- 3.51×
- Total profit
- $97,652
- Equity at exit
- $125,222
- IRR
- 27.7%
- Equity multiple
- 7.95×
- Total profit
- $270,566
- Equity at exit
- $270,046
Cash invested: $38,920 (down + closing). Projections, not guarantees.
Landlord ↔ Tenant lean methodology
- Overall (STATE)
- 15 Strongly Tenant-Friendly
- State New York
- 15 Strongly Tenant-Friendly · D+10
- County
- — inherits STATE
- City
- — inherits STATE
ZIP-level market 12953
- Home prices YoY
- 7.2%
- Active inventory
- 113
- Price-to-rent
- 13.0×
Monthly cashflow live
- Estimated rent
- $1,786 medium interval (Pro) →
- Mortgage (P&I)
- −$729
- Tax from tax record
- −$225 /mo · $2,705/yr
- Insurance
- −$58
- Flood insurance flood zone
- −$56 /mo · $666/yr
- HOA
- −$0
- Vacancy / Maint / Mgmt
- −$375
- Net cashflow
- $343
Break-even live
2-unit breakdown (identical units grouped — click to expand)
| Units | Beds | Baths | Est. rent |
|---|---|---|---|
| 2× units | 2 | 1 | $1,786 |
| #1 | 2 | 1 | $893 |
| #2 | 2 | 1 | $893 |
| Total (2 units) | $1,786 | ||
UW: 25.0% down · 7.5% · 30yr · 1.5% tax · 5.0% vac · 8.0% maint · 8.0% mgmt
Financing live
Cash to close
- Down payment
- $34,750
- Closing costs
- $4,170
- Reserves months
- —
- Total cash needed
- —
Loan-product check · same deal, 3 products live
Conventional
25% down · 7.5% · 30yr
- Down + closing
- —
- Monthly P&I
- —
- Monthly cashflow
- —
- DSCR
- —
- Eligible?
- —
Personal DTI + credit; lowest rate.
DSCR
20% down · 8.5% · 30yr
- Down + closing
- —
- Monthly P&I
- —
- Monthly cashflow
- —
- DSCR
- —
- Eligible?
- —
No personal income docs; deal must DSCR.
Hard money
10% down · 12.0% · 12mo
- Down + closing
- —
- Monthly P&I
- —
- Monthly cashflow
- —
- DSCR
- —
- Eligible?
- —
Short-term bridge; refi at stabilization.
Listing history 20 events
-
2026-06-18days on market $139,000 Active 330 DOM
-
2026-06-17days on market $139,000 Active 329 DOM
-
2026-06-16days on market $139,000 Active 328 DOM
-
2026-06-15days on market $139,000 Active 327 DOM
-
2026-06-13days on market $139,000 Active 325 DOM
-
2026-06-12days on market $139,000 Active 324 DOM
-
2026-06-09days on market $139,000 Active 321 DOM
-
2026-06-08days on market $139,000 Active 320 DOM
-
2026-06-07days on market $139,000 Active 319 DOM
-
2026-06-07days on market $139,000 Active 318 DOM
-
2026-06-04days on market $139,000 Active 315 DOM
-
2026-06-02days on market $139,000 Active 314 DOM
-
2026-06-01days on market $139,000 Active 313 DOM
-
2026-05-31days on market $139,000 Active 312 DOM
-
2026-01-21status Active 69-char remark
Show marketing remark (69 chars)
This two family is rented with a total of $1,650.00 per month income.
-
2025-12-25historical 69-char remark
Show marketing remark (69 chars)
This two family is rented with a total of $1,650.00 per month income.
-
2025-06-26$139,000 Active 69-char remark
Show marketing remark (69 chars)
This two family is rented with a total of $1,650.00 per month income.
-
2020-12-01soldstatus $62,000
-
2007-09-10soldstatus $31,800
-
1994-02-18soldstatus $36,000
ⓘ Source: listings_history table (triggers on properties + properties_extension) + one-shot
backfill from property_details.listing_events for pre-trigger history.
Tax reassessment forecast NY · Partial reset (capped growth)
- Current annual tax
- $2,705 · $225/mo
- Projected year-2 tax
- $2,705 · $225/mo
- Expected delta
- $0/yr ($0/mo · 0.0%)
ⓘ Screening estimate from a state-policy table — verify with the county assessor before closing.
Climate risk First Street
- Flood 9/10 Extreme FEMA zone X · 99% chance over 30 yrs
- Wildfire 3/10 Moderate
- Heat 2/10 Low 7 d/yr ≥90°F today · 17 d/yr by 30 yrs out
- Wind 1/10 Low
- Air quality 1/10 Low 0 unhealthy d/yr today · 0 by 30 yrs out
Nearby sold comps map
Loading sold comps map…
Walkable amenities ~0.75 mi
Loading nearby amenities…
Taxation est. · year 1
- Rental income
- $21,432
- − Mortgage interest
- −$7,786
- − Property taxes
- −$2,705
- − Insurance
- −$1,362
- − Repairs & maintenance
- −$1,715
- − Management
- −$1,715
- − Depreciation
- −$4,044
- Taxable income
- $2,107
- Est. tax owed @ 24.0%
- −$506
- After-tax cash flow
- $3,612/yr
For passive investors: Depreciation is non-cash, so a rental often shows a tax loss while cash-flowing — sheltering income. Rental losses are passive: they offset passive income freely, and up to $25,000/yr can offset ordinary (W-2) income if you actively participate and your MAGI is under $100k (phasing out to $0 by $150k); unused losses carry forward. On sale, claimed depreciation is recaptured at up to 25%, and gains may owe capital-gains tax (a 1031 exchange can defer both). Figures are a year-1 estimate at your 24.0% rate — not tax advice; consult a CPA.
Schools (NCES district)
- District
- Malone Central School District
- NCES district ID
- 3618180
- Math proficiency
- 27% ▼ -16.00%
- Reading proficiency
- 29% ▼ -11.00%
- Median HH income
- $46,681
- Composite
- 24.23/100
- National rank
- #7725
- State rank
- #581 of 590 in NY
Livability — Malone
- Score
- 70/100
- State rank
- #437
- US rank
- #7656
Category grades
Schools grade is shown separately in the Schools card above.
Census & demographics
- Census place
- Malone, NY
- Population (ZIP)
- 12,842
Population outlook (Franklin County) Hauer SSP2
- Today (2025)
- 48,098 people
- By 2030
- 46,790 · -2.7%
- By 2040
- 44,400 · -7.7%
- By 2050
- 41,256 · -14.2%
- By 2075
- 32,190 · -33.1%
- By 2100
- 23,407 · -51.3%
Race, ethnicity, and origin ACS 2023
- Neighborhood character
- Predominantly White (83%)
- Race & ethnicity
- White 83% Black 9% Hispanic / Latino 6%
- Hispanic origin (detail)
- Puerto Rican 2%
- Common ancestry
- Lithuanian 16% Slovak 5% Italian 2%
- Foreign-born
- 3% · Canada
- Languages at home
- 94% English-only · Spanish 4% Other Indo-European 1% French/Haitian/Cajun 1%
Political lean MEDSL · Franklin
- 2024 margin
- Lean R (+9.0) · D 45.5% · R 54.5%
- 2008→2024 swing
- -31.2pp toward R · 2008: 22.2pp · 2024: -9.0pp
- All cycles
- 2024: R+9.0 2020: R+2.2 2016: R+7.4 2012: D+26.3 2008: D+22.2
Not yet ingested
- Civics
- —
Market trends
- HPI YoY
- ▲ 17.73%
- Current HPI
- 263.2406
- Rent YoY
- —
- Metro
- —
- State GDP YoY
- ▲ 2.60%
- F500 in state
- 92
Industry mix (Fortune 500 HQ in NY)
| Industry | F500 HQs | Revenue |
|---|---|---|
| Financial Services | 10 | $950B |
|
||
| Consumer Goods | 9 | $162B |
|
||
| Insurance | 4 | $225B |
|
||
| Telecommunications | 2 | $144B |
|
||
| Pharmaceuticals | 2 | $112B |
|
||
| Media / Entertainment | 2 | $69B |
|
||
Price history
+286.1% since first listed6 events — show timeline
- 2026-01-21 Relisted — ACVMLS
- 2025-12-25 Delisted — ACVMLS
- 2025-06-26 Listed $139,000 ACVMLS
- 2020-12-01 Sold (Public Records) $62,000 Public Records
- 2007-09-10 Sold (Public Records) $31,800 Public Records
- 1994-02-18 Sold (Public Records) $36,000 Public Records
Property tax history
+6.8%/yrLatest (2025): $2,705 · -0.7% YoY. Source: county tax records.
Cash-flow waterfall
monthlySold comps — $/sqft
last 12 mo · ≤1 miLoading sold comps…