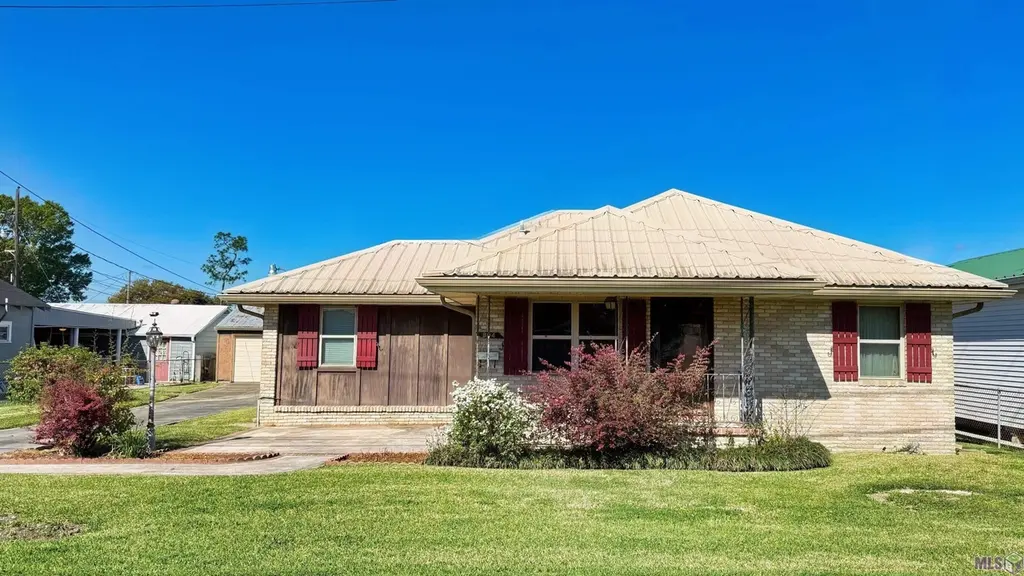
804 Arms St · Thibodaux, LA
Flood risk 1/10 · Minimal
- FEMA flood zone
- X
- Chance of flooding over 30 yrs
- 0.0%
- Est. flood insurance / yr
- $507 – $1,088
Fire risk 1/10 · Minimal
- Est. fire insurance / yr
- $1,269 – $2,357
Heat risk 9/10 · Severe
- Hot days now (above 108°F)
- 7 days/yr
- Hot days in 30 yrs
- 21 days/yr
Wind risk 9/10 · Severe
- Chance of severe wind over 30 yrs
- 99.0%
Air-quality risk 1/10 · Minimal
- Unhealthy air days now
- 0 days/yr
- Unhealthy air days in 30 yrs
- 0 days/yr
Risk factors via First Street. Map © Google.
Why this score? — see what drove the D grade
The composite is a weighted blend of 9 inputs, each scored 0–100. Each bar is that input's sub-score; the figure is the points it added to the 100-point composite (weight × sub-score).
- Cash flow +14.7/30.0
- ARV discount +7.5/15.0
- DSCR +4.5/10.0
- Livability +4.2/5.0
- 1% rule +4.1/10.0
- Schools +3.4/10.0
- Rent growth +3.2/5.0
- Condition / age +2.5/5.0
- Appreciation +0.0/10.0
$190,000
🖨 Deal sheet (PDF) 📄 Offer letter ✓ Due diligence
Listing remarks MLS
Spacious home featuring a large living room and oversized den, offering plenty of space for family gatherings and entertaining. Outside, you'll find a detached double garage with workshop space and a convenient half bath. Additional highlights include a whole-house Generac generator and a durable metal roof. While some updating may be desired, this solidly built home offers great potential and value. Don't miss this opportunity to make it your own!
Key facts
- Oversized den
- Workshop space
- Half bath
Tags
Property features AI
Exterior
- Parking: Garage with concrete driveway (total 4 parking spaces)
- Utilities: Public water; Public sewer
- Home design: Detached single-family residence; Residential property
- Construction: Built with wood siding and brick; Slab foundation
- Exterior features: Wood siding and brick exterior; Lot in Ridgefield Westside subdivision; Lot dimensions approximately 80 x 110
Interior
- Bathrooms: 2 full bathrooms
- Heating & cooling: Central heating (electric); Central air conditioning
- Interior features: Central heating and cooling
Neighborhood map
What this means for you Summary
Snapshot
- This is a 3-bed/2.0-bath other listed at $190k.
Deal economics
- At list price, monthly cash flow is $49 ($585/yr) — positive.
- The deal already cash-flows at list — no discount required.
- To meet the 1% rule (rent ≥ 1% of price), the offer needs to be $172k (9.3% below list).
- Recommended offer: $172k (9.3% below list) — sets the bar for 1% rule.
- Cap rate 6.6% vs local median 3.8% in Thibodaux — top-decile yield for the area; either an underpriced asset or a hidden risk that comps aren't pricing in. Stress-test before assuming the spread holds.
Location & tenants
- Location reads 84/100 on livability (#2 in LA, #723 nationally) — a professional / high-income tenant draw. Strengths: commute A+, cost of living A+, health & safety A+; Watch: crime C-, employment F.
- Lafourche Parish (other): math 31% / reading 49% proficiency, ranked #22 of 98 in LA (top 22%) — families likely to look elsewhere, expect single-tenant / working-renter base with shorter leases.
- Zoned schools: Bayou Community Academy Charter School (math 63% / reading 79%, grade A-, #23 of 646 statewide, top 4%, 515 students, 30% FRL, charter); West Thibodaux Middle School (math 12% / reading 37%, grade F, #141 of 218 statewide, top 65%, 430 students, 74% FRL); Thibodaux High School (math 26% / reading 45%, grade F, #104 of 265 statewide, top 39%, 1,454 students, 60% FRL) — zoned schools at 55% FRL track the district average.
- Market conditions: Rents rising (+2.9%/yr); 515 active listings in the ZIP; 1 comparable units currently listed for rent nearby; 319 units permitted in Lafourche Parish in 2024 (0 in 5+ unit buildings).
- This rent runs 35% of the median local income ($58k/yr) — at the standard rent-burdened threshold; future hikes will face affordability resistance.
Forward outlook
- Local home prices are declining (-3.0%/yr); year-one equity from $1k of loan paydown is wiped out by about $6k of value loss. Plan a longer hold.
Negotiation context
- It's been on market 16 days — a 2% lower offer ($187k) is reasonable based on typical stale-listing flexibility.
- 2 sale attempts with the ask held roughly flat each time — persistent listings suggest the price (not the market) is what's stuck; bring a comps-based counter.
Risks & watch-outs
- Watch-outs: built in 1950 — expect roof / HVAC / electrical / plumbing capex.
- Climate carrying-cost: severe wind risk, 99% chance of damaging wind over 30y; extreme-heat days projected 7→21/yr by 2055 (HVAC capex compounding) — expect insurance premiums to compound above CPI over the hold.
Questions for the listing agent
- Built in 1950 — when were the roof, HVAC, electrical panel, plumbing, and water heater last replaced?
- Is there a deadline driving the sale (1031 exchange, divorce, estate, relocation)? That informs how much negotiation room exists.
- Schools are A-rated — typically a magnet for longer-tenancy family renters. What's the average tenant stay here, and is there a school-zone premium baked into asking?
- The area grade is low — what's the realistic commute time and amenity access for the typical tenant pool here? Any planned neighborhood developments (good or bad) we should know about?
- What's the average days-on-market for RENTAL listings here right now (not sales)? A rising rental-DOM trend means longer vacancies and softer asking-rent achievability than the comps imply.
- What's the recent tenant-quality profile in this submarket — average credit score on applications, eviction rate, late-payment / NSF rate, and stable-employment percentage? A property-management company in the area should have these aggregated.
- How much new for-sale + rental construction is in the pipeline within 1–3 miles? Heavy new supply typically softens prices + rents 12–24 months out; constrained supply supports both.
Investment metrics
- 1% rule
- 0.91% ✗
- Cap rate
- 6.60%
- Cash-on-cash
- 1.10%
- DSCR
- 1.05
- GRM
- 9.2
CMA / ARV
No comps found within radius.
Projected returns pro-forma
-3.0% appreciation · 2.9% rent growth · sell at horizon
- IRR
- -14.6%
- Equity multiple
- 0.48×
- Total profit
- $-27,833
- Equity at exit
- $28,330
- IRR
- -6.1%
- Equity multiple
- 0.61×
- Total profit
- $-20,845
- Equity at exit
- $16,428
Cash invested: $53,200 (down + closing). Projections, not guarantees.
Landlord ↔ Tenant lean methodology
- Overall (STATE)
- 90 Strongly Landlord-Friendly
- State Louisiana
- 90 Strongly Landlord-Friendly · R+12
- County
- — inherits STATE
- City
- — inherits STATE
ZIP-level market 70301
- Rents YoY
- 2.9%
- Active inventory
- 515
- Price-to-rent
- 9.2×
Monthly cashflow live
- Estimated rent
- $1,724 medium interval (Pro) →
- Mortgage (P&I)
- −$996
- Tax est. 1.5%
- −$238 /mo · $2,850/yr
- Insurance
- −$79
- HOA
- −$0
- Vacancy / Maint / Mgmt
- −$362
- Net cashflow
- $49
Break-even live
Sensitivity live
| Price | -10% $180 | -5% $114 | +0% $49 | +5% $-17 | +10% $-83 |
|---|---|---|---|---|---|
| Rent | -10% $-87 | -5% $-19 | +0% $49 | +5% $117 | +10% $185 |
| Rate | -1.0pp $144 | -0.5pp $97 | base $49 | +0.5pp $-1 | +1.0pp $-51 |
UW: 25.0% down · 7.5% · 30yr · 1.5% tax · 5.0% vac · 8.0% maint · 8.0% mgmt
Financing live
Cash to close
- Down payment
- $47,500
- Closing costs
- $5,700
- Reserves months
- —
- Total cash needed
- —
Loan-product check · same deal, 3 products live
Conventional
25% down · 7.5% · 30yr
- Down + closing
- —
- Monthly P&I
- —
- Monthly cashflow
- —
- DSCR
- —
- Eligible?
- —
Personal DTI + credit; lowest rate.
DSCR
20% down · 8.5% · 30yr
- Down + closing
- —
- Monthly P&I
- —
- Monthly cashflow
- —
- DSCR
- —
- Eligible?
- —
No personal income docs; deal must DSCR.
Hard money
10% down · 12.0% · 12mo
- Down + closing
- —
- Monthly P&I
- —
- Monthly cashflow
- —
- DSCR
- —
- Eligible?
- —
Short-term bridge; refi at stabilization.
Rent comps 1 comps
| Address | Beds | Baths | Sqft | Rent | $/sqft | DOM | Units | Dist |
|---|---|---|---|---|---|---|---|---|
| 208 Diplomat Way Thibodaux, LA | 3.0 | 2.0 | 1892 | $2,000 | $1.06 | 45d | 1 | 1.29mi |
Listing history 13 events
-
2026-06-22days on market $190,000 Active 16 DOM
-
2026-06-19days on market $190,000 Active 14 DOM
-
2026-06-18days on market $190,000 Active 13 DOM
-
2026-06-17days on market $190,000 Active 12 DOM
-
2026-06-16days on market $190,000 Active 11 DOM
-
2026-06-15days on market $190,000 Active 10 DOM
-
2026-06-14days on market $190,000 Active 8 DOM
-
2026-06-13days on market $190,000 Active 7 DOM
-
2026-06-10days on market $190,000 Active 5 DOM
-
2026-06-09days on market $190,000 Active 4 DOM
-
2026-06-08days on market $190,000 Active 3 DOM
-
2026-06-07remarks 452-char remark
-
2026-06-07$190,000 Active 2 DOM
ⓘ Source: listings_history table (triggers on properties + properties_extension) + one-shot
backfill from property_details.listing_events for pre-trigger history.
Climate risk First Street
- Flood 1/10 Low FEMA zone X · 0% chance over 30 yrs
- Wildfire 1/10 Low
- Heat 9/10 Extreme 7 d/yr ≥108°F today · 21 d/yr by 30 yrs out
- Wind 9/10 Extreme 99% chance of damaging wind over 30 yrs
- Air quality 1/10 Low 0 unhealthy d/yr today · 0 by 30 yrs out
Nearby sold comps map
Loading sold comps map…
Walkable amenities ~0.75 mi
Loading nearby amenities…
Taxation est. · year 1
- Rental income
- $20,685
- − Mortgage interest
- −$10,643
- − Property taxes
- −$2,850
- − Insurance
- −$950
- − Repairs & maintenance
- −$1,655
- − Management
- −$1,655
- − Depreciation
- −$5,527
- Taxable loss
- −$2,595
- Est. tax savings @ 24.0%
- +$623
- After-tax cash flow
- $1,207/yr
For passive investors: Depreciation is non-cash, so a rental often shows a tax loss while cash-flowing — sheltering income. Rental losses are passive: they offset passive income freely, and up to $25,000/yr can offset ordinary (W-2) income if you actively participate and your MAGI is under $100k (phasing out to $0 by $150k); unused losses carry forward. On sale, claimed depreciation is recaptured at up to 25%, and gains may owe capital-gains tax (a 1031 exchange can defer both). Figures are a year-1 estimate at your 24.0% rate — not tax advice; consult a CPA.
Schools (NCES district)
- District
- Lafourche Parish
- NCES district ID
- 2200900
- Math proficiency
- 31% ▼ -43.00%
- Reading proficiency
- 49% ▼ -32.00%
- Median HH income
- $49,703
- Composite
- 34.4/100
- National rank
- #5205
- State rank
- #22 of 98 in LA
Livability — Thibodaux
- Score
- 84/100
- State rank
- #2
- US rank
- #723
Category grades
Schools grade is shown separately in the Schools card above.
Census & demographics
- Census place
- Thibodaux, LA
- County
- Lafourche Parish · 50,095 people
- City population
- 50,095
- Metro
- Houma-Thibodaux, LA
- Population (ZIP)
- 50,095
- Household income
- $58,394
- Rent vs Own
- Severe rent burden
- 1513.0
Population outlook (Lafourche County) Hauer SSP2
- Today (2025)
- 102,122 people
- By 2030
- 103,361 · +1.2%
- By 2040
- 104,401 · +2.2%
- By 2050
- 102,795 · +0.7%
- By 2075
- 95,599 · -6.4%
- By 2100
- 82,303 · -19.4%
Race, ethnicity, and origin ACS 2023
- Neighborhood character
- Predominantly White (71%)
- Race & ethnicity
- White 71% Black 20% Hispanic / Latino 5% Two or more races 5% Native American 1%
- Hispanic origin (detail)
- Mexican 3%
- Common ancestry
- Lithuanian 18% Italian 1% Slovak 1%
- Foreign-born
- 2% · Canada
- Languages at home
- 95% English-only · French/Haitian/Cajun 2% Spanish 2%
Political lean MEDSL · Lafourche
- 2024 margin
- Solid R (+62.1) · D 18.4% · R 80.4% · Other 1.2%
- 2008→2024 swing
- -16.1pp toward R · 2008: -46.0pp · 2024: -62.1pp
- All cycles
- 2024: R+62.1 2020: R+60.3 2016: R+56.5 2012: R+48.5 2008: R+46.0
Not yet ingested
- Civics
- —
Market trends
- HPI YoY
- ▼ -98.35%
- Current HPI
- 124.5559
- Rent YoY
- ▲ 2.90%
- Metro
- Houma-Thibodaux, LA
- State GDP YoY
- ▲ 3.29%
- F500 in state
- 10
Industry mix (Fortune 500 HQ in LA)
| Industry | F500 HQs | Revenue |
|---|---|---|
| Telecommunications | 2 | $23B |
|
||
| Utilities | 1 | $12B |
|
||
| Wholesale / Distribution | 1 | $5B |
|
||
| Advertising | 1 | $2B |
|
||
Price history
+0.0% since first listed2 events — show timeline
- 2026-06-04 Listed $190,000 AcadianaMLS
- 2026-06-04 Listed $190,000 GBRMLS
Property tax history
-3.9%/yrLatest (2024): $140 · -85.7% YoY. Source: county tax records.
Cash-flow waterfall
monthlySold comps — $/sqft
last 12 mo · ≤1 miLoading sold comps…