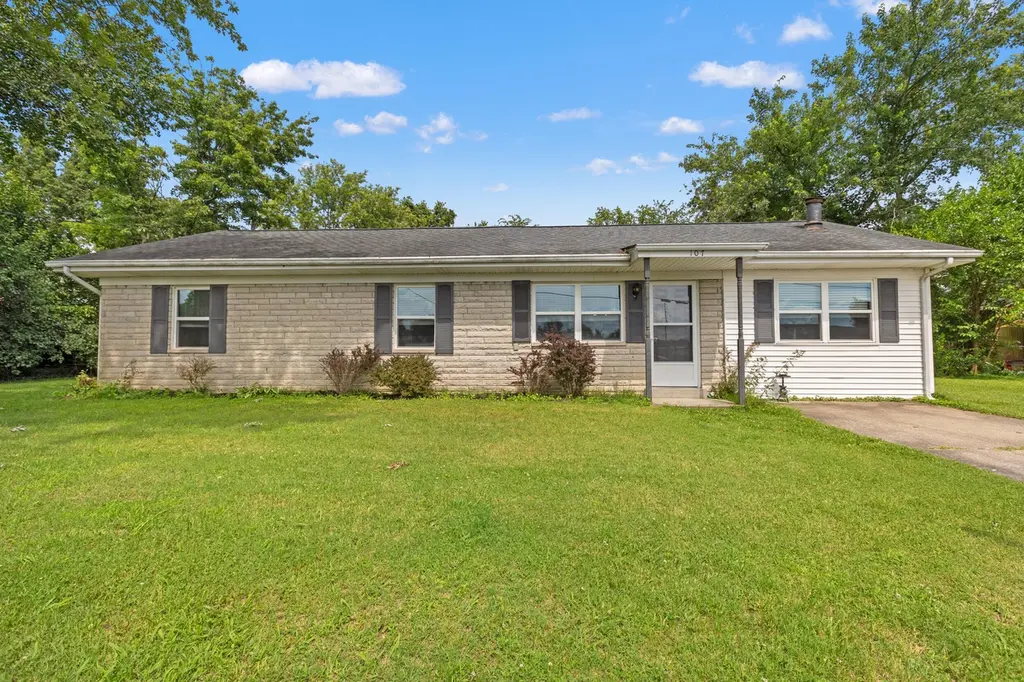
107 Elaine Ave · Richmond, KY
Flood risk 1/10 · Minimal
- FEMA flood zone
- X (unshaded)
- Chance of flooding over 30 yrs
- 0.0%
- Est. flood insurance / yr
- $507 – $1,088
Fire risk 4/10 · Minor
- Est. fire insurance / yr
- $839 – $1,559
Heat risk 4/10 · Minor
- Hot days now (above 102°F)
- 7 days/yr
- Hot days in 30 yrs
- 19 days/yr
Wind risk 3/10 · Minor
- Chance of severe wind over 30 yrs
- 5.0%
Air-quality risk 1/10 · Minimal
- Unhealthy air days now
- 0 days/yr
- Unhealthy air days in 30 yrs
- 0 days/yr
Risk factors via First Street. Map © Google.
Why this score? — see what drove the C- grade
The composite is a weighted blend of 9 inputs, each scored 0–100. Each bar is that input's sub-score; the figure is the points it added to the 100-point composite (weight × sub-score).
- Cash flow +15.2/30.0
- ARV discount +15.0/15.0
- DSCR +4.7/10.0
- 1% rule +3.6/10.0
- Livability +3.5/5.0
- Schools +3.3/10.0
- Rent growth +3.2/5.0
- Condition / age +2.5/5.0
- Appreciation +0.0/10.0
$199,000
🖨 Deal sheet 📄 Offer letter ✓ Due diligence
Listing remarks
Bedford Stone Beauty! Solid, timeless, and always in style! This classic Bedford stone ranch is the kind of home buyers search for but rarely find. Sitting in a quiet, low-traffic neighborhood, it offers true one-level living with a spacious yard. The shed adds extra storage for tools, toys, or weekend projects, while the peaceful setting makes coming home feel like a reset every day. If you've been waiting for a thoughtfully built ranch with character, this is the one you don't want to miss!
Key facts
- Spacious yard
- Extra storage
- Peaceful setting
Tags
Property features AI
Exterior
- Parking: Driveway
- Utilities: Public water; Public sewer; Electricity connected; Sewer connected; Water connected
- Home design: One-story house
- Construction: Stone and vinyl siding exterior; Shingle roof; Block foundation; Built as a house (structure type)
- Exterior features: Shed(s); Many trees; Neighborhood view
Interior
- Kitchen: Microwave; Range; Refrigerator
- Bedrooms: Total rooms: 7
- Flooring: Carpet
- Bathrooms: 1 full bathroom
- Heating & cooling: Electric heating; Heat pump; Electric cooling; Heat pump cooling
- Interior features: Primary bedroom on the first floor; Ceiling fans; Blinds on windows; Crawl space basement; No fireplace
- Laundry & utility: Washer hookup on main level; Electric dryer hookup
Neighborhood map
What this means for you Summary
Snapshot
- This is a 3-bed/1.0-bath other listed at $199k.
Deal economics
- At list price, monthly cash flow is $69 ($824/yr) — positive.
- The deal already cash-flows at list — no discount required.
- To meet the 1% rule (rent ≥ 1% of price), the offer needs to be $170k (14.5% below list).
- Recommended offer: $170k (14.5% below list) — sets the bar for 1% rule.
- Cap rate 6.7% vs local median 3.1% in Richmond — top-decile yield for the area; either an underpriced asset or a hidden risk that comps aren't pricing in. Stress-test before assuming the spread holds.
Location & tenants
- Location reads 69/100 on livability (#163 in KY) — a middle-class / working-renter tenant base. Strengths: cost of living A+, health & safety A+, housing A; Watch: amenities F, commute F, employment F.
- Madison County (town): math 31% / reading 47% proficiency, ranked #35 of 165 in KY (top 21%) — families likely to look elsewhere, expect single-tenant / working-renter base with shorter leases.
- Zoned schools: Waco Elementary School (math 22% / reading 32%, grade F, #434 of 676 statewide, top 69%, 428 students, 57% FRL); Clark Moores Middle School (math 16% / reading 47%, grade F, #125 of 217 statewide, top 63%, 546 students, 60% FRL); Madison Central High School (math 29% / reading 44%, grade F, #70 of 254 statewide, top 27%, 2,226 students, 47% FRL).
- Market conditions: Rents rising (+2.8%/yr); 487 active listings in the ZIP; 2 comparable units currently listed for rent nearby; 453 units permitted in Madison County in 2024 (64 in 5+ unit buildings).
- This rent runs 32% of the median local income ($63k/yr) — at the standard rent-burdened threshold; future hikes will face affordability resistance.
Forward outlook
- Local home prices are declining (-3.0%/yr); year-one equity from $1k of loan paydown is wiped out by about $6k of value loss. Plan a longer hold.
- Madison County population projected at +28% by 2050 — long-run rental-demand tailwind backs the buy-and-hold thesis.
Negotiation context
- It's been on market 49 days — a 3% lower offer ($193k) is reasonable based on typical stale-listing flexibility.
- 13 sale attempts since 19y ago with the ask held roughly flat each time — persistent listings suggest the price (not the market) is what's stuck; bring a comps-based counter.
Questions for the listing agent
- It's been on market 49 days. Have you received any prior offers? Is the seller open to a 14% concession, seller financing, or rate buy-down credit?
- Is there a deadline driving the sale (1031 exchange, divorce, estate, relocation)? That informs how much negotiation room exists.
- Schools are D-rated, which usually means shorter tenancies and higher turnover. Who's the typical renter profile here, and what's been the actual vacancy rate?
- What's the average days-on-market for RENTAL listings here right now (not sales)? A rising rental-DOM trend means longer vacancies and softer asking-rent achievability than the comps imply.
- What's the recent tenant-quality profile in this submarket — average credit score on applications, eviction rate, late-payment / NSF rate, and stable-employment percentage? A property-management company in the area should have these aggregated.
- How much new for-sale + rental construction is in the pipeline within 1–3 miles? Heavy new supply typically softens prices + rents 12–24 months out; constrained supply supports both.
Investment metrics
- 1% rule
- 0.86% ✗
- Cap rate
- 6.71%
- Cash-on-cash
- 1.48%
- DSCR
- 1.07
- GRM
- 9.7
CMA / ARV
- ARV (median comp)
- $299,595
- List price
- $199,000
- Delta
- -33.58%
- Verdict
- UNDERPRICED
- Comps
- 20 within 1.0 mi
Projected returns pro-forma
-3.0% appreciation · 2.82% rent growth · sell at horizon
- IRR
- -14.2%
- Equity multiple
- 0.49×
- Total profit
- $-28,214
- Equity at exit
- $29,672
- IRR
- -5.7%
- Equity multiple
- 0.64×
- Total profit
- $-20,336
- Equity at exit
- $17,206
Cash invested: $55,720 (down + closing). Projections, not guarantees.
Landlord ↔ Tenant lean methodology
- Overall (STATE)
- 83 Strongly Landlord-Friendly
- State Kentucky
- 83 Strongly Landlord-Friendly · R+16
- County
- — inherits STATE
- City
- — inherits STATE
ZIP-level market 40475
- Home prices YoY
- -22.7%
- Rents YoY
- 2.8%
- Active inventory
- 487
- Price-to-rent
- 9.7×
Monthly cashflow live
- Estimated rent
- $1,702 medium interval (Pro) →
- Mortgage (P&I)
- −$1,044
- Tax from tax record
- −$149 /mo · $1,792/yr
- Insurance
- −$83
- HOA
- −$0
- Vacancy / Maint / Mgmt
- −$357
- Net cashflow
- $69
Break-even live
UW: 25.0% down · 7.5% · 30yr · 1.5% tax · 5.0% vac · 8.0% maint · 8.0% mgmt
Financing live
Cash to close
- Down payment
- $49,750
- Closing costs
- $5,970
- Reserves months
- —
- Total cash needed
- —
Loan-product check · same deal, 3 products live
Conventional
25% down · 7.5% · 30yr
- Down + closing
- —
- Monthly P&I
- —
- Monthly cashflow
- —
- DSCR
- —
- Eligible?
- —
Personal DTI + credit; lowest rate.
DSCR
20% down · 8.5% · 30yr
- Down + closing
- —
- Monthly P&I
- —
- Monthly cashflow
- —
- DSCR
- —
- Eligible?
- —
No personal income docs; deal must DSCR.
Hard money
10% down · 12.0% · 12mo
- Down + closing
- —
- Monthly P&I
- —
- Monthly cashflow
- —
- DSCR
- —
- Eligible?
- —
Short-term bridge; refi at stabilization.
Rent comps 2 comps
| Address | Beds | Baths | Sqft | Rent | $/sqft | DOM | Units | Dist |
|---|---|---|---|---|---|---|---|---|
| 165 Candy Apple Ln Unit A Richmond, KY | 3.0 | 2.0 | 1625 | $1,995 | $1.23 | 43d | 1 | 0.48mi |
| 340 Pageant DR Richmond, KY | 3.0 | 2.0 | 1625 | $2,100 | $1.29 | 14d | 1 | 0.51mi |
Listing history 50 events
-
2026-06-18days on market $199,000 Active 49 DOM
-
2026-06-17days on market $199,000 Active 48 DOM
-
2026-06-16days on market $199,000 Active 47 DOM
-
2026-06-15days on market $199,000 Active 46 DOM
-
2026-06-14days on market $199,000 Active 44 DOM
-
2026-06-10days on market $199,000 Active 41 DOM
-
2026-06-09days on market $199,000 Active 40 DOM
-
2026-06-08days on market $199,000 Active 39 DOM
-
2026-06-07days on market $199,000 Active 38 DOM
-
2026-06-05days on market $199,000 Active 35 DOM
-
2026-06-03days on market $199,000 Active 34 DOM
-
2026-06-02days on market $199,000 Active 33 DOM
-
2026-06-01days on market $199,000 Active 32 DOM
-
2026-05-31days on market $199,000 Active 31 DOM
-
2026-05-31days on market $199,000 Active 30 DOM
-
2026-04-30$199,000 Active 497-char remark
-
2026-04-30historical
-
2026-01-23$199,000 Active
-
2025-12-07historical
-
2025-09-03price $199,000
-
2025-07-14price $205,000
-
2025-06-20$210,000 Active
-
2024-08-09soldstatus $190,000
-
2024-07-19soldstatus $190,000 Closed
-
2024-06-14status Pending
-
2024-06-13price $192,500
-
2024-06-06$194,900 Active
-
2024-06-06historical
-
2024-06-04price $194,900
-
2024-05-28price $199,900
-
2024-05-23price $209,900
-
2024-05-12$214,900 Active
-
2021-01-20soldstatus $135,000
-
2021-01-08soldstatus $135,000 Sold
-
2020-12-23status Pending
-
2020-12-21price $137,500
-
2020-12-21status Active
-
2020-12-07historical
-
2020-12-04historical Contingent
-
2020-12-03status Active
-
2020-11-23status Pending
-
2020-11-22price $139,500
-
2020-11-06$142,500 Active
-
2020-05-14soldstatus $50,000 Sold
-
2020-04-10status Pending
-
2020-04-08status Active
-
2020-03-10status Pending
-
2020-02-28$48,000 Active
-
2015-02-03soldstatus $82,000
-
2015-01-29soldstatus $82,000
ⓘ Source: listings_history table (triggers on properties + properties_extension) + one-shot
backfill from property_details.listing_events for pre-trigger history.
Tax reassessment forecast KY · Resets to sale price
- Current annual tax
- $1,792 · $149/mo
- Projected year-2 tax
- $1,792 · $149/mo
- Expected delta
- $0/yr ($0/mo · 0.0%)
ⓘ Screening estimate from a state-policy table — verify with the county assessor before closing.
Climate risk First Street
- Flood 1/10 Low FEMA zone X (unshaded) · 0% chance over 30 yrs
- Wildfire 4/10 Moderate
- Heat 4/10 Moderate 7 d/yr ≥102°F today · 19 d/yr by 30 yrs out
- Wind 3/10 Moderate 5% chance of damaging wind over 30 yrs
- Air quality 1/10 Low 0 unhealthy d/yr today · 0 by 30 yrs out
Nearby sold comps map
Loading sold comps map…
Walkable amenities ~0.75 mi
Loading nearby amenities…
Taxation est. · year 1
- Rental income
- $20,423
- − Mortgage interest
- −$11,147
- − Property taxes
- −$1,792
- − Insurance
- −$995
- − Repairs & maintenance
- −$1,634
- − Management
- −$1,634
- − Depreciation
- −$5,789
- Taxable loss
- −$2,568
- Est. tax savings @ 24.0%
- +$616
- After-tax cash flow
- $1,441/yr
For passive investors: Depreciation is non-cash, so a rental often shows a tax loss while cash-flowing — sheltering income. Rental losses are passive: they offset passive income freely, and up to $25,000/yr can offset ordinary (W-2) income if you actively participate and your MAGI is under $100k (phasing out to $0 by $150k); unused losses carry forward. On sale, claimed depreciation is recaptured at up to 25%, and gains may owe capital-gains tax (a 1031 exchange can defer both). Figures are a year-1 estimate at your 24.0% rate — not tax advice; consult a CPA.
Schools (NCES district)
- District
- Madison County
- NCES district ID
- 2103720
- Math proficiency
- 31% ▼ -16.00%
- Reading proficiency
- 47% ▼ -14.00%
- Median HH income
- $43,590
- Composite
- 32.99/100
- National rank
- #5580
- State rank
- #35 of 165 in KY
Livability — Richmond
- Score
- 69/100
- State rank
- #163
- US rank
- #8196
Category grades
Schools grade is shown separately in the Schools card above.
Census & demographics
- County
- Madison County · 93,568 people
- City population
- 65,961
- Metro
- Richmond-Berea, KY
- Population (ZIP)
- 65,961
- Household income
- $63,050
- Rent vs Own
- Severe rent burden
- 2031.0
Population outlook (Madison County) Hauer SSP2
- Today (2025)
- 99,241 people
- By 2030
- 104,927 · +5.7%
- By 2040
- 116,079 · +17.0%
- By 2050
- 127,293 · +28.3%
- By 2075
- 155,644 · +56.8%
- By 2100
- 176,488 · +77.8%
Race, ethnicity, and origin ACS 2023
- Neighborhood character
- Predominantly White (87%)
- Race & ethnicity
- White 87% Two or more races 5% Black 4% Hispanic / Latino 3%
- Common ancestry
- Slovak 2% Italian 2% Serbian 1%
- Foreign-born
- 3% · Canada
- Languages at home
- 96% English-only · Spanish 3%
Political lean MEDSL · Madison
- 2024 margin
- Solid R (+30.9) · D 33.6% · R 64.5% · Other 1.9%
- 2008→2024 swing
- -8.4pp toward R · 2008: -22.4pp · 2024: -30.9pp
- All cycles
- 2024: R+30.9 2020: R+26.8 2016: R+31.2 2012: R+28.9 2008: R+22.4
Not yet ingested
- Civics
- —
Market trends
- HPI YoY
- ▼ -72.04%
- Current HPI
- 245.8489
- Rent YoY
- ▲ 2.82%
- Metro
- Richmond-Berea, KY
- State GDP YoY
- ▲ 1.81%
- F500 in state
- 4
Industry mix (Fortune 500 HQ in KY)
| Industry | F500 HQs | Revenue |
|---|---|---|
| Healthcare | 1 | $118B |
|
||
| Food / Beverage | 1 | $7B |
|
||
Price history
+100.0% since first listed41 events — show timeline
- 2026-04-30 Listing Removed — ImagineMLS
- 2026-04-30 Listed $199,000 ImagineMLS
- 2026-01-23 Listed $199,000 ImagineMLS
- 2025-12-07 Listing Removed — ImagineMLS
- 2025-09-03 Price Changed $199,000 ImagineMLS
- 2025-07-14 Price Changed $205,000 ImagineMLS
- 2025-06-20 Listed $210,000 ImagineMLS
- 2024-08-09 Sold (Public Records) $190,000 Public Records
- 2024-07-19 Sold (MLS) $190,000 ImagineMLS
- 2024-06-14 Pending — ImagineMLS
- 2024-06-13 Price Changed $192,500 ImagineMLS
- 2024-06-06 Listing Removed — ImagineMLS
- 2024-06-06 Listed $194,900 ImagineMLS
- 2024-06-04 Price Changed $194,900 ImagineMLS
- 2024-05-28 Price Changed $199,900 ImagineMLS
- 2024-05-23 Price Changed $209,900 ImagineMLS
- 2024-05-12 Listed $214,900 ImagineMLS
- 2021-01-20 Sold (Public Records) $135,000 Public Records
- 2021-01-08 Sold (MLS) $135,000 ImagineMLS
- 2020-12-23 Pending — ImagineMLS
- 2020-12-21 Price Changed $137,500 ImagineMLS
- 2020-12-21 Relisted — ImagineMLS
- 2020-12-07 Listing Removed — ImagineMLS
- 2020-12-04 Contingent — ImagineMLS
- 2020-12-03 Relisted — ImagineMLS
- 2020-11-23 Pending — ImagineMLS
- 2020-11-22 Price Changed $139,500 ImagineMLS
- 2020-11-06 Listed $142,500 ImagineMLS
- 2020-05-14 Sold (MLS) $50,000 ImagineMLS
- 2020-04-10 Pending — ImagineMLS
- 2020-04-08 Relisted — ImagineMLS
- 2020-03-10 Pending — ImagineMLS
- 2020-02-28 Listed $48,000 ImagineMLS
- 2015-02-03 Sold (Public Records) $82,000 Public Records
- 2015-01-29 Sold (MLS) $82,000 ImagineMLS
- 2014-12-29 Listing Removed — ImagineMLS
- 2014-09-19 Listed $89,000 ImagineMLS
- 2011-02-19 Listing Removed — ImagineMLS
- 2010-08-19 Listed $92,000 ImagineMLS
- 2008-11-24 Listing Removed — ImagineMLS
- 2007-10-15 Listed $99,500 ImagineMLS
Property tax history
+8.2%/yrLatest (2025): $1,792 · +38.5% YoY. Source: county tax records.
Cash-flow waterfall
monthlySold comps — $/sqft
last 12 mo · ≤1 miLoading sold comps…