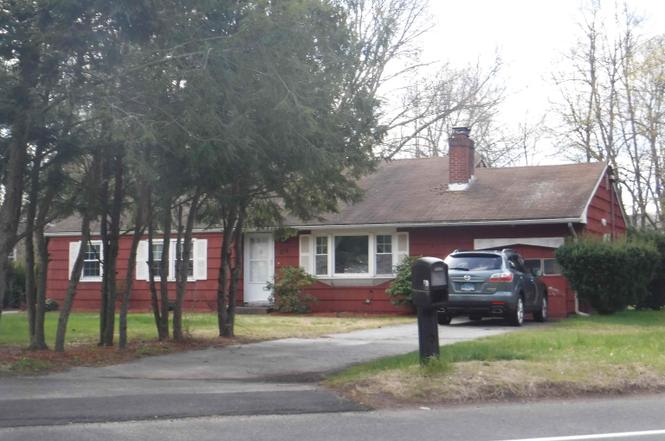
779 Ellington Rd · South Windsor, CT
Flood risk 1/10 · Minimal
- FEMA flood zone
- X (unshaded)
- Chance of flooding over 30 yrs
- 0.0%
- Est. flood insurance / yr
- $473 – $860
Fire risk 1/10 · Minimal
- Est. fire insurance / yr
- $829 – $1,539
Heat risk 5/10 · Moderate
- Hot days now (above 97°F)
- 7 days/yr
- Hot days in 30 yrs
- 16 days/yr
Wind risk 6/10 · Moderate
- Chance of severe wind over 30 yrs
- 27.0%
Air-quality risk 3/10 · Minor
- Unhealthy air days now
- 3 days/yr
- Unhealthy air days in 30 yrs
- 4 days/yr
Risk factors via First Street. Map © Google.
Why this score? — see what drove the B- grade
The composite is a weighted blend of 9 inputs, each scored 0–100. Each bar is that input's sub-score; the figure is the points it added to the 100-point composite (weight × sub-score).
- Cash flow +23.7/30.0
- ARV discount +15.0/15.0
- DSCR +7.6/10.0
- 1% rule +7.5/10.0
- Schools +5.9/10.0
- Rent growth +3.2/5.0
- Livability +2.5/5.0
- Condition / age +2.5/5.0
- Appreciation +0.0/10.0
$224,925
🖨 Deal sheet 📄 Offer letter ✓ Due diligence
Listing remarks MLS
Jacuzzi not in working order. Possible 4th bedroom or office in lower level. Private yard with lots of safe space to play! Wood stove in lower level family room,fire place in living room.
Key facts
- Flexible space
- Corner lot
- 0.49 acre lot
Tags
Neighborhood map
What this means for you Summary
Snapshot
- This is a 4-bed/1.5-bath single-family listed at $225k.
Deal economics
- At list price, monthly cash flow is $429 ($5k/yr) — positive.
- The deal already cash-flows at list — no discount required.
- Meets the 1% rule at list price ($3k rent vs $225k).
Location & tenants
- Location reads: area grade B — affects rentability + tenant quality, not the cash-flow math above.
- South Windsor School District (suburban): math 60% / reading 69% proficiency, ranked #27 of 153 in CT (top 18%) — acceptable for families but not a draw, mixed tenant base, ~2y average lease; only 9% free/reduced lunch — higher-income household profile.
- Market conditions: Rents rising (+2.8%/yr); 118 active listings in the ZIP; high-income renter base; 1,867 units permitted in Capitol Planning Region in 2024 (1,399 in 5+ unit buildings).
Forward outlook
- Local home prices are declining (-3.0%/yr); year-one equity from $2k of loan paydown is wiped out by about $7k of value loss. Plan a longer hold.
Negotiation context
- Only 11 days on market — expect competitive offers; lowballing is unlikely to land.
- 3 sale attempts since 25y ago with the ask held roughly flat each time — persistent listings suggest the price (not the market) is what's stuck; bring a comps-based counter.
- Current owner paid $147k; list at $225k implies a 53% gain — meaningful room to come down on a strong offer.
Risks & watch-outs
- Watch-outs: property tax is 2.7% of price.
- Climate carrying-cost: major wind risk, 27% chance of damaging wind over 30y; extreme-heat days projected 7→16/yr by 2055 (HVAC capex compounding) — expect insurance premiums to compound above CPI over the hold.
Questions for the listing agent
- Built in 1960 — when were the roof, HVAC, electrical panel, plumbing, and water heater last replaced?
- Property tax is high relative to price — has the assessment been appealed recently, and will the sale trigger a re-assessment?
- Is there a deadline driving the sale (1031 exchange, divorce, estate, relocation)? That informs how much negotiation room exists.
- What's the average days-on-market for RENTAL listings here right now (not sales)? A rising rental-DOM trend means longer vacancies and softer asking-rent achievability than the comps imply.
- What's the recent tenant-quality profile in this submarket — average credit score on applications, eviction rate, late-payment / NSF rate, and stable-employment percentage? A property-management company in the area should have these aggregated.
- How much new for-sale + rental construction is in the pipeline within 1–3 miles? Heavy new supply typically softens prices + rents 12–24 months out; constrained supply supports both.
Investment metrics
- 1% rule
- 1.25% ✓
- Cap rate
- 8.58%
- Cash-on-cash
- 8.18%
- DSCR
- 1.36
- GRM
- 6.7
CMA / ARV
- ARV (on-the-fly)
- $368,714
- Comps found
- 12
Show comp detail 12 sales within ~0.75 mi
| Address | Dist | Beds/Ba | Sqft | Sold | Price | $/sf | Match |
|---|---|---|---|---|---|---|---|
| 779 Ellington Rd | 0.00mi | 4/1.5 | 1,178 (0%) | 1mo | $250,000 | $212 | 99 |
| 72 Northview Dr | 0.15mi | 3/2.0 (-1) | 1,036 (-12%) | 3mo | $355,000 | $343 | 64 |
| 598 Pleasant Valley Rd | 0.31mi | 3/1.0 (-1) | 1,090 (-8%) | 5mo | $295,000 | $271 | 62 |
| 38 Tudor Hill Rd | 0.22mi | 3/2.0 (-1) | 1,340 (+14%) | 1mo | $415,000 | $310 | 58 |
| 148 Quarry Brook Dr | 0.29mi | 3/1.5 (-1) | 1,264 (+7%) | 14mo | $405,000 | $320 | 58 |
| 79 Judy Ln | 0.59mi | 3/2.0 (-1) | 1,152 (-2%) | 7mo | $360,000 | $313 | 56 |
| 50 Parkview Dr | 0.35mi | 3/1.0 (-1) | 1,284 (+9%) | 8mo | $379,000 | $295 | 55 |
| 63 Marilyn Rd | 0.66mi | 3/2.0 (-1) | 1,200 (+2%) | 9mo | $360,000 | $300 | 52 |
| 171 Hilton Dr | 0.37mi | 3/1.0 (-1) | 1,008 (-14%) | 10mo | $358,000 | $355 | 44 |
| 192 Hilton Dr | 0.35mi | 3/1.0 (-1) | 1,008 (-14%) | 12mo | $330,000 | $327 | 43 |
| 53 Parkview Dr | 0.38mi | 3/2.0 (-1) | 1,306 (+11%) | 22mo | $371,000 | $284 | 39 |
| 516 Chapel Rd | 0.68mi | 3/1.5 (-1) | 1,240 (+5%) | 20mo | $404,000 | $326 | 38 |
Match score weights: distance 35% · size 25% · config 20% · recency 20%. Top-matched comps best support the ARV.
Projected returns pro-forma
-3.0% appreciation · 2.75% rent growth · sell at horizon
- IRR
- -4.1%
- Equity multiple
- 0.85×
- Total profit
- $-9,629
- Equity at exit
- $33,537
- IRR
- 5.4%
- Equity multiple
- 1.39×
- Total profit
- $24,692
- Equity at exit
- $19,447
Cash invested: $62,979 (down + closing). Projections, not guarantees.
Landlord ↔ Tenant lean methodology
- Overall (STATE)
- 27 Tenant-Leaning
- State Connecticut
- 27 Tenant-Leaning · D+7
- County
- — inherits STATE
- City
- — inherits STATE
ZIP-level market 06074
- Rents YoY
- 2.8%
- Active inventory
- 118
- Price-to-rent
- 6.7×
Monthly cashflow live
- Estimated rent
- $2,801 medium interval (Pro) →
- Mortgage (P&I)
- −$1,180
- Tax from tax record
- −$510 /mo · $6,125/yr
- Insurance
- −$94
- HOA
- −$0
- Vacancy / Maint / Mgmt
- −$588
- Net cashflow
- $429
Break-even live
UW: 25.0% down · 7.5% · 30yr · 1.5% tax · 5.0% vac · 8.0% maint · 8.0% mgmt
Financing live
Cash to close
- Down payment
- $56,231
- Closing costs
- $6,748
- Reserves months
- —
- Total cash needed
- —
Loan-product check · same deal, 3 products live
Conventional
25% down · 7.5% · 30yr
- Down + closing
- —
- Monthly P&I
- —
- Monthly cashflow
- —
- DSCR
- —
- Eligible?
- —
Personal DTI + credit; lowest rate.
DSCR
20% down · 8.5% · 30yr
- Down + closing
- —
- Monthly P&I
- —
- Monthly cashflow
- —
- DSCR
- —
- Eligible?
- —
No personal income docs; deal must DSCR.
Hard money
10% down · 12.0% · 12mo
- Down + closing
- —
- Monthly P&I
- —
- Monthly cashflow
- —
- DSCR
- —
- Eligible?
- —
Short-term bridge; refi at stabilization.
Listing history 8 events
-
2026-03-07status Under Contract
-
2026-03-02status Active
-
2026-02-10status Under Contract
-
2026-02-04$224,925 Active
-
2001-07-02soldstatus $147,000
-
2001-06-29soldstatus $147,000 187-char remark
Show marketing remark (187 chars)
Jacuzzi not in working order. Possible 4th bedroom or office in lower level. Private yard with lots of safe space to play! Wood stove in lower level family room,fire place in living room.
-
2001-03-10$146,900 187-char remark
Show marketing remark (187 chars)
Jacuzzi not in working order. Possible 4th bedroom or office in lower level. Private yard with lots of safe space to play! Wood stove in lower level family room,fire place in living room.
-
1994-11-30soldstatus $128,000
ⓘ Source: listings_history table (triggers on properties + properties_extension) + one-shot
backfill from property_details.listing_events for pre-trigger history.
Tax reassessment forecast CT · Partial reset (capped growth)
- Current annual tax
- $6,125 · $510/mo
- Projected year-2 tax
- $6,125 · $510/mo
- Expected delta
- $0/yr ($0/mo · 0.0%)
ⓘ Screening estimate from a state-policy table — verify with the county assessor before closing.
Climate risk First Street
- Flood 1/10 Low FEMA zone X (unshaded) · 0% chance over 30 yrs
- Wildfire 1/10 Low
- Heat 5/10 Major 7 d/yr ≥97°F today · 16 d/yr by 30 yrs out
- Wind 6/10 Major 27% chance of damaging wind over 30 yrs
- Air quality 3/10 Moderate 3 unhealthy d/yr today · 4 by 30 yrs out
Nearby sold comps map
Loading sold comps map…
Walkable amenities ~0.75 mi
Loading nearby amenities…
Taxation est. · year 1
- Rental income
- $33,614
- − Mortgage interest
- −$12,599
- − Property taxes
- −$6,125
- − Insurance
- −$1,125
- − Repairs & maintenance
- −$2,689
- − Management
- −$2,689
- − Depreciation
- −$6,543
- Taxable income
- $1,843
- Est. tax owed @ 24.0%
- −$442
- After-tax cash flow
- $4,708/yr
For passive investors: Depreciation is non-cash, so a rental often shows a tax loss while cash-flowing — sheltering income. Rental losses are passive: they offset passive income freely, and up to $25,000/yr can offset ordinary (W-2) income if you actively participate and your MAGI is under $100k (phasing out to $0 by $150k); unused losses carry forward. On sale, claimed depreciation is recaptured at up to 25%, and gains may owe capital-gains tax (a 1031 exchange can defer both). Figures are a year-1 estimate at your 24.0% rate — not tax advice; consult a CPA.
Schools (NCES district)
- District
- South Windsor School District
- NCES district ID
- 0904170
- Math proficiency
- 60% ▼ -9.00%
- Reading proficiency
- 69% ▼ -6.00%
- Median HH income
- $93,730
- Composite
- 58.96/100
- National rank
- #965
- State rank
- #27 of 153 in CT
Livability — South Windsor
No livability data for this city. (Only ~50 U.S. cities are tracked.)
Census & demographics
- County
- Hartford County · 754,208 people
- City population
- 26,907
- Metro
- Hartford-East Hartford-Middletown, CT
- Population (ZIP)
- 26,907
- Household income
- $144,961
- Rent vs Own
- Severe rent burden
- 288.0
Population outlook (Capitol County) Hauer SSP2
- By 2040
- 1,063,519
Race, ethnicity, and origin ACS 2023
- Neighborhood character
- Majority White (64%)
- Race & ethnicity
- White 64% Asian 21% Two or more races 6% Hispanic / Latino 6% Black 4%
- Hispanic origin (detail)
- Puerto Rican 3%
- Common ancestry
- Romanian 7% Lithuanian 4% Russian 2%
- Foreign-born
- 21% · Canada, China
- Languages at home
- 74% English-only · Other Indo-European 13% Other Asian/Pacific 6% Spanish 3%
Political lean MEDSL · Capitol
- 2024 margin
- Strong D (+21.9) · D 60.1% · R 38.2% · Other 1.7%
- All cycles
- 2024: D+21.9
Not yet ingested
- Civics
- —
Market trends
- HPI YoY
- ▼ -180.94%
- Current HPI
- 193.4197
- Rent YoY
- ▲ 2.75%
- Metro
- Hartford-East Hartford-Middletown, CT
- State GDP YoY
- ▲ 1.06%
- F500 in state
- 38
Industry mix (Fortune 500 HQ in CT)
| Industry | F500 HQs | Revenue |
|---|---|---|
| Industrial Machinery | 4 | $38B |
|
||
| Insurance | 3 | $71B |
|
||
| Financial Services | 2 | $25B |
|
||
| Transportation / Logistics | 2 | $18B |
|
||
| Healthcare | 1 | $247B |
|
||
| Telecommunications | 1 | $55B |
|
||
Price history
+75.7% since first listed8 events — show timeline
- 2026-03-07 Pending — Smart MLS
- 2026-03-02 Relisted — Smart MLS
- 2026-02-10 Pending — Smart MLS
- 2026-02-04 Listed $224,925 Smart MLS
- 2001-07-02 Sold (Public Records) $147,000 Public Records
- 2001-06-29 Sold (MLS) $147,000 Smart MLS
- 2001-03-10 Listed $146,900 Smart MLS
- 1994-11-30 Sold (Public Records) $128,000 Public Records
Property tax history
+2.5%/yrLatest (2025): $6,125 · +3.3% YoY. Source: county tax records.
Cash-flow waterfall
monthlySold comps — $/sqft
last 12 mo · ≤1 miLoading sold comps…