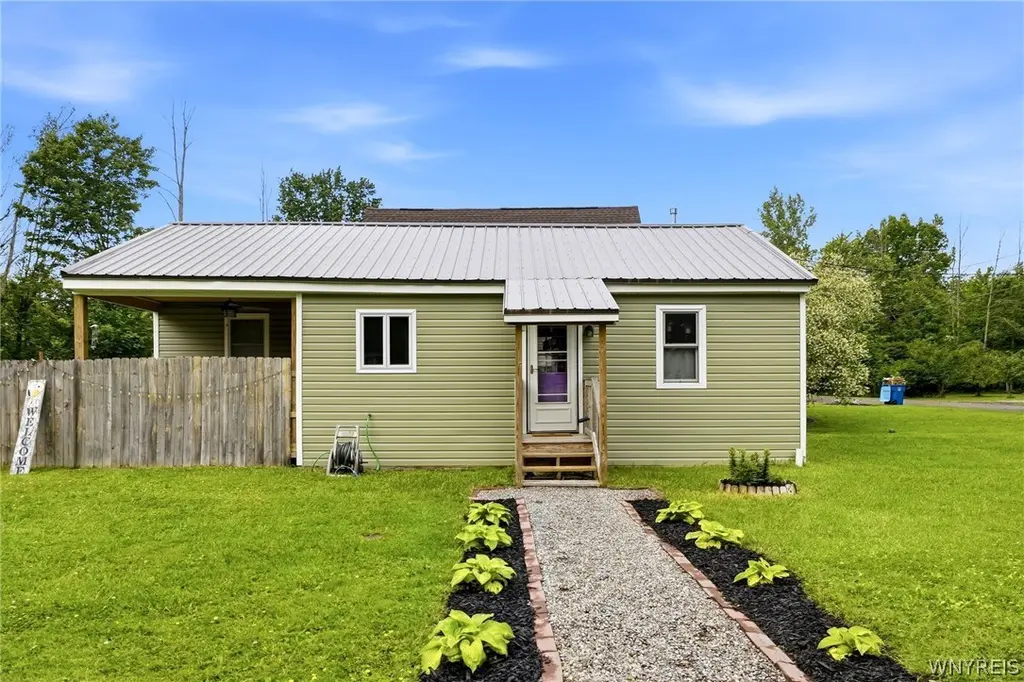
9686 Lenox St · Lake Erie Beach, NY
Flood risk 1/10 · Minimal
- FEMA flood zone
- X (unshaded)
- Chance of flooding over 30 yrs
- 0.0%
- Est. flood insurance / yr
- $507 – $1,088
Fire risk 2/10 · Minimal
- Est. fire insurance / yr
- $691 – $1,283
Heat risk 2/10 · Minimal
- Hot days now (above 92°F)
- 7 days/yr
- Hot days in 30 yrs
- 16 days/yr
Wind risk 1/10 · Minimal
- Chance of severe wind over 30 yrs
- —
Air-quality risk 2/10 · Minimal
- Unhealthy air days now
- 2 days/yr
- Unhealthy air days in 30 yrs
- 2 days/yr
Risk factors via First Street. Map © Google.
Why this score? — see what drove the D- grade
The composite is a weighted blend of 9 inputs, each scored 0–100. Each bar is that input's sub-score; the figure is the points it added to the 100-point composite (weight × sub-score).
- Cash flow +13.7/30.0
- DSCR +4.1/10.0
- Schools +4.1/10.0
- 1% rule +4.0/10.0
- Livability +3.1/5.0
- ARV discount +2.7/15.0
- Rent growth +2.5/5.0
- Condition / age +2.5/5.0
- Appreciation +0.0/10.0
$138,500
🖨 Deal sheet 📄 Offer letter ✓ Due diligence
Listing remarks MLS
Welcome Home to 9686 Lenox. This move in ready and maintenance free Ranch in Angola is a fantastic and affordable opportunity in this dynamic market! The efficient and functional floor plan has so much offer. Relax and unwind in the inviting living room that flows into the kitchen with generous cabinet storage. A utility room with laundry set up and large shed offer even more functionality! Two bedrooms and a renovated full bath complete the main level. Spend warm summer nights relaxing in the great outdoors around the fire pit. Several capital improvements include a brand new furnace installed in April 2023, vinyl windows and siding and an architectural roof to name a few. Only minutes from the beach and close to many local conveniences. Square footage verified through past sale. Showings begin immediately!
Key facts
- Brand-new fence
- Newer furnace
- Sliding glass door
Tags
Property features AI
Exterior
- Parking: No garage
- Utilities: Public water connected; Sewer connected
- Home design: Single-story home; Existing (previously built)
- Construction: Frame and stone construction; Architectural shingle roof; Block and slab foundation; Built previously (existing)
- Exterior features: Gravel driveway; Corner lot; Greenbelt; Irregular lot; Lake frontage
Interior
- Kitchen: Appliances negotiable; Gas water heater
- Bedrooms: 2 main-level bedrooms; Guest quarters
- Flooring: Laminate; Vinyl; Varies
- Bathrooms: 1 full bathroom (main level)
- Heating & cooling: Ductless heating (gas); Ductless cooling
- Interior features: Cedar closets; Guest accommodations; Living/dining room; Partially furnished; See remarks
- Laundry & utility: No specific laundry details provided
Neighborhood map
What this means for you Summary
Snapshot
- This is a 2-bed/1.0-bath single-family listed at $138k.
Deal economics
- At list price, monthly cash flow is $11 ($130/yr) — positive.
- The deal already cash-flows at list — no discount required.
- To meet the 1% rule (rent ≥ 1% of price), the offer needs to be $124k (10.2% below list).
- Recommended offer: $124k (10.2% below list) — sets the bar for 1% rule.
- Cap rate 6.4% vs local median 2.8% in Lake Erie Beach — top-decile yield for the area; either an underpriced asset or a hidden risk that comps aren't pricing in. Stress-test before assuming the spread holds.
Location & tenants
- Location reads 62/100 on livability (#836 in NY) — a middle-class / working-renter tenant base. Strengths: cost of living A+, housing A+, crime B; Watch: schools D-, amenities F, commute F.
- Evans-Brant Central School District (Lake Shore) (suburban): math 43% / reading 51% proficiency, ranked #424 of 590 in NY (top 72%) — families likely to look elsewhere, expect single-tenant / working-renter base with shorter leases.
- Market conditions: 100 active listings in the ZIP; 1,244 units permitted in Erie County in 2024 (563 in 5+ unit buildings).
Forward outlook
- Local home prices are declining (-3.0%/yr); year-one equity from $958 of loan paydown is wiped out by about $4k of value loss. Plan a longer hold.
Negotiation context
- Only 8 days on market — expect competitive offers; lowballing is unlikely to land.
- 2 sale attempts since 3y ago with the ask held roughly flat each time — persistent listings suggest the price (not the market) is what's stuck; bring a comps-based counter.
- Current owner paid $115k; 20% above their basis — modest negotiation headroom, anchor on the comps not their cost.
Risks & watch-outs
- Watch-outs: built in 1926 — expect roof / HVAC / electrical / plumbing capex.
Questions for the listing agent
- Built in 1926 — when were the roof, HVAC, electrical panel, plumbing, and water heater last replaced?
- Is there a deadline driving the sale (1031 exchange, divorce, estate, relocation)? That informs how much negotiation room exists.
- Schools are D-rated, which usually means shorter tenancies and higher turnover. Who's the typical renter profile here, and what's been the actual vacancy rate?
- The area grade is low — what's the realistic commute time and amenity access for the typical tenant pool here? Any planned neighborhood developments (good or bad) we should know about?
- What's the average days-on-market for RENTAL listings here right now (not sales)? A rising rental-DOM trend means longer vacancies and softer asking-rent achievability than the comps imply.
- What's the recent tenant-quality profile in this submarket — average credit score on applications, eviction rate, late-payment / NSF rate, and stable-employment percentage? A property-management company in the area should have these aggregated.
- How much new for-sale + rental construction is in the pipeline within 1–3 miles? Heavy new supply typically softens prices + rents 12–24 months out; constrained supply supports both.
Investment metrics
- 1% rule
- 0.90% ✗
- Cap rate
- 6.39%
- Cash-on-cash
- 0.34%
- DSCR
- 1.01
- GRM
- 9.3
CMA / ARV
- ARV (on-the-fly)
- $125,172
- Comps found
- 6
Show comp detail 6 sales within ~0.75 mi
| Address | Dist | Beds/Ba | Sqft | Sold | Price | $/sf | Match |
|---|---|---|---|---|---|---|---|
| 404 E Pleasant Ave | 0.13mi | 1/1.0 (-1) | 693 (+1%) | 17mo | $75,900 | $110 | 72 |
| 359 E Pleasant Ave | 0.14mi | 2/2.0 | 770 (+13%) | 10mo | $212,100 | $275 | 61 |
| 449 Madison Ave | 0.41mi | 2/1.0 | 734 (+7%) | 10mo | $65,000 | $89 | 60 |
| 9578 Maplewood St | 0.24mi | 2/1.0 | 600 (-12%) | 13mo | $205,000 | $342 | 58 |
| 464 Poplar Ave | 0.62mi | 2/1.0 | 600 (-12%) | 9mo | $109,900 | $183 | 43 |
| 195 Humboldt Ave | 0.66mi | 1/1.0 (-1) | 600 (-12%) | 10mo | $50,000 | $83 | 36 |
Match score weights: distance 35% · size 25% · config 20% · recency 20%. Top-matched comps best support the ARV.
Projected returns pro-forma
-3.0% appreciation · 3.0% rent growth · sell at horizon
- IRR
- -15.7%
- Equity multiple
- 0.44×
- Total profit
- $-21,726
- Equity at exit
- $20,651
- IRR
- -7.3%
- Equity multiple
- 0.54×
- Total profit
- $-17,918
- Equity at exit
- $11,975
Cash invested: $38,780 (down + closing). Projections, not guarantees.
Landlord ↔ Tenant lean methodology
- Overall (STATE)
- 15 Strongly Tenant-Friendly
- State New York
- 15 Strongly Tenant-Friendly · D+10
- County
- — inherits STATE
- City
- — inherits STATE
ZIP-level market 14006
- Home prices YoY
- -16.8%
- Active inventory
- 100
- Price-to-rent
- 9.3×
Monthly cashflow live
- Estimated rent
- $1,244 medium interval (Pro) →
- Mortgage (P&I)
- −$726
- Tax from tax record
- −$188 /mo · $2,251/yr
- Insurance
- −$58
- HOA
- −$0
- Vacancy / Maint / Mgmt
- −$261
- Net cashflow
- $11
Break-even live
UW: 25.0% down · 7.5% · 30yr · 1.5% tax · 5.0% vac · 8.0% maint · 8.0% mgmt
Financing live
Cash to close
- Down payment
- $34,625
- Closing costs
- $4,155
- Reserves months
- —
- Total cash needed
- —
Loan-product check · same deal, 3 products live
Conventional
25% down · 7.5% · 30yr
- Down + closing
- —
- Monthly P&I
- —
- Monthly cashflow
- —
- DSCR
- —
- Eligible?
- —
Personal DTI + credit; lowest rate.
DSCR
20% down · 8.5% · 30yr
- Down + closing
- —
- Monthly P&I
- —
- Monthly cashflow
- —
- DSCR
- —
- Eligible?
- —
No personal income docs; deal must DSCR.
Hard money
10% down · 12.0% · 12mo
- Down + closing
- —
- Monthly P&I
- —
- Monthly cashflow
- —
- DSCR
- —
- Eligible?
- —
Short-term bridge; refi at stabilization.
Listing history 7 events
-
2026-06-18days on market $138,500 Active 8 DOM
-
2026-06-17days on market $138,500 Active 7 DOM
-
2026-06-16days on market $138,500 Active 6 DOM
-
2026-06-15days on market $138,500 Active 5 DOM
-
2026-06-13days on market $138,500 Active 3 DOM
-
2026-06-12remarks 667-char remark
-
2026-06-12$138,500 Active 2 DOM
ⓘ Source: listings_history table (triggers on properties + properties_extension) + one-shot
backfill from property_details.listing_events for pre-trigger history.
Tax reassessment forecast NY · Partial reset (capped growth)
- Current annual tax
- $2,251 · $188/mo
- Projected year-2 tax
- $2,296 · $191/mo
- Expected delta
- +$45/yr (+$4/mo · 2.0%)
ⓘ Screening estimate from a state-policy table — verify with the county assessor before closing.
Climate risk First Street
- Flood 1/10 Low FEMA zone X (unshaded) · 0% chance over 30 yrs
- Wildfire 2/10 Low
- Heat 2/10 Low 7 d/yr ≥92°F today · 16 d/yr by 30 yrs out
- Wind 1/10 Low
- Air quality 2/10 Low 2 unhealthy d/yr today · 2 by 30 yrs out
Nearby sold comps map
Loading sold comps map…
Walkable amenities ~0.75 mi
Loading nearby amenities…
Taxation est. · year 1
- Rental income
- $14,923
- − Mortgage interest
- −$7,758
- − Property taxes
- −$2,251
- − Insurance
- −$692
- − Repairs & maintenance
- −$1,194
- − Management
- −$1,194
- − Depreciation
- −$4,029
- Taxable loss
- −$2,195
- Est. tax savings @ 24.0%
- +$527
- After-tax cash flow
- $657/yr
For passive investors: Depreciation is non-cash, so a rental often shows a tax loss while cash-flowing — sheltering income. Rental losses are passive: they offset passive income freely, and up to $25,000/yr can offset ordinary (W-2) income if you actively participate and your MAGI is under $100k (phasing out to $0 by $150k); unused losses carry forward. On sale, claimed depreciation is recaptured at up to 25%, and gains may owe capital-gains tax (a 1031 exchange can defer both). Figures are a year-1 estimate at your 24.0% rate — not tax advice; consult a CPA.
Schools (NCES district)
- District
- Evans-Brant Central School District (Lake Shore)
- NCES district ID
- 3616560
- Math proficiency
- 43% ▼ -9.00%
- Reading proficiency
- 51% ▲ 6.00%
- Median HH income
- $56,433
- Composite
- 40.89/100
- National rank
- #3619
- State rank
- #424 of 590 in NY
Livability — Lake Erie Beach
- Score
- 62/100
- State rank
- #836
- US rank
- #16262
Category grades
Schools grade is shown separately in the Schools card above.
Census & demographics
- Census place
- Lake Erie Beach, NY
- Population (ZIP)
- 9,354
Population outlook (Erie County) Hauer SSP2
- Today (2025)
- 933,037 people
- By 2030
- 935,181 · +0.2%
- By 2040
- 928,531 · -0.5%
- By 2050
- 905,725 · -2.9%
- By 2075
- 834,037 · -10.6%
- By 2100
- 708,033 · -24.1%
Race, ethnicity, and origin ACS 2023
- Neighborhood character
- Predominantly White (92%)
- Race & ethnicity
- White 92% Two or more races 3% Black 2% Asian 1% Hispanic / Latino 1%
- Common ancestry
- Romanian 16% Italian 4% Lithuanian 2%
- Foreign-born
- 3% · Canada, China
- Languages at home
- 96% English-only · French/Haitian/Cajun 1% Spanish 1% Other Asian/Pacific 1%
Political lean MEDSL · Erie
- 2024 margin
- Lean D (+9.7) · D 54.8% · R 45.2%
- 2008→2024 swing
- -7.9pp toward R · 2008: 17.5pp · 2024: 9.7pp
- All cycles
- 2024: D+9.7 2020: D+14.7 2016: D+4.8 2012: D+15.6 2008: D+17.5
Not yet ingested
- Civics
- —
Market trends
- HPI YoY
- ▼ -80.95%
- Current HPI
- 401.7461
- Rent YoY
- —
- Metro
- —
- State GDP YoY
- ▲ 2.60%
- F500 in state
- 92
Industry mix (Fortune 500 HQ in NY)
| Industry | F500 HQs | Revenue |
|---|---|---|
| Financial Services | 10 | $950B |
|
||
| Consumer Goods | 9 | $162B |
|
||
| Insurance | 4 | $225B |
|
||
| Telecommunications | 2 | $144B |
|
||
| Pharmaceuticals | 2 | $112B |
|
||
| Media / Entertainment | 2 | $69B |
|
||
Price history
+246.2% since first listed8 events — show timeline
- 2026-06-10 Listed $138,500 WNYREIS
- 2023-07-05 Sold (Public Records) $115,000 Public Records
- 2023-06-30 Sold (MLS) $115,000 WNYREIS
- 2023-05-11 Pending — WNYREIS
- 2023-05-08 Pending — WNYREIS
- 2023-05-01 Listed $109,900 WNYREIS
- 2018-10-17 Sold (Public Records) $42,000 Public Records
- 2005-01-28 Sold (Public Records) $40,000 Public Records
Property tax history
+4.8%/yrLatest (2025): $2,251 · +2.5% YoY. Source: county tax records.
Cash-flow waterfall
monthlySold comps — $/sqft
last 12 mo · ≤1 miLoading sold comps…