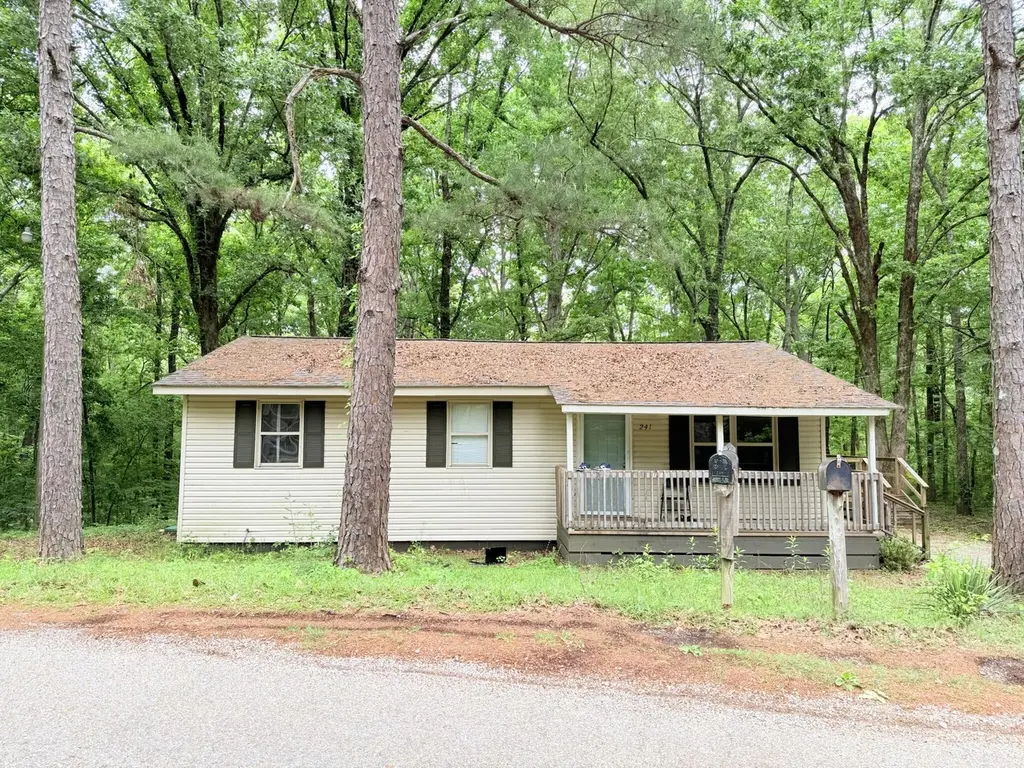
241 Piomingo Trl · Tupelo, MS
Flood risk 1/10 · Minimal
- FEMA flood zone
- X (unshaded)
- Chance of flooding over 30 yrs
- 0.0%
- Est. flood insurance / yr
- $507 – $1,088
Fire risk 4/10 · Minor
- Est. fire insurance / yr
- $1,241 – $2,305
Heat risk 6/10 · Moderate
- Hot days now (above 108°F)
- 7 days/yr
- Hot days in 30 yrs
- 20 days/yr
Wind risk 6/10 · Moderate
- Chance of severe wind over 30 yrs
- 27.0%
Air-quality risk 1/10 · Minimal
- Unhealthy air days now
- 0 days/yr
- Unhealthy air days in 30 yrs
- 0 days/yr
Risk factors via First Street. Map © Google.
Why this score? — see what drove the C+ grade
The composite is a weighted blend of 9 inputs, each scored 0–100. Each bar is that input's sub-score; the figure is the points it added to the 100-point composite (weight × sub-score).
- Cash flow +26.0/30.0
- ARV discount +11.6/15.0
- DSCR +8.7/10.0
- 1% rule +6.9/10.0
- Livability +3.6/5.0
- Schools +3.0/10.0
- Rent growth +2.5/5.0
- Condition / age +2.5/5.0
- Appreciation +0.0/10.0
$129,900
🖨 Deal sheet (PDF) 📄 Offer letter ✓ Due diligence
Listing remarks MLS
Completely RENOVATED in Lake Piomingo! Brand new everything - new cabinets, new flooring, new paint! Roof is 2 years old. BRAND NEW SEPTIC TANK - installed summer 2023! Mooreville School District. Schedule an appointment to see this one before it's gone! All information deemed reliable but subject to verification.
Key facts
- 2 living areas
- 24hr security
- 0.35 acre lot
Tags
Property features AI
Finance
- Other: Located in the Lake Piomingo subdivision
- HOA & community: Homeowners association with an annual fee of $240 (about $20/month)
Exterior
- Home design: Single-family residential property
- Construction: Asphalt roof
- Exterior features: Storm door(s); Lot approximately 0.35 acres (80 x 192.4 irregular)
Interior
- Kitchen: Range; Dishwasher; Refrigerator
- Bathrooms: 1 full bathroom
- Heating & cooling: Electric central heating
- Interior features: Range, Dishwasher, Refrigerator; Crawl space basement
Neighborhood map
What this means for you Summary
Snapshot
- This is a 4-bed/1.0-bath single-family listed at $130k.
Deal economics
- At list price, monthly cash flow is $322 ($4k/yr) — positive.
- The deal already cash-flows at list — no discount required.
- Meets the 1% rule at list price ($2k rent vs $130k).
- Recommended offer: $126k (3.0% below list) — sets the bar for market timing.
Location & tenants
- Location reads 72/100 on livability (#26 in MS) — a middle-class / working-renter tenant base. Strengths: cost of living A+, housing A+, health & safety A-; Watch: amenities D+, employment D+, crime F.
- Lee County School District (rural): math 37% / reading 35% proficiency, ranked #51 of 130 in MS (top 39%) — families likely to look elsewhere, expect single-tenant / working-renter base with shorter leases.
- Zoned schools: Mooreville Elementary School (math 48% / reading 52%, grade D+, #61 of 375 statewide, top 17%, 673 students, 100% FRL); Mooreville Middle School (math 61% / reading 36%, grade C-, #33 of 179 statewide, top 18%, 372 students, 99% FRL); Mooreville High School (math 42% / reading 37%, grade F, #52 of 197 statewide, top 27%, 469 students, 99% FRL) — zoned schools average 99% FRL vs 54% district-wide (45 pts higher); higher-poverty schools than district average — tighter screening recommended.
- Market conditions: 173 active listings in the ZIP; 154 units permitted in Lee County in 2024 (24 in 5+ unit buildings).
Forward outlook
- Local home prices are declining (-3.0%/yr); year-one equity from $898 of loan paydown is wiped out by about $4k of value loss. Plan a longer hold.
- Lee County population projected at +6% by 2050 — modest demand growth; plan on rents tracking national, not racing it.
Negotiation context
- It's been on market 39 days — a 3% lower offer ($126k) is reasonable based on typical stale-listing flexibility.
- 3 sale attempts since 3y ago; this cycle's ask has dropped $10k (7%) from the opening price — seller is motivated, your offer sets the floor, not the list.
Risks & watch-outs
- Climate carrying-cost: major wind risk, 27% chance of damaging wind over 30y; extreme-heat days projected 7→20/yr by 2055 (HVAC capex compounding) — expect insurance premiums to compound above CPI over the hold.
Questions for the listing agent
- It's been on market 39 days. Have you received any prior offers? Is the seller open to a 3% concession, seller financing, or rate buy-down credit?
- Built in 1977 — when were the roof, HVAC, electrical panel, plumbing, and water heater last replaced?
- What does the HOA fee cover, when was the last increase, and are there any pending special assessments or reserve-fund shortfalls?
- Is there a deadline driving the sale (1031 exchange, divorce, estate, relocation)? That informs how much negotiation room exists.
- Crime grade is F in this area — have there been break-ins, vandalism, or insurance claims at this property in the last 3 years? What carrier currently insures it and at what premium?
- What's the average days-on-market for RENTAL listings here right now (not sales)? A rising rental-DOM trend means longer vacancies and softer asking-rent achievability than the comps imply.
- What's the recent tenant-quality profile in this submarket — average credit score on applications, eviction rate, late-payment / NSF rate, and stable-employment percentage? A property-management company in the area should have these aggregated.
- How much new for-sale + rental construction is in the pipeline within 1–3 miles? Heavy new supply typically softens prices + rents 12–24 months out; constrained supply supports both.
Investment metrics
- 1% rule
- 1.19% ✓
- Cap rate
- 9.26%
- Cash-on-cash
- 10.61%
- DSCR
- 1.47
- GRM
- 7.0
CMA / ARV
- ARV (median comp)
- $142,997
- List price
- $129,900
- Delta
- -9.16%
- Verdict
- FAIR
- Comps
- 5 within 1.0 mi
Projected returns pro-forma
-3.0% appreciation · 3.0% rent growth · sell at horizon
- IRR
- -0.4%
- Equity multiple
- 0.99×
- Total profit
- $-536
- Equity at exit
- $19,369
- IRR
- 9.3%
- Equity multiple
- 1.72×
- Total profit
- $26,024
- Equity at exit
- $11,231
Cash invested: $36,372 (down + closing). Projections, not guarantees.
Landlord ↔ Tenant lean methodology
- Overall (STATE)
- 90 Strongly Landlord-Friendly
- State Mississippi
- 90 Strongly Landlord-Friendly · R+11
- County
- — inherits STATE
- City
- — inherits STATE
ZIP-level market 38804
- Active inventory
- 173
- Price-to-rent
- 7.0×
Monthly cashflow live
- Estimated rent
- $1,552 medium interval (Pro) →
- Mortgage (P&I)
- −$681
- Tax from tax record
- −$149 /mo · $1,792/yr
- Insurance
- −$54
- HOA
- −$20
- Vacancy / Maint / Mgmt
- −$326
- Net cashflow
- $322
Break-even live
Sensitivity live
| Price | -10% $395 | -5% $358 | +0% $322 | +5% $285 | +10% $248 |
|---|---|---|---|---|---|
| Rent | -10% $199 | -5% $260 | +0% $322 | +5% $383 | +10% $444 |
| Rate | -1.0pp $387 | -0.5pp $355 | base $322 | +0.5pp $288 | +1.0pp $254 |
UW: 25.0% down · 7.5% · 30yr · 1.5% tax · 5.0% vac · 8.0% maint · 8.0% mgmt
Financing live
Cash to close
- Down payment
- $32,475
- Closing costs
- $3,897
- Reserves months
- —
- Total cash needed
- —
Loan-product check · same deal, 3 products live
Conventional
25% down · 7.5% · 30yr
- Down + closing
- —
- Monthly P&I
- —
- Monthly cashflow
- —
- DSCR
- —
- Eligible?
- —
Personal DTI + credit; lowest rate.
DSCR
20% down · 8.5% · 30yr
- Down + closing
- —
- Monthly P&I
- —
- Monthly cashflow
- —
- DSCR
- —
- Eligible?
- —
No personal income docs; deal must DSCR.
Hard money
10% down · 12.0% · 12mo
- Down + closing
- —
- Monthly P&I
- —
- Monthly cashflow
- —
- DSCR
- —
- Eligible?
- —
Short-term bridge; refi at stabilization.
HOA detail
- Monthly dues
- $20 · $240/yr
Listing history 17 events
-
2026-06-21days on market $129,900 Active 39 DOM
-
2026-06-19days on market $129,900 Active 37 DOM
-
2026-06-18days on market $129,900 Active 36 DOM
-
2026-06-17days on market $129,900 Active 35 DOM
-
2026-06-17status $129,900 Active 34 DOM
-
2026-06-07statusdays on market $129,900 Pending 34 DOM
-
2026-06-02days on market $129,900 Active 32 DOM
-
2026-06-01days on market $129,900 Active 31 DOM
-
2026-05-31days on market $129,900 Active 30 DOM
-
2026-05-30days on market $129,900 Active 29 DOM
-
2026-05-01$140,000 Active 562-char remark
-
2023-08-28soldstatus 315-char remark
Show marketing remark (315 chars)
Completely RENOVATED in Lake Piomingo! Brand new everything - new cabinets, new flooring, new paint! Roof is 2 years old. BRAND NEW SEPTIC TANK - installed summer 2023! Mooreville School District. Schedule an appointment to see this one before it's gone! All information deemed reliable but subject to verification.
-
2023-08-28soldstatus $129,900
Show marketing remark (315 chars)
Completely RENOVATED in Lake Piomingo! Brand new everything - new cabinets, new flooring, new paint! Roof is 2 years old. BRAND NEW SEPTIC TANK - installed summer 2023! Mooreville School District. Schedule an appointment to see this one before it's gone! All information deemed reliable but subject to verification.
-
2023-06-02$129,900 315-char remark
Show marketing remark (315 chars)
Completely RENOVATED in Lake Piomingo! Brand new everything - new cabinets, new flooring, new paint! Roof is 2 years old. BRAND NEW SEPTIC TANK - installed summer 2023! Mooreville School District. Schedule an appointment to see this one before it's gone! All information deemed reliable but subject to verification.
-
2022-12-07soldstatus
-
2020-05-12soldstatus
-
2016-02-24soldstatus
ⓘ Source: listings_history table (triggers on properties + properties_extension) + one-shot
backfill from property_details.listing_events for pre-trigger history.
Tax reassessment forecast MS · Resets to sale price
- Current annual tax
- $1,792 · $149/mo
- Projected year-2 tax
- $1,792 · $149/mo
- Expected delta
- $0/yr ($0/mo · 0.0%)
ⓘ Screening estimate from a state-policy table — verify with the county assessor before closing.
Climate risk First Street
- Flood 1/10 Low FEMA zone X (unshaded) · 0% chance over 30 yrs
- Wildfire 4/10 Moderate
- Heat 6/10 Major 7 d/yr ≥108°F today · 20 d/yr by 30 yrs out
- Wind 6/10 Major 27% chance of damaging wind over 30 yrs
- Air quality 1/10 Low 0 unhealthy d/yr today · 0 by 30 yrs out
Nearby sold comps map
Loading sold comps map…
Walkable amenities ~0.75 mi
Loading nearby amenities…
Taxation est. · year 1
- Rental income
- $18,627
- − Mortgage interest
- −$7,276
- − Property taxes
- −$1,792
- − Insurance
- −$650
- − Repairs & maintenance
- −$1,490
- − Management
- −$1,490
- − HOA
- −$240
- − Depreciation
- −$3,779
- Taxable income
- $1,910
- Est. tax owed @ 24.0%
- −$458
- After-tax cash flow
- $3,401/yr
For passive investors: Depreciation is non-cash, so a rental often shows a tax loss while cash-flowing — sheltering income. Rental losses are passive: they offset passive income freely, and up to $25,000/yr can offset ordinary (W-2) income if you actively participate and your MAGI is under $100k (phasing out to $0 by $150k); unused losses carry forward. On sale, claimed depreciation is recaptured at up to 25%, and gains may owe capital-gains tax (a 1031 exchange can defer both). Figures are a year-1 estimate at your 24.0% rate — not tax advice; consult a CPA.
Schools (NCES district)
- District
- Lee County School District
- NCES district ID
- 2802550
- Math proficiency
- 37% ▼ -11.00%
- Reading proficiency
- 35% ▼ -6.00%
- Median HH income
- $41,435
- Composite
- 30.38/100
- National rank
- #6253
- State rank
- #51 of 130 in MS
Livability — Tupelo
- Score
- 72/100
- State rank
- #26
- US rank
- #6369
Category grades
Schools grade is shown separately in the Schools card above.
Census & demographics
- County
- Lee County · 52,445 people
- City population
- 46,551
- Metro
- Tupelo, MS
- Population (ZIP)
- 16,693
- Household income
- $64,420
- Rent vs Own
- Severe rent burden
- 642.0
Population outlook (Lee County) Hauer SSP2
- Today (2025)
- 90,253 people
- By 2030
- 92,125 · +2.1%
- By 2040
- 94,914 · +5.2%
- By 2050
- 95,841 · +6.2%
- By 2075
- 94,189 · +4.4%
- By 2100
- 83,736 · -7.2%
Race, ethnicity, and origin ACS 2023
- Neighborhood character
- Majority White (63%)
- Race & ethnicity
- White 63% Black 30% Two or more races 3% Hispanic / Latino 3% Native American 1%
- Common ancestry
- Serbian 3% Slovak 2% Italian 2%
- Foreign-born
- 1%
- Languages at home
- 98% English-only · Spanish 1% Other Indo-European 1%
Political lean MEDSL · Lee
- 2024 margin
- Solid R (+38.8) · D 30.0% · R 68.9% · Other 1.1%
- 2008→2024 swing
- -8.3pp toward R · 2008: -30.5pp · 2024: -38.8pp
- All cycles
- 2024: R+38.8 2020: R+32.5 2016: R+37.7 2012: R+29.0 2008: R+30.5
Not yet ingested
- Civics
- —
Market trends
- HPI YoY
- ▼ -111.19%
- Current HPI
- 172.0153
- Rent YoY
- —
- Metro
- Tupelo, MS
- State GDP YoY
- —
- F500 in state
- 0
Price history
+0.0% since first listed10 events — show timeline
- 2026-06-16 Relisted — NEMSBD
- 2026-06-04 Pending — NEMSBD
- 2026-05-28 Price Changed $129,900 NEMSBD
- 2026-05-01 Listed $140,000 NEMSBD
- 2023-08-28 Sold (Public Records) $129,900 Public Records
- 2023-08-28 Sold (MLS) — NEMSBD
- 2023-06-02 Listed $129,900 NEMSBD
- 2022-12-07 Sold (Public Records) — Public Records
- 2020-05-12 Sold (Public Records) — Public Records
- 2016-02-24 Sold (Public Records) — Public Records
Property tax history
+23.6%/yrLatest (2025): $1,792 · +1.3% YoY. Source: county tax records.
Cash-flow waterfall
monthlySold comps — $/sqft
last 12 mo · ≤1 miLoading sold comps…