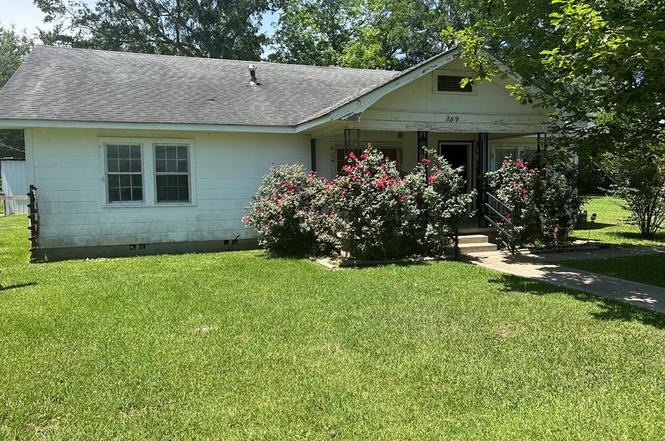
209 Maple St · Sandersville, MS
Flood risk 1/10 · Minimal
- FEMA flood zone
- X (unshaded)
- Chance of flooding over 30 yrs
- 0.0%
- Est. flood insurance / yr
- $507 – $1,088
Fire risk 3/10 · Minor
- Est. fire insurance / yr
- $1,241 – $2,305
Heat risk 8/10 · Major
- Hot days now (above 107°F)
- 7 days/yr
- Hot days in 30 yrs
- 21 days/yr
Wind risk 8/10 · Major
- Chance of severe wind over 30 yrs
- 92.0%
Air-quality risk 1/10 · Minimal
- Unhealthy air days now
- 0 days/yr
- Unhealthy air days in 30 yrs
- 0 days/yr
Risk factors via First Street. Map © Google.
Why this score? — see what drove the B grade
The composite is a weighted blend of 9 inputs, each scored 0–100. Each bar is that input's sub-score; the figure is the points it added to the 100-point composite (weight × sub-score).
- Cash flow +30.0/30.0
- 1% rule +10.0/10.0
- DSCR +10.0/10.0
- ARV discount +7.5/15.0
- Appreciation +5.0/10.0
- Schools +3.3/10.0
- Livability +3.3/5.0
- Rent growth +2.5/5.0
- Condition / age +2.5/5.0
$39,900
🖨 Deal sheet 📄 Offer letter ✓ Due diligence
Listing remarks
LOCATION, LOCATION, LOCATION! 3BR 2BA 1770 SQ. FT. FIXER UPPER ON BEAUTIFUL CORNER LOT IN DOWNTOWN SANDERSVILLE. NEEDS LOTS OF WORK, BUT COULD BE VERY NICE. IS DUCTED FOR CENTRAL HEAT AND AIR. MUST SEE TO APPRECIATE. TONGUE AND GROVE WALLS THROUGHOUT SOME UNDER SHEETROCK. MOTIVATED SELLER! MAKE OFFER!!!
Key facts
- Corner lot
- Built 1955
- Listed 52 days
Tags
Neighborhood map
What this means for you Summary
Snapshot
- This is a 3-bed/2.0-bath single-family listed at $40k.
Deal economics
- At list price, monthly cash flow is $621 ($7k/yr) — positive.
- The deal already cash-flows at list — no discount required.
- Meets the 1% rule at list price ($1k rent vs $40k).
- Recommended offer: $39k (3.0% below list) — sets the bar for market timing.
Location & tenants
- Location reads 66/100 on livability (#97 in MS) — a middle-class / working-renter tenant base. Strengths: cost of living A+, health & safety A+, housing A-; Watch: employment D, amenities F, commute F.
- Jones County School District (rural): math 40% / reading 39% proficiency, ranked #40 of 130 in MS (top 31%) — families likely to look elsewhere, expect single-tenant / working-renter base with shorter leases.
- Zoned schools: East Jones Elementary School (math 44% / reading 39%, grade F, #113 of 375 statewide, top 31%, 772 students, 100% FRL) — zoned schools average 100% FRL vs 59% district-wide (41 pts higher); higher-poverty schools than district average — tighter screening recommended.
- Market conditions: 5 active listings in the ZIP; 23 units permitted in Jones County in 2024 (5 in 5+ unit buildings).
Forward outlook
- In year one you build about $1k of equity ($276 loan paydown + $1k appreciation (3.0% local appreciation)).
- Jones County population projected to shrink 4% by 2050 — rents likely to lag national; underwrite the cash flow, not the appreciation.
- At projected returns (3.0% appreciation + 3.0% rent growth), your $11k cash investment doubles in ~2 years — after that, you're playing with house money.
Negotiation context
- It's been on market 52 days — a 3% lower offer ($39k) is reasonable based on typical stale-listing flexibility.
Risks & watch-outs
- Watch-outs: built in 1955 — expect roof / HVAC / electrical / plumbing capex.
- Climate carrying-cost: severe wind risk, 92% chance of damaging wind over 30y; extreme-heat days projected 7→21/yr by 2055 (HVAC capex compounding) — expect insurance premiums to compound above CPI over the hold.
Questions for the listing agent
- It's been on market 52 days. Have you received any prior offers? Is the seller open to a 3% concession, seller financing, or rate buy-down credit?
- Built in 1955 — when were the roof, HVAC, electrical panel, plumbing, and water heater last replaced?
- Is there a deadline driving the sale (1031 exchange, divorce, estate, relocation)? That informs how much negotiation room exists.
- Schools are F-rated, which usually means shorter tenancies and higher turnover. Who's the typical renter profile here, and what's been the actual vacancy rate?
- What's the average days-on-market for RENTAL listings here right now (not sales)? A rising rental-DOM trend means longer vacancies and softer asking-rent achievability than the comps imply.
- What's the recent tenant-quality profile in this submarket — average credit score on applications, eviction rate, late-payment / NSF rate, and stable-employment percentage? A property-management company in the area should have these aggregated.
- How much new for-sale + rental construction is in the pipeline within 1–3 miles? Heavy new supply typically softens prices + rents 12–24 months out; constrained supply supports both.
Investment metrics
- 1% rule
- 2.84% ✓
- Cap rate
- 24.97%
- Cash-on-cash
- 66.69%
- DSCR
- 3.97
- GRM
- 2.9
CMA / ARV
- ARV (on-the-fly)
- $178,770
- Comps found
- 1
Show comp detail 1 sale within ~0.75 mi
| Address | Dist | Beds/Ba | Sqft | Sold | Price | $/sf | Match |
|---|---|---|---|---|---|---|---|
| 703 W Main St | 0.67mi | 4/2.0 (+1) | 1,625 (-8%) | 19mo | $164,900 | $101 | 34 |
Match score weights: distance 35% · size 25% · config 20% · recency 20%. Top-matched comps best support the ARV.
Projected returns pro-forma
3.0% appreciation · 3.0% rent growth · sell at horizon
- IRR
- 71.4%
- Equity multiple
- 4.97×
- Total profit
- $44,370
- Equity at exit
- $17,941
- IRR
- 70.9%
- Equity multiple
- 10.18×
- Total profit
- $102,561
- Equity at exit
- $27,649
Cash invested: $11,172 (down + closing). Projections, not guarantees.
Landlord ↔ Tenant lean methodology
- Overall (STATE)
- 90 Strongly Landlord-Friendly
- State Mississippi
- 90 Strongly Landlord-Friendly · R+11
- County
- — inherits STATE
- City
- — inherits STATE
ZIP-level market 39477
- Active inventory
- 5
- Price-to-rent
- 2.9×
Monthly cashflow live
- Estimated rent
- $1,135 medium interval (Pro) →
- Mortgage (P&I)
- −$209
- Tax est. 1.5%
- −$50 /mo · $598/yr
- Insurance
- −$17
- HOA
- −$0
- Vacancy / Maint / Mgmt
- −$238
- Net cashflow
- $621
Break-even live
UW: 25.0% down · 7.5% · 30yr · 1.5% tax · 5.0% vac · 8.0% maint · 8.0% mgmt
Financing live
Cash to close
- Down payment
- $9,975
- Closing costs
- $1,197
- Reserves months
- —
- Total cash needed
- —
Loan-product check · same deal, 3 products live
Conventional
25% down · 7.5% · 30yr
- Down + closing
- —
- Monthly P&I
- —
- Monthly cashflow
- —
- DSCR
- —
- Eligible?
- —
Personal DTI + credit; lowest rate.
DSCR
20% down · 8.5% · 30yr
- Down + closing
- —
- Monthly P&I
- —
- Monthly cashflow
- —
- DSCR
- —
- Eligible?
- —
No personal income docs; deal must DSCR.
Hard money
10% down · 12.0% · 12mo
- Down + closing
- —
- Monthly P&I
- —
- Monthly cashflow
- —
- DSCR
- —
- Eligible?
- —
Short-term bridge; refi at stabilization.
Listing history 4 events
-
2025-07-18status Pending
-
2025-06-25price $39,900
-
2025-06-12price $49,900
-
2025-05-27$59,900 Active
ⓘ Source: listings_history table (triggers on properties + properties_extension) + one-shot
backfill from property_details.listing_events for pre-trigger history.
Climate risk First Street
- Flood 1/10 Low FEMA zone X (unshaded) · 0% chance over 30 yrs
- Wildfire 3/10 Moderate
- Heat 8/10 Severe 7 d/yr ≥107°F today · 21 d/yr by 30 yrs out
- Wind 8/10 Severe 92% chance of damaging wind over 30 yrs
- Air quality 1/10 Low 0 unhealthy d/yr today · 0 by 30 yrs out
Nearby sold comps map
Loading sold comps map…
Walkable amenities ~0.75 mi
Loading nearby amenities…
Taxation est. · year 1
- Rental income
- $13,620
- − Mortgage interest
- −$2,235
- − Property taxes
- −$598
- − Insurance
- −$200
- − Repairs & maintenance
- −$1,090
- − Management
- −$1,090
- − Depreciation
- −$1,161
- Taxable income
- $7,247
- Est. tax owed @ 24.0%
- −$1,739
- After-tax cash flow
- $5,712/yr
For passive investors: Depreciation is non-cash, so a rental often shows a tax loss while cash-flowing — sheltering income. Rental losses are passive: they offset passive income freely, and up to $25,000/yr can offset ordinary (W-2) income if you actively participate and your MAGI is under $100k (phasing out to $0 by $150k); unused losses carry forward. On sale, claimed depreciation is recaptured at up to 25%, and gains may owe capital-gains tax (a 1031 exchange can defer both). Figures are a year-1 estimate at your 24.0% rate — not tax advice; consult a CPA.
Schools (NCES district)
- District
- Jones County School District
- NCES district ID
- 2802280
- Math proficiency
- 40% ▼ -11.00%
- Reading proficiency
- 39% ▼ -6.00%
- Median HH income
- $41,051
- Composite
- 33.24/100
- National rank
- #5520
- State rank
- #40 of 130 in MS
Livability — Sandersville
- Score
- 66/100
- State rank
- #97
- US rank
- #12050
Category grades
Schools grade is shown separately in the Schools card above.
Census & demographics
- Census place
- Sandersville, MS
- City population
- 479
- Population (ZIP)
- 479
Population outlook (Jones County) Hauer SSP2
- Today (2025)
- 68,800 people
- By 2030
- 68,773 · +-0.0%
- By 2040
- 68,087 · -1.0%
- By 2050
- 66,241 · -3.7%
- By 2075
- 58,600 · -14.8%
- By 2100
- 45,744 · -33.5%
Race, ethnicity, and origin ACS 2023
- Neighborhood character
- Predominantly White (89%)
- Race & ethnicity
- White 89% Black 7% Hispanic / Latino 4%
- Common ancestry
- Slovak 5% Serbian 3%
Political lean MEDSL · Jones
- 2024 margin
- Solid R (+46.8) · D 26.2% · R 73.0%
- 2008→2024 swing
- -8.2pp toward R · 2008: -38.6pp · 2024: -46.8pp
- All cycles
- 2024: R+46.8 2020: R+42.2 2016: R+43.6 2012: R+38.2 2008: R+38.6
Not yet ingested
- Civics
- —
Market trends
- HPI YoY
- —
- Current HPI
- —
- Rent YoY
- —
- Metro
- —
- State GDP YoY
- —
- F500 in state
- 0
Price history
-33.4% since first listed4 events — show timeline
- 2025-07-18 Pending — LBOR
- 2025-06-25 Price Changed $39,900 LBOR
- 2025-06-12 Price Changed $49,900 LBOR
- 2025-05-27 Listed $59,900 LBOR
Cash-flow waterfall
monthlySold comps — $/sqft
last 12 mo · ≤1 miLoading sold comps…