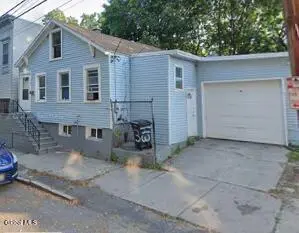
113 Spring St · Albany, NY
Flood risk 1/10 · Minimal
- FEMA flood zone
- X (unshaded)
- Chance of flooding over 30 yrs
- 0.0%
- Est. flood insurance / yr
- $473 – $860
Fire risk 1/10 · Minimal
- Est. fire insurance / yr
- $691 – $1,283
Heat risk 4/10 · Minor
- Hot days now (above 97°F)
- 7 days/yr
- Hot days in 30 yrs
- 17 days/yr
Wind risk 3/10 · Minor
- Chance of severe wind over 30 yrs
- 6.0%
Air-quality risk 1/10 · Minimal
- Unhealthy air days now
- 0 days/yr
- Unhealthy air days in 30 yrs
- 0 days/yr
Risk factors via First Street. Map © Google.
Why this score? — see what drove the D grade
The composite is a weighted blend of 9 inputs, each scored 0–100. Each bar is that input's sub-score; the figure is the points it added to the 100-point composite (weight × sub-score).
- ARV discount +15.0/15.0
- Cash flow +10.1/30.0
- 1% rule +4.0/10.0
- Livability +4.0/5.0
- Schools +3.2/10.0
- Rent growth +3.0/5.0
- DSCR +2.9/10.0
- Condition / age +2.5/5.0
- Appreciation +0.0/10.0
$225,000
🖨 Deal sheet 📄 Offer letter ✓ Due diligence
Listing remarks MLS
THIS HOME CAN BE A MONEY MAKER! RENT TO STUDENTS AND IT WILL PAY THE MORGAGE! SICK OF PAYING RENT? MOVE RIGHT INTO THIS HOME AND STOP PAYING SOMEONE ELSE! IMMEDIATE OCCUPANY! HOME SOLD AS IS. Fair Condition
Key facts
- Dressing mud room
- Laundry closet
- New roof
Tags
Property features AI
Exterior
- Parking: Attached garage (1 garage space); Two total parking spaces; Paved driveway and off-street parking
- Utilities: 150 amp electric service; Public water; Public sewer; Cable connected
- Home design: Single family residence
- Construction: Aluminum siding; Vinyl siding
- Exterior features: Shingle (asphalt) roof; Level lot; Road frontage
Interior
- Kitchen: Gas oven; Range; Refrigerator
- Bedrooms: Three bedrooms on the first floor
- Flooring: Tile; Hardwood; Laminate
- Bathrooms: Two full bathrooms on the first floor
- Heating & cooling: Baseboard heating; Hot water heating; Natural gas heating
- Interior features: Eight total rooms; Double-pane windows
- Laundry & utility: Washer/Dryer included; Laundry closet on the main level
Neighborhood map
What this means for you Summary
Snapshot
- This is a 2-bed/1.0-bath single-family listed at $225k.
Deal economics
- At list price, monthly cash flow is $-132 ($-2k/yr) — negative.
- To cash-flow at today's rent, offer at most $202k (10.4% below list).
- To meet the 1% rule (rent ≥ 1% of price), the offer needs to be $203k (9.8% below list).
- Recommended offer: $202k (10.4% below list) — sets the bar for cash-flow.
Location & tenants
- Location reads 79/100 on livability (#129 in NY, #2,083 nationally) — a middle-class / working-renter tenant base. Strengths: amenities A+, commute A+, housing A+; Watch: employment C-, crime F.
- Albany City School District (urban): math 37% / reading 40% proficiency, ranked #543 of 590 in NY (top 92%) — families likely to look elsewhere, expect single-tenant / working-renter base with shorter leases; 66% free/reduced lunch — lower-income household profile, screen leases tightly.
- Zoned schools: Albany High School (math 74% / reading 67%, grade B+, #710 of 1,100 statewide, top 65%, 2,676 students, 69% FRL) — zoned schools at 69% FRL track the district average.
- Zoned-school proficiency averages 70% at this address vs 38% district-wide (+32 pts) — the actual schools serving this property are materially stronger than the Albany City School District average implies; a family-tenant draw the district grade alone would hide.
- Market conditions: Rents rising (+1.9%/yr); 124 active listings in the ZIP; 25 comparable units currently listed for rent nearby; rentals at typical pace (median 24d on market — plan ~3-4 weeks tenant-placement turnaround); solid renter incomes; 675 units permitted in Albany County in 2024 (451 in 5+ unit buildings).
Forward outlook
- Local home prices are declining (-3.0%/yr); year-one equity from $2k of loan paydown is wiped out by about $7k of value loss. Plan a longer hold.
- Albany County population projected at +9% by 2050 — modest demand growth; plan on rents tracking national, not racing it.
Negotiation context
- It's been on market 28 days — a 2% lower offer ($222k) is reasonable based on typical stale-listing flexibility.
- 6 sale attempts since 25y ago with the ask held roughly flat each time — persistent listings suggest the price (not the market) is what's stuck; bring a comps-based counter.
- Current owner paid $65k; list at $225k implies a 246% gain — meaningful room to come down on a strong offer.
Risks & watch-outs
- Watch-outs: built in 1905 — expect roof / HVAC / electrical / plumbing capex.
Questions for the listing agent
- What do current leases actually rent for vs. the listed asking? Can we see a recent rent roll and the last 12 months of T-12 income?
- Built in 1905 — when were the roof, HVAC, electrical panel, plumbing, and water heater last replaced?
- Is there a deadline driving the sale (1031 exchange, divorce, estate, relocation)? That informs how much negotiation room exists.
- Crime grade is F in this area — have there been break-ins, vandalism, or insurance claims at this property in the last 3 years? What carrier currently insures it and at what premium?
- The area grade is low — what's the realistic commute time and amenity access for the typical tenant pool here? Any planned neighborhood developments (good or bad) we should know about?
- What's the average days-on-market for RENTAL listings here right now (not sales)? A rising rental-DOM trend means longer vacancies and softer asking-rent achievability than the comps imply.
- What's the recent tenant-quality profile in this submarket — average credit score on applications, eviction rate, late-payment / NSF rate, and stable-employment percentage? A property-management company in the area should have these aggregated.
- How much new for-sale + rental construction is in the pipeline within 1–3 miles? Heavy new supply typically softens prices + rents 12–24 months out; constrained supply supports both.
Investment metrics
- 1% rule
- 0.90% ✗
- Cap rate
- 5.59%
- Cash-on-cash
- -2.52%
- DSCR
- 0.89
- GRM
- 9.2
CMA / ARV
- ARV (on-the-fly)
- $296,592
- Comps found
- 4
Show comp detail 4 sales within ~0.75 mi
| Address | Dist | Beds/Ba | Sqft | Sold | Price | $/sf | Match |
|---|---|---|---|---|---|---|---|
| 294 Western Ave | 0.31mi | 3/1.5 (+1) | 1,840 (+4%) | 12mo | $275,000 | $149 | 63 |
| 282 Morris St | 0.47mi | 3/1.5 (+1) | 1,766 (-1%) | 14mo | $250,000 | $142 | 58 |
| 564 Myrtle Ave | 0.50mi | 3/1.5 (+1) | 1,692 (-5%) | 8mo | $309,000 | $183 | 55 |
| 789 Myrtle Ave | 0.74mi | 3/1.5 (+1) | 1,531 (-14%) | 15mo | $255,000 | $167 | 23 |
Match score weights: distance 35% · size 25% · config 20% · recency 20%. Top-matched comps best support the ARV.
Projected returns pro-forma
-3.0% appreciation · 1.85% rent growth · sell at horizon
- IRR
- -21.9%
- Equity multiple
- 0.25×
- Total profit
- $-47,078
- Equity at exit
- $33,548
- IRR
- -18.9%
- Equity multiple
- 0.04×
- Total profit
- $-60,592
- Equity at exit
- $19,454
Cash invested: $63,000 (down + closing). Projections, not guarantees.
Landlord ↔ Tenant lean methodology
- Overall (STATE)
- 15 Strongly Tenant-Friendly
- State New York
- 15 Strongly Tenant-Friendly · D+10
- County
- — inherits STATE
- City
- — inherits STATE
ZIP-level market 12203
- Home prices YoY
- -31.0%
- Rents YoY
- 1.9%
- Active inventory
- 124
- Price-to-rent
- 9.2×
Monthly cashflow live
- Estimated rent
- $2,029 high interval (Pro) →
- Mortgage (P&I)
- −$1,180
- Tax from tax record
- −$462 /mo · $5,540/yr
- Insurance
- −$94
- HOA
- −$0
- Vacancy / Maint / Mgmt
- −$426
- Net cashflow
- $-132
Break-even live
UW: 25.0% down · 7.5% · 30yr · 1.5% tax · 5.0% vac · 8.0% maint · 8.0% mgmt
Financing live
Cash to close
- Down payment
- $56,250
- Closing costs
- $6,750
- Reserves months
- —
- Total cash needed
- —
Loan-product check · same deal, 3 products live
Conventional
25% down · 7.5% · 30yr
- Down + closing
- —
- Monthly P&I
- —
- Monthly cashflow
- —
- DSCR
- —
- Eligible?
- —
Personal DTI + credit; lowest rate.
DSCR
20% down · 8.5% · 30yr
- Down + closing
- —
- Monthly P&I
- —
- Monthly cashflow
- —
- DSCR
- —
- Eligible?
- —
No personal income docs; deal must DSCR.
Hard money
10% down · 12.0% · 12mo
- Down + closing
- —
- Monthly P&I
- —
- Monthly cashflow
- —
- DSCR
- —
- Eligible?
- —
Short-term bridge; refi at stabilization.
Rent comps 25 comps
| Address | Beds | Baths | Sqft | Rent | $/sqft | DOM | Units | Dist |
|---|---|---|---|---|---|---|---|---|
| 147 Western Ave Albany, NY | 3.0 | 1.0 | 1428 | $1,800 | $1.26 | 14d | 1 | 0.13mi |
| 154 Spring St Albany, NY | 3.0 | 1.0 | 2500 | $1,695 | $0.68 | 43d | 1 | 0.15mi |
| 178 Western Ave Unit 3 Albany, NY | 3.0 | 1.0 | 1500 | $1,725 | $1.15 | 14d | 1 | 0.16mi |
| 240 Washington Ave Albany, NY | 2.0 | 2.0 | 1560 | $2,450 | $1.57 | 43d | 1 | 0.61mi |
| 363 Ontario St Albany, NY | 1.0–2.0 | 1.0–2.5 | 1610 | $3,485 | $2.16 | 14d | 1 | 0.68mi |
| 546 Mercer St Unit 1 Albany, NY | 3.0 | 1.0 | 1400 | $1,800 | $1.29 | 23d | 1 | 0.71mi |
| 88 Willett St Albany, NY | 3.0 | 1.0 | 825 | $1,802 | $2.18 | 14d | 10 | 0.72mi |
| 602 Morris St Albany, NY | 3.0 | 1.0 | 1270 | $1,850 | $1.46 | 14d | 1 | 0.72mi |
| 227 Jay St Albany, NY | 2.0 | 2.0 | 1710 | $2,150 | $1.26 | 43d | 1 | 0.74mi |
| 282 Livingston Ave Albany, NY | 3.0 | 1.5 | 1464 | $2,400 | $1.64 | 23d | 1 | 0.80mi |
| 21 Woodlawn Ave Unit 3RDFL Albany, NY | 3.0 | 1.0 | 1300 | $1,500 | $1.15 | 43d | 1 | 0.81mi |
| 21 Woodlawn Ave Unit 3rd floor Albany, NY | 3.0 | 1.0 | 1300 | $1,500 | $1.15 | 23d | 1 | 0.81mi |
| 41 Dove St Albany, NY | 2.0 | 2.5 | 2400 | $2,350 | $0.98 | 14d | 1 | 0.83mi |
| 366 Hamilton St #2 Albany, NY | 1.0 | 1.0 | 1400 | $1,800 | $1.29 | 14d | 1 | 0.86mi |
| 154 Lancaster St Unit 1 Albany, NY | 2.0 | 1.5 | 1500 | $2,200 | $1.47 | 23d | 1 | 0.88mi |
| 32 Peyster St Unit 2nd Albany, NY | 3.0 | 2.0 | 1500 | $2,300 | $1.53 | 43d | 1 | 0.91mi |
| 104 S Main Ave Unit 1 Albany, NY | 3.0 | 1.0 | 1300 | $2,600 | $2.00 | 43d | 1 | 0.99mi |
| 346 Madison Ave Albany, NY | 3.0 | 2.0 | 1500 | $2,495 | $1.66 | 23d | 1 | 0.99mi |
| 201 Park Ave Unit 10 Albany, NY | 3.0 | 2.0 | 1600 | $2,100 | $1.31 | 43d | 1 | 1.09mi |
| 78 S Pine Ave Unit 2 Albany, NY | 3.0 | 1.5 | 1541 | $2,350 | $1.52 | 14d | 1 | 1.13mi |
| 135 Winthrop Ave Albany, NY | 3.0 | 2.0 | 1788 | $3,500 | $1.96 | 43d | 1 | 1.17mi |
| 15 Ten Broeck St Albany, NY | 2.0 | 1.5 | 1900 | $1,750 | $0.92 | 21d | 1 | 1.28mi |
| 48 N Pearl St Albany, NY | 2.0 | 1.0–2.5 | 1251 | $3,500 | $2.80 | 14d | 17 | 1.37mi |
| 563 New Scotland Ave Albany, NY | 2.0 | 1.0–2.0 | 931 | $3,125 | $3.36 | 14d | 37 | 1.47mi |
| 32 Richmond St Unit 2 Albany, NY | 3.0 | 3.0 | 1248 | $2,500 | $2.00 | 14d | 1 | 1.48mi |
Listing history 31 events
-
2026-06-18days on market $225,000 Active 28 DOM
-
2026-06-17days on market $225,000 Active 27 DOM
-
2026-06-16days on market $225,000 Active 26 DOM
-
2026-06-15days on market $225,000 Active 25 DOM
-
2026-06-14days on market $225,000 Active 23 DOM
-
2026-06-10days on market $225,000 Active 20 DOM
-
2026-06-08days on market $225,000 Active 18 DOM
-
2026-06-07days on market $225,000 Active 17 DOM
-
2026-06-03days on market $225,000 Active 13 DOM
-
2026-06-02days on market $225,000 Active 12 DOM
-
2026-06-01days on market $225,000 Active 11 DOM
-
2026-05-31days on market $225,000 Active 10 DOM
-
2026-05-31days on market $225,000 Active 9 DOM
-
2026-05-21$235,000 Active
-
2024-12-17historical
-
2024-09-25price $236,900
-
2024-08-26price $236,902
-
2024-08-15$239,902 Active
-
2008-11-11soldstatus $65,000 206-char remark
Show marketing remark (206 chars)
THIS HOME CAN BE A MONEY MAKER! RENT TO STUDENTS AND IT WILL PAY THE MORGAGE! SICK OF PAYING RENT? MOVE RIGHT INTO THIS HOME AND STOP PAYING SOMEONE ELSE! IMMEDIATE OCCUPANY! HOME SOLD AS IS. Fair Condition
-
2008-08-26historical 206-char remark
Show marketing remark (206 chars)
THIS HOME CAN BE A MONEY MAKER! RENT TO STUDENTS AND IT WILL PAY THE MORGAGE! SICK OF PAYING RENT? MOVE RIGHT INTO THIS HOME AND STOP PAYING SOMEONE ELSE! IMMEDIATE OCCUPANY! HOME SOLD AS IS. Fair Condition
-
2008-07-28$69,000 206-char remark
Show marketing remark (206 chars)
THIS HOME CAN BE A MONEY MAKER! RENT TO STUDENTS AND IT WILL PAY THE MORGAGE! SICK OF PAYING RENT? MOVE RIGHT INTO THIS HOME AND STOP PAYING SOMEONE ELSE! IMMEDIATE OCCUPANY! HOME SOLD AS IS. Fair Condition
-
2008-03-25historical
-
2008-01-18$89,000
-
2005-08-22soldstatus $85,000
-
2005-05-28historical
-
2005-04-27$89,900
-
2001-10-11soldstatus $28,000
-
2001-10-11soldstatus $79,506
-
2001-08-28soldstatus $28,000
-
2001-07-23historical
-
2001-07-16$29,900
ⓘ Source: listings_history table (triggers on properties + properties_extension) + one-shot
backfill from property_details.listing_events for pre-trigger history.
Tax reassessment forecast NY · Partial reset (capped growth)
- Current annual tax
- $5,540 · $462/mo
- Projected year-2 tax
- $5,540 · $462/mo
- Expected delta
- $0/yr ($0/mo · 0.0%)
ⓘ Screening estimate from a state-policy table — verify with the county assessor before closing.
Climate risk First Street
- Flood 1/10 Low FEMA zone X (unshaded) · 0% chance over 30 yrs
- Wildfire 1/10 Low
- Heat 4/10 Moderate 7 d/yr ≥97°F today · 17 d/yr by 30 yrs out
- Wind 3/10 Moderate 6% chance of damaging wind over 30 yrs
- Air quality 1/10 Low 0 unhealthy d/yr today · 0 by 30 yrs out
Nearby sold comps map
Loading sold comps map…
Walkable amenities ~0.75 mi
Loading nearby amenities…
Taxation est. · year 1
- Rental income
- $24,347
- − Mortgage interest
- −$12,603
- − Property taxes
- −$5,540
- − Insurance
- −$1,125
- − Repairs & maintenance
- −$1,948
- − Management
- −$1,948
- − Depreciation
- −$6,545
- Taxable loss
- −$5,362
- Est. tax savings @ 24.0%
- +$1,287
- After-tax cash flow
- $-303/yr
For passive investors: Depreciation is non-cash, so a rental often shows a tax loss while cash-flowing — sheltering income. Rental losses are passive: they offset passive income freely, and up to $25,000/yr can offset ordinary (W-2) income if you actively participate and your MAGI is under $100k (phasing out to $0 by $150k); unused losses carry forward. On sale, claimed depreciation is recaptured at up to 25%, and gains may owe capital-gains tax (a 1031 exchange can defer both). Figures are a year-1 estimate at your 24.0% rate — not tax advice; consult a CPA.
Schools (NCES district)
- District
- Albany City School District
- NCES district ID
- 3602460
- Math proficiency
- 37% ▲ 6.00%
- Reading proficiency
- 40% ▲ 7.00%
- Median HH income
- $40,568
- Composite
- 32.34/100
- National rank
- #5744
- State rank
- #543 of 590 in NY
Livability — Albany
- Score
- 79/100
- State rank
- #129
- US rank
- #2083
Category grades
Schools grade is shown separately in the Schools card above.
Census & demographics
- Census place
- Albany, NY
- County
- Albany County · 196,626 people
- City population
- 116,921
- Metro
- Albany-Schenectady-Troy, NY
- Population (ZIP)
- 30,771
- Household income
- $83,147
- Rent vs Own
- Severe rent burden
- 1704.0
Population outlook (Albany County) Hauer SSP2
- Today (2025)
- 320,794 people
- By 2030
- 327,401 · +2.1%
- By 2040
- 338,218 · +5.4%
- By 2050
- 348,467 · +8.6%
- By 2075
- 381,693 · +19.0%
- By 2100
- 393,809 · +22.8%
Race, ethnicity, and origin ACS 2023
- Neighborhood character
- Predominantly White (69%)
- Race & ethnicity
- White 69% Black 10% Asian 8% Hispanic / Latino 7% Two or more races 7%
- Hispanic origin (detail)
- Mexican 2% Puerto Rican 2%
- Common ancestry
- Romanian 5% Lithuanian 3% Slovak 2%
- Foreign-born
- 16% · Canada, China, South Korea
- Languages at home
- 82% English-only · Other Indo-European 6% Spanish 3% Russian/Polish/Slavic 2%
Political lean MEDSL · Albany
- 2024 margin
- Strong D (+25.8) · D 62.9% · R 37.1%
- 2008→2024 swing
- -3.6pp toward R · 2008: 29.4pp · 2024: 25.8pp
- All cycles
- 2024: D+25.8 2020: D+31.4 2016: D+24.3 2012: D+31.0 2008: D+29.4
Not yet ingested
- Civics
- —
Market trends
- HPI YoY
- ▼ -133.05%
- Current HPI
- 296.0467
- Rent YoY
- ▲ 1.85%
- Metro
- Albany-Schenectady-Troy, NY
- State GDP YoY
- ▲ 2.60%
- F500 in state
- 92
Industry mix (Fortune 500 HQ in NY)
| Industry | F500 HQs | Revenue |
|---|---|---|
| Financial Services | 10 | $950B |
|
||
| Consumer Goods | 9 | $162B |
|
||
| Insurance | 4 | $225B |
|
||
| Telecommunications | 2 | $144B |
|
||
| Pharmaceuticals | 2 | $112B |
|
||
| Media / Entertainment | 2 | $69B |
|
||
Price history
+686.0% since first listed18 events — show timeline
- 2026-05-21 Listed $235,000 Global MLS
- 2024-12-17 Listing Removed — Global MLS
- 2024-09-25 Price Changed $236,900 Global MLS
- 2024-08-26 Price Changed $236,902 Global MLS
- 2024-08-15 Listed $239,902 Global MLS
- 2008-11-11 Sold (MLS) $65,000 Global MLS
- 2008-08-26 Listing Removed — Global MLS
- 2008-07-28 Listed $69,000 Global MLS
- 2008-03-25 Listing Removed — Global MLS
- 2008-01-18 Listed $89,000 Global MLS
- 2005-08-22 Sold (MLS) $85,000 Global MLS
- 2005-05-28 Listing Removed — Global MLS
- 2005-04-27 Listed $89,900 Global MLS
- 2001-10-11 Sold (Public Records) $79,506 Public Records
- 2001-10-11 Sold (Public Records) $28,000 Public Records
- 2001-08-28 Sold (MLS) $28,000 Global MLS
- 2001-07-23 Listing Removed — Global MLS
- 2001-07-16 Listed $29,900 Global MLS
Property tax history
+5.4%/yrLatest (2025): $5,540 · +1.7% YoY. Source: county tax records.
Cash-flow waterfall
monthlySold comps — $/sqft
last 12 mo · ≤1 miLoading sold comps…