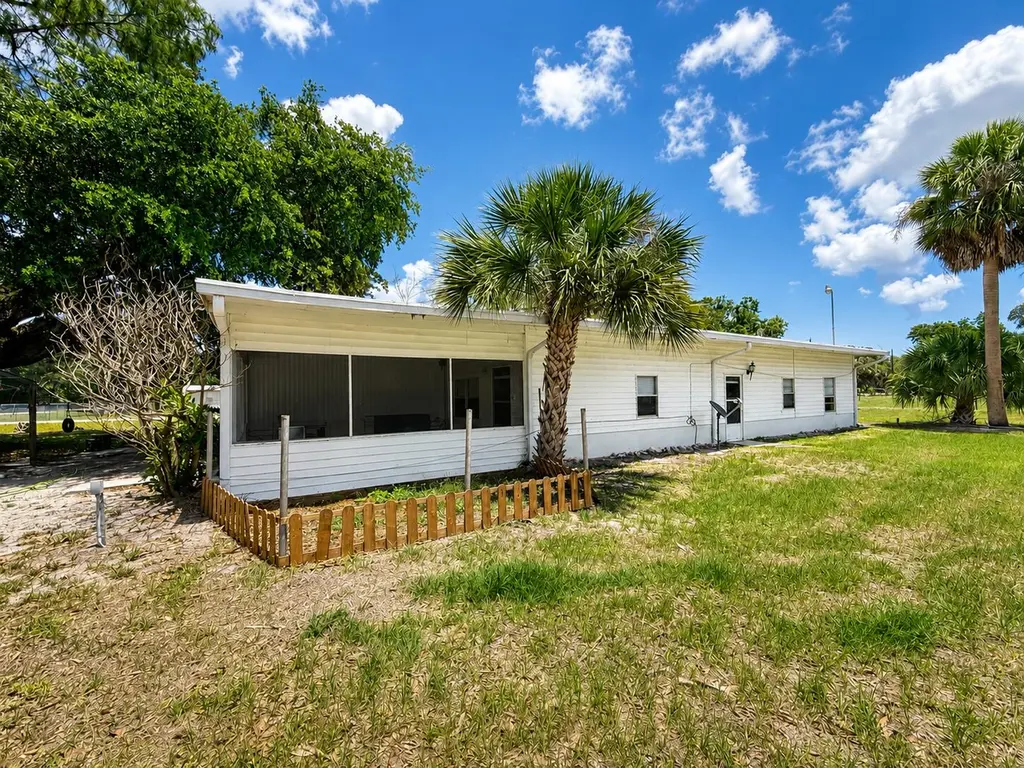
482 Palmetto Ave · Palmdale, FL
Flood risk 1/10 · Minimal
- FEMA flood zone
- X (unshaded)
- Chance of flooding over 30 yrs
- 0.0%
- Est. flood insurance / yr
- $507 – $1,088
Fire risk 4/10 · Minor
- Est. fire insurance / yr
- $947 – $1,759
Heat risk 8/10 · Major
- Hot days now (above 108°F)
- 7 days/yr
- Hot days in 30 yrs
- 25 days/yr
Wind risk 10/10 · Severe
- Chance of severe wind over 30 yrs
- 99.0%
Air-quality risk 2/10 · Minimal
- Unhealthy air days now
- 1 days/yr
- Unhealthy air days in 30 yrs
- 1 days/yr
Risk factors via First Street. Map © Google.
Why this score? — see what drove the C+ grade
The composite is a weighted blend of 9 inputs, each scored 0–100. Each bar is that input's sub-score; the figure is the points it added to the 100-point composite (weight × sub-score).
- Cash flow +22.5/30.0
- Appreciation +10.0/10.0
- ARV discount +7.5/15.0
- DSCR +7.2/10.0
- 1% rule +4.6/10.0
- Schools +3.3/10.0
- Rent growth +2.5/5.0
- Livability +2.5/5.0
- Condition / age +2.5/5.0
$185,000
🖨 Deal sheet 📄 Offer letter ✓ Due diligence
Listing remarks
Charming country retreat situated on almost 1 acre in a quiet and desirable area! This 2-bedroom, 2-bathroom home features a spacious fully enclosed Florida room, perfect for additional living or entertaining space, along with two screened-in porches to enjoy the peaceful outdoor setting year-round. The property is fully fenced and includes a separate fenced horse paddock with a 1-stall horse setup, making it ideal for equestrian enthusiasts or those looking for extra space and privacy. Positioned on a corner lot with plenty of room for animals, toys, or gardening, this property offers the perfect blend of country living and convenience.
Key facts
- 1-stall horse setup
- Fully fenced
- Florida room
Tags
Property features AI
Exterior
- Parking: Parking for 2 vehicles; No carport
- Utilities: Well water; Private sewer; Water available
- Home design: Mobile home (single wide); One-story; North-facing; Resale condition
- Construction: Vinyl siding; Metal roof; Single wide construction
- Exterior features: Corner lot; Outbuilding
Interior
- Kitchen: Microwave; Electric range; Refrigerator
- Bedrooms: 2 bedrooms on the main level
- Flooring: Carpet; Tile; Vinyl
- Bathrooms: 2 full bathrooms
- Heating & cooling: Central heating; Central air conditioning; Ceiling fans
- Interior features: Split bedroom layout; Microwave; Electric range; Refrigerator
- Laundry & utility: Laundry available inside the home; Laundry area in the garage
Neighborhood map
What this means for you Summary
Snapshot
- This is a 2-bed/2.0-bath manufactured listed at $185k.
Deal economics
- At list price, monthly cash flow is $310 ($4k/yr) — positive.
- The deal already cash-flows at list — no discount required.
- To meet the 1% rule (rent ≥ 1% of price), the offer needs to be $177k (4.4% below list).
- Recommended offer: $177k (4.4% below list) — sets the bar for 1% rule.
Location & tenants
- Location reads: area grade C — affects rentability + tenant quality, not the cash-flow math above.
- Glades (town): math 38% / reading 41% proficiency, ranked #63 of 73 in FL (top 86%) — families likely to look elsewhere, expect single-tenant / working-renter base with shorter leases.
- Market conditions: 942 active listings in the ZIP; 65 units permitted in Glades County in 2024 (0 in 5+ unit buildings).
- This rent runs 37% of the median local income ($57k/yr) — at the standard rent-burdened threshold; future hikes will face affordability resistance.
Forward outlook
- In year one you build about $20k of equity ($1k loan paydown + $18k appreciation (10.0% local appreciation)).
- Glades County population projected at +15% by 2050 — long-run rental-demand tailwind backs the buy-and-hold thesis.
- At projected returns (10.0% appreciation + 3.0% rent growth), your $52k cash investment doubles in ~3 years — after that, you're playing with house money.
- By year 2, paydown + projected appreciation supports a ~$32k cash-out refi (75% LTV) — recoverable capital for the next deal without selling this one.
Negotiation context
- It's been on market 32 days — a 3% lower offer ($179k) is reasonable based on typical stale-listing flexibility.
- 5 sale attempts since 2y ago with the ask held roughly flat each time — persistent listings suggest the price (not the market) is what's stuck; bring a comps-based counter.
- Current owner paid $43k; list at $185k implies a 330% gain — meaningful room to come down on a strong offer.
Risks & watch-outs
- Climate carrying-cost: severe wind risk, 99% chance of damaging wind over 30y; extreme-heat days projected 7→25/yr by 2055 (HVAC capex compounding) — expect insurance premiums to compound above CPI over the hold.
Questions for the listing agent
- It's been on market 32 days. Have you received any prior offers? Is the seller open to a 4% concession, seller financing, or rate buy-down credit?
- Is there a deadline driving the sale (1031 exchange, divorce, estate, relocation)? That informs how much negotiation room exists.
- What's the average days-on-market for RENTAL listings here right now (not sales)? A rising rental-DOM trend means longer vacancies and softer asking-rent achievability than the comps imply.
- What's the recent tenant-quality profile in this submarket — average credit score on applications, eviction rate, late-payment / NSF rate, and stable-employment percentage? A property-management company in the area should have these aggregated.
- How much new for-sale + rental construction is in the pipeline within 1–3 miles? Heavy new supply typically softens prices + rents 12–24 months out; constrained supply supports both.
Investment metrics
- 1% rule
- 0.96% ✗
- Cap rate
- 8.31%
- Cash-on-cash
- 7.19%
- DSCR
- 1.32
- GRM
- 8.7
CMA / ARV
No comps found within radius.
Projected returns pro-forma
10.0% appreciation · 3.0% rent growth · sell at horizon
- IRR
- 29.5%
- Equity multiple
- 3.32×
- Total profit
- $120,432
- Equity at exit
- $166,663
- IRR
- 25.6%
- Equity multiple
- 7.54×
- Total profit
- $338,927
- Equity at exit
- $359,414
Cash invested: $51,800 (down + closing). Projections, not guarantees.
Landlord ↔ Tenant lean methodology
- Overall (STATE)
- 87 Strongly Landlord-Friendly
- State Florida
- 87 Strongly Landlord-Friendly · R+3
- County
- — inherits STATE
- City
- — inherits STATE
ZIP-level market 33935
- Home prices YoY
- 16.3%
- Active inventory
- 942
- Price-to-rent
- 8.7×
Monthly cashflow live
- Estimated rent
- $1,769 medium interval (Pro) →
- Mortgage (P&I)
- −$970
- Tax from tax record
- −$40 /mo · $483/yr
- Insurance
- −$77
- HOA
- −$0
- Vacancy / Maint / Mgmt
- −$372
- Net cashflow
- $310
Break-even live
UW: 25.0% down · 7.5% · 30yr · 1.5% tax · 5.0% vac · 8.0% maint · 8.0% mgmt
Financing live
Cash to close
- Down payment
- $46,250
- Closing costs
- $5,550
- Reserves months
- —
- Total cash needed
- —
Loan-product check · same deal, 3 products live
Conventional
25% down · 7.5% · 30yr
- Down + closing
- —
- Monthly P&I
- —
- Monthly cashflow
- —
- DSCR
- —
- Eligible?
- —
Personal DTI + credit; lowest rate.
DSCR
20% down · 8.5% · 30yr
- Down + closing
- —
- Monthly P&I
- —
- Monthly cashflow
- —
- DSCR
- —
- Eligible?
- —
No personal income docs; deal must DSCR.
Hard money
10% down · 12.0% · 12mo
- Down + closing
- —
- Monthly P&I
- —
- Monthly cashflow
- —
- DSCR
- —
- Eligible?
- —
Short-term bridge; refi at stabilization.
Listing history 30 events
-
2026-06-19days on market $185,000 Active 32 DOM
-
2026-06-18days on market $185,000 Active 31 DOM
-
2026-06-17days on market $185,000 Active 30 DOM
-
2026-06-16days on market $185,000 Active 29 DOM
-
2026-06-15days on market $185,000 Active 28 DOM
-
2026-06-14days on market $185,000 Active 26 DOM
-
2026-06-12days on market $185,000 Active 25 DOM
-
2026-06-09days on market $185,000 Active 22 DOM
-
2026-06-08days on market $185,000 Active 21 DOM
-
2026-06-07days on market $185,000 Active 20 DOM
-
2026-06-07days on market $185,000 Active 19 DOM
-
2026-06-03days on market $185,000 Active 16 DOM
-
2026-06-02days on market $185,000 Active 15 DOM
-
2026-06-01days on market $185,000 Active 14 DOM
-
2026-05-31days on market $185,000 Active 13 DOM
-
2026-05-30days on market $185,000 Active 12 DOM
-
2026-05-18$185,000 Active
-
2026-01-23historical
-
2025-09-04$185,000 Active
-
2025-07-27historical
-
2025-06-12status Active
-
2025-06-03status Pending
-
2025-05-16price $180,000
-
2025-01-27$196,000 Active
-
2024-12-19historical
-
2024-08-19price $200,000
-
2024-07-22price $220,000
-
2024-05-29$250,000 Active
-
2007-03-12soldstatus $43,000
-
1991-01-01soldstatus $16,367
ⓘ Source: listings_history table (triggers on properties + properties_extension) + one-shot
backfill from property_details.listing_events for pre-trigger history.
Tax reassessment forecast FL · Resets to sale price
- Current annual tax
- $483 · $40/mo
- Projected year-2 tax
- $1,536 · $128/mo
- Expected delta
- +$1,052/yr (+$88/mo · 217.7%)
ⓘ Screening estimate from a state-policy table — verify with the county assessor before closing.
Climate risk First Street
- Flood 1/10 Low FEMA zone X (unshaded) · 0% chance over 30 yrs
- Wildfire 4/10 Moderate
- Heat 8/10 Severe 7 d/yr ≥108°F today · 25 d/yr by 30 yrs out
- Wind 10/10 Extreme 99% chance of damaging wind over 30 yrs
- Air quality 2/10 Low 1 unhealthy d/yr today · 1 by 30 yrs out
Nearby sold comps map
Loading sold comps map…
Walkable amenities ~0.75 mi
Loading nearby amenities…
Taxation est. · year 1
- Rental income
- $21,233
- − Mortgage interest
- −$10,363
- − Property taxes
- −$483
- − Insurance
- −$925
- − Repairs & maintenance
- −$1,699
- − Management
- −$1,699
- − Depreciation
- −$5,382
- Taxable income
- $683
- Est. tax owed @ 24.0%
- −$164
- After-tax cash flow
- $3,560/yr
For passive investors: Depreciation is non-cash, so a rental often shows a tax loss while cash-flowing — sheltering income. Rental losses are passive: they offset passive income freely, and up to $25,000/yr can offset ordinary (W-2) income if you actively participate and your MAGI is under $100k (phasing out to $0 by $150k); unused losses carry forward. On sale, claimed depreciation is recaptured at up to 25%, and gains may owe capital-gains tax (a 1031 exchange can defer both). Figures are a year-1 estimate at your 24.0% rate — not tax advice; consult a CPA.
Schools (NCES district)
- District
- Glades
- NCES district ID
- 1200660
- Math proficiency
- 38% ▼ -15.00%
- Reading proficiency
- 41% ▼ -5.00%
- Median HH income
- $36,758
- Composite
- 32.81/100
- National rank
- #5622
- State rank
- #63 of 73 in FL
Livability — Palmdale
No livability data for this city. (Only ~50 U.S. cities are tracked.)
Census & demographics
- County
- Hendry County · 23,186 people
- Metro
- Clewiston, FL
- Population (ZIP)
- 23,186
- Household income
- $57,009
- Rent vs Own
- Severe rent burden
- 498.0
Population outlook (Glades County) Hauer SSP2
- Today (2025)
- 14,901 people
- By 2030
- 15,463 · +3.8%
- By 2040
- 16,341 · +9.7%
- By 2050
- 17,158 · +15.1%
- By 2075
- 18,881 · +26.7%
- By 2100
- 19,164 · +28.6%
Race, ethnicity, and origin ACS 2023
- Neighborhood character
- Majority Hispanic (56%)
- Race & ethnicity
- Hispanic / Latino 56% White 39% Two or more races 21% Black 2% Native American 2%
- Hispanic origin (detail)
- Mexican 40% Puerto Rican 3% Cuban 5%
- Common ancestry
- Lithuanian 2% Serbian 2% Slovak 1%
- Foreign-born
- 27% · Canada, Jamaica
- Languages at home
- 50% English-only · Spanish 50%
Political lean MEDSL · Glades
- 2024 margin
- Solid R (+53.3) · D 23.1% · R 76.4%
- 2008→2024 swing
- -36.7pp toward R · 2008: -16.6pp · 2024: -53.3pp
- All cycles
- 2024: R+53.3 2020: R+46.2 2016: R+39.6 2012: R+18.6 2008: R+16.6
Not yet ingested
- Civics
- —
Market trends
- HPI YoY
- ▲ 75.20%
- Current HPI
- 537.4928
- Rent YoY
- —
- Metro
- Clewiston, FL
- State GDP YoY
- ▲ 3.28%
- F500 in state
- 36
Industry mix (Fortune 500 HQ in FL)
| Industry | F500 HQs | Revenue |
|---|---|---|
| Industrial Technology | 2 | $29B |
|
||
| Insurance | 2 | $17B |
|
||
| Retail | 1 | $60B |
|
||
| Technology Distribution | 1 | $58B |
|
||
| Homebuilding | 1 | $35B |
|
||
| Technology Manufacturing | 1 | $35B |
|
||
Price history
+1030.3% since first listed14 events — show timeline
- 2026-05-18 Listed $185,000 Beaches MLS
- 2026-01-23 Listing Removed — Beaches MLS
- 2025-09-04 Listed $185,000 Beaches MLS
- 2025-07-27 Listing Removed — Beaches MLS
- 2025-06-12 Relisted — Beaches MLS
- 2025-06-03 Pending — Beaches MLS
- 2025-05-16 Price Changed $180,000 Beaches MLS
- 2025-01-27 Listed $196,000 Beaches MLS
- 2024-12-19 Listing Removed — MARMLS
- 2024-08-19 Price Changed $200,000 MARMLS
- 2024-07-22 Price Changed $220,000 MARMLS
- 2024-05-29 Listed $250,000 MARMLS
- 2007-03-12 Sold (Public Records) $43,000 Public Records
- 1991-01-01 Sold (Public Records) $16,367 Public Records
Property tax history
+0.0%/yrLatest (2025): $483 · +2.6% YoY. Source: county tax records.
Cash-flow waterfall
monthlySold comps — $/sqft
last 12 mo · ≤1 miLoading sold comps…