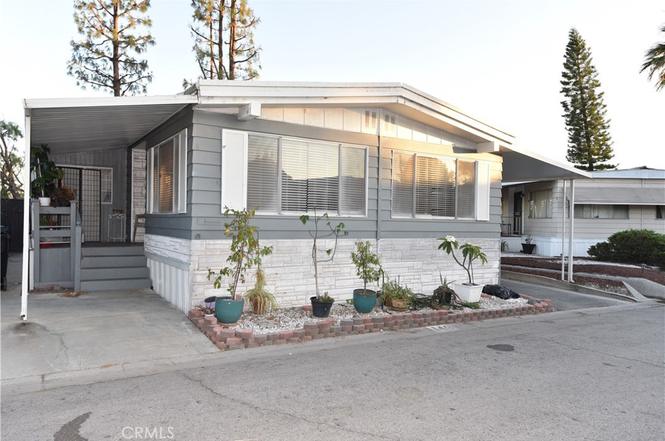
3033 E Valley #149 · West Covina, CA
Flood risk 1/10 · Minimal
- FEMA flood zone
- X (shaded)
- Chance of flooding over 30 yrs
- 0.0%
- Est. flood insurance / yr
- $507 – $1,088
Fire risk 1/10 · Minimal
- Est. fire insurance / yr
- $659 – $1,223
Heat risk 6/10 · Moderate
- Hot days now (above 99°F)
- 7 days/yr
- Hot days in 30 yrs
- 20 days/yr
Wind risk 1/10 · Minimal
- Chance of severe wind over 30 yrs
- —
Air-quality risk 7/10 · Major
- Unhealthy air days now
- 13 days/yr
- Unhealthy air days in 30 yrs
- 14 days/yr
Risk factors via First Street. Map © Google.
Why this score? — see what drove the B+ grade
The composite is a weighted blend of 9 inputs, each scored 0–100. Each bar is that input's sub-score; the figure is the points it added to the 100-point composite (weight × sub-score).
- Cash flow +30.0/30.0
- ARV discount +15.0/15.0
- 1% rule +10.0/10.0
- DSCR +10.0/10.0
- Schools +4.5/10.0
- Rent growth +3.8/5.0
- Livability +3.0/5.0
- Condition / age +2.5/5.0
- Appreciation +0.0/10.0
$139,000
🖨 Deal sheet (PDF) 📄 Offer letter ✓ Due diligence
Listing remarks MLS
ONE OF THE BEST PARKS IN THE SAN GABRIEL VALLEY. RIGHT NEXT TO WALNUT, ROWLAND HTS, CITY OF INDUSTRY. CLOSE TO METROLINK, FREEWAYS, AND COLLEGES. OVER 1500 SQ FT OF LIVING SPACE WITH POSSIBLE 3RD BEDROOM. ENCLOSED PATIO OFFERS MORE POSSIBILITY OF AN EXERCISE ROOM OR CRAFT'S ROOM. ONE YEAR OLD LAMINATED HARDWOOD FLOOR, NEW STOVE, AND NEW A/C UNIT.
Key facts
- Clubhouse
- Children's play area
- Swimming pool
Tags
Property features AI
Finance
- Other: Pets allowed with breed restrictions
- Financial info: Land lease amount: $1,218
- HOA & community: Part of an association; Community features include a dog park and community spa/pool; Park name: Friendly Village; Manager approval required; Land lease applies
Exterior
- Parking: Attached carport
- Utilities: Public sewer; District/public water
- Home design: Single-story mobile home; Mobile home remains on site; 12 ft by 64 ft mobile dimensions; Entry on main level
- Construction: Built by builder (year source listed as Builder); Fixer condition
- Exterior features: Front porch; Paved lot areas; Garden; Community pool
Interior
- Kitchen: Kitchen island
- Bedrooms: Entry level is on the main floor
- Bathrooms: 2 full bathrooms; Soaking tub and bathtub; Shower and shower-in-tub; Bathroom closet
- Heating & cooling: Central heating (furnace); Central air conditioning
- Interior features: One-level home; Front porch; Community spa
- Laundry & utility: Separate laundry room
Neighborhood map
What this means for you Summary
Snapshot
- This is a 3-bed/2.0-bath manufactured listed at $139k.
Deal economics
- At list price, monthly cash flow is $2k ($24k/yr) — positive.
- The deal already cash-flows at list — no discount required.
- Meets the 1% rule at list price ($4k rent vs $139k).
- Cap rate 23.5% vs local median 2.3% in West Covina — top-decile yield for the area; either an underpriced asset or a hidden risk that comps aren't pricing in. Stress-test before assuming the spread holds.
Location & tenants
- Location reads 59/100 on livability (#647 in CA) — a working-class tenant base; expect higher turnover. Strengths: commute A+, employment A+, health & safety A-; Watch: amenities F, cost of living F.
- Rowland Unified (suburban): math 40% / reading 62% proficiency, ranked #134 of 517 in CA (top 26%) — acceptable for families but not a draw, mixed tenant base, ~2y average lease.
- Zoned schools: Telesis Academy of Science & Math (635 students, 84% FRL); Nogales High (math 29% / reading 57%, grade F, #460 of 1,170 statewide, top 40%, 1,668 students, 82% FRL) — zoned schools average 83% FRL vs 56% district-wide (26 pts higher); higher-poverty schools than district average — tighter screening recommended.
- Market conditions: Rents rising fast (+5.2%/yr); 29 active listings in the ZIP; 19 comparable units currently listed for rent nearby; rentals at typical pace (median 19d on market — plan ~3-4 weeks tenant-placement turnaround); solid renter incomes; 19,697 units permitted in Los Angeles County in 2024 (9,426 in 5+ unit buildings).
- At $3,588/mo this rent would consume 45% of the median local household income ($95k/yr) (locally 1330% of renters already pay >50% of income on rent) — very limited rent-growth headroom before tenants either downsize or default.
Forward outlook
- Local home prices are declining (-3.0%/yr); year-one equity from $961 of loan paydown is wiped out by about $4k of value loss. Plan a longer hold.
- Los Angeles County population projected at +9% by 2050 — modest demand growth; plan on rents tracking national, not racing it.
- At projected returns (-3.0% appreciation + 5.2% rent growth), your $39k cash investment doubles in ~2 years — after that, you're playing with house money.
Negotiation context
- Only 2 days on market — expect competitive offers; lowballing is unlikely to land.
- Current owner paid $87k; list at $139k implies a 60% gain — meaningful room to come down on a strong offer.
Risks & watch-outs
- Climate carrying-cost: extreme-heat days projected 7→20/yr by 2055 (HVAC capex compounding) — expect insurance premiums to compound above CPI over the hold.
Questions for the listing agent
- Built in 1972 — when were the roof, HVAC, electrical panel, plumbing, and water heater last replaced?
- Is there a deadline driving the sale (1031 exchange, divorce, estate, relocation)? That informs how much negotiation room exists.
- Schools are B-rated — typically a magnet for longer-tenancy family renters. What's the average tenant stay here, and is there a school-zone premium baked into asking?
- What's the average days-on-market for RENTAL listings here right now (not sales)? A rising rental-DOM trend means longer vacancies and softer asking-rent achievability than the comps imply.
- What's the recent tenant-quality profile in this submarket — average credit score on applications, eviction rate, late-payment / NSF rate, and stable-employment percentage? A property-management company in the area should have these aggregated.
- How much new for-sale + rental construction is in the pipeline within 1–3 miles? Heavy new supply typically softens prices + rents 12–24 months out; constrained supply supports both.
Investment metrics
- 1% rule
- 2.58% ✓
- Cap rate
- 23.50%
- Cash-on-cash
- 61.44%
- DSCR
- 3.73
- GRM
- 3.2
CMA / ARV
- ARV (on-the-fly)
- $205,824
- Comps found
- 3
Show comp detail 3 sales within ~0.75 mi
| Address | Dist | Beds/Ba | Sqft | Sold | Price | $/sf | Match |
|---|---|---|---|---|---|---|---|
| 3033 E Valley #80 | 0.00mi | 3/2.0 | 1,440 (-6%) | 2mo | $165,000 | $115 | 88 |
| 3033 E Valley Blvd #89 | 0.05mi | 2/2.0 (-1) | 1,536 (0%) | 24mo | $206,000 | $134 | 73 |
| 3033 E Valley Blvd #34 | 0.00mi | 3/2.0 | 1,392 (-9%) | 15mo | $220,000 | $158 | 72 |
Match score weights: distance 35% · size 25% · config 20% · recency 20%. Top-matched comps best support the ARV.
Projected returns pro-forma
-3.0% appreciation · 5.15% rent growth · sell at horizon
- IRR
- 62.6%
- Equity multiple
- 3.89×
- Total profit
- $112,294
- Equity at exit
- $20,725
- IRR
- 67.8%
- Equity multiple
- 8.58×
- Total profit
- $295,120
- Equity at exit
- $12,018
Cash invested: $38,920 (down + closing). Projections, not guarantees.
Landlord ↔ Tenant lean methodology
- Overall (STATE)
- 18 Strongly Tenant-Friendly
- State California
- 18 Strongly Tenant-Friendly · D+13
- County
- — inherits STATE
- City
- — inherits STATE
ZIP-level market 91792
- Rents YoY
- 5.2%
- Active inventory
- 29
- Price-to-rent
- 3.2×
Monthly cashflow live
- Estimated rent
- $3,588 high interval (Pro) →
- Mortgage (P&I)
- −$729
- Tax from tax record
- −$55 /mo · $663/yr
- Insurance
- −$58
- HOA
- −$0
- Vacancy / Maint / Mgmt
- −$754
- Net cashflow
- $1,993
Break-even live
Sensitivity live
| Price | -10% $2,071 | -5% $2,032 | +0% $1,993 | +5% $1,953 | +10% $1,914 |
|---|---|---|---|---|---|
| Rent | -10% $1,709 | -5% $1,851 | +0% $1,993 | +5% $2,134 | +10% $2,276 |
| Rate | -1.0pp $2,063 | -0.5pp $2,028 | base $1,993 | +0.5pp $1,957 | +1.0pp $1,920 |
UW: 25.0% down · 7.5% · 30yr · 1.5% tax · 5.0% vac · 8.0% maint · 8.0% mgmt
Financing live
Cash to close
- Down payment
- $34,750
- Closing costs
- $4,170
- Reserves months
- —
- Total cash needed
- —
Loan-product check · same deal, 3 products live
Conventional
25% down · 7.5% · 30yr
- Down + closing
- —
- Monthly P&I
- —
- Monthly cashflow
- —
- DSCR
- —
- Eligible?
- —
Personal DTI + credit; lowest rate.
DSCR
20% down · 8.5% · 30yr
- Down + closing
- —
- Monthly P&I
- —
- Monthly cashflow
- —
- DSCR
- —
- Eligible?
- —
No personal income docs; deal must DSCR.
Hard money
10% down · 12.0% · 12mo
- Down + closing
- —
- Monthly P&I
- —
- Monthly cashflow
- —
- DSCR
- —
- Eligible?
- —
Short-term bridge; refi at stabilization.
Rent comps 19 comps
| Address | Beds | Baths | Sqft | Rent | $/sqft | DOM | Units | Dist |
|---|---|---|---|---|---|---|---|---|
| 2817 E Valley Blvd West Covina, CA | 3.0 | 2.0 | 1050 | $3,100 | $2.95 | 45d | 1 | 0.27mi |
| 4037 S Ellesford Ave West Covina, CA | 4.0 | 2.0 | 1790 | $4,195 | $2.34 | 0d | 1 | 0.44mi |
| 3532 Camino de Teodoro West Covina, CA | 4.0 | 2.0 | 1702 | $3,700 | $2.17 | 13d | 1 | 0.73mi |
| 3839 Mahogany St West Covina, CA | 3.0 | 2.5 | 1378 | $3,100 | $2.25 | 45d | 1 | 0.74mi |
| 1316 Raleo Ave Rowland Heights, CA | 4.0 | 2.0 | 1200 | $5,000 | $4.17 | 16d | 1 | 0.78mi |
| 19231 Tranbarger St Rowland Heights, CA | 3.0 | 2.0 | 1170 | $3,200 | $2.74 | 45d | 1 | 0.84mi |
| 1514 Cronin Dr Rowland Heights, CA | 4.0 | 3.0 | 1909 | $4,195 | $2.20 | 0d | 1 | 0.90mi |
| 278 Calle Luna Unit 278 Walnut, CA | 4.0 | 3.0 | 2000 | $4,200 | $2.10 | 45d | 1 | 0.91mi |
| 3520 S Gauntlet Dr West Covina, CA | 4.0 | 2.0 | 1326 | $3,600 | $2.71 | 45d | 1 | 0.99mi |
| 19178 Bel Air Dr Walnut, CA | 4.0 | 3.0 | 2139 | $4,400 | $2.06 | 5d | 1 | 0.99mi |
| 684 Panorama Ln La Puente, CA | 3.0 | 3.5 | 1683 | $3,600 | $2.14 | 19d | 1 | 1.08mi |
| 684 Panorama Ln La Puente, CA | 3.0 | 3.5 | 1683 | $3,600 | $2.14 | 22d | 1 | 1.08mi |
| 19319 Pilario St Rowland Heights, CA | 4.0 | 2.0 | 1480 | $3,750 | $2.53 | 45d | 1 | 1.22mi |
| 2316 Cravath Ct West Covina, CA | 3.0 | 2.0 | 1335 | $3,050 | $2.28 | 19d | 1 | 1.23mi |
| 335 Eola Dr Walnut, CA | 4.0 | 3.0 | 1996 | $3,695 | $1.85 | 3d | 1 | 1.32mi |
| 1862 Hollandale Ave Rowland Heights, CA | 4.0 | 2.0 | 1588 | $4,250 | $2.68 | 18d | 1 | 1.34mi |
| 18617 Trot Ave Rowland Heights, CA | 3.0 | 2.0 | 1251 | $3,350 | $2.68 | 19d | 1 | 1.39mi |
| 3424 S Rachel Ave West Covina, CA | 4.0 | 2.0 | 1445 | $3,500 | $2.42 | 8d | 1 | 1.41mi |
| 1809 Paso Real Ave Rowland Heights, CA | 4.0 | 2.0 | 1259 | $3,500 | $2.78 | 26d | 1 | 1.47mi |
Listing history 4 events
-
2026-06-21status $139,000 Active 2 DOM
-
2026-06-18days on market $139,000 Coming Soon 2 DOM
-
2026-06-17remarks 632-char remark
-
2026-06-17$139,000 Coming Soon 1 DOM
ⓘ Source: listings_history table (triggers on properties + properties_extension) + one-shot
backfill from property_details.listing_events for pre-trigger history.
Tax reassessment forecast CA · Resets to sale price
- Current annual tax
- $663 · $55/mo
- Projected year-2 tax
- $1,056 · $88/mo
- Expected delta
- +$393/yr (+$33/mo · 59.3%)
ⓘ Screening estimate from a state-policy table — verify with the county assessor before closing.
Climate risk First Street
- Flood 1/10 Low FEMA zone X (shaded) · 0% chance over 30 yrs
- Wildfire 1/10 Low
- Heat 6/10 Major 7 d/yr ≥99°F today · 20 d/yr by 30 yrs out
- Wind 1/10 Low
- Air quality 7/10 Severe 13 unhealthy d/yr today · 14 by 30 yrs out
Nearby sold comps map
Loading sold comps map…
Walkable amenities ~0.75 mi
Loading nearby amenities…
Taxation est. · year 1
- Rental income
- $43,058
- − Mortgage interest
- −$7,786
- − Property taxes
- −$663
- − Insurance
- −$695
- − Repairs & maintenance
- −$3,445
- − Management
- −$3,445
- − Depreciation
- −$4,044
- Taxable income
- $22,981
- Est. tax owed @ 24.0%
- −$5,515
- After-tax cash flow
- $18,395/yr
For passive investors: Depreciation is non-cash, so a rental often shows a tax loss while cash-flowing — sheltering income. Rental losses are passive: they offset passive income freely, and up to $25,000/yr can offset ordinary (W-2) income if you actively participate and your MAGI is under $100k (phasing out to $0 by $150k); unused losses carry forward. On sale, claimed depreciation is recaptured at up to 25%, and gains may owe capital-gains tax (a 1031 exchange can defer both). Figures are a year-1 estimate at your 24.0% rate — not tax advice; consult a CPA.
Schools (NCES district)
- District
- Rowland Unified
- NCES district ID
- 0633750
- Math proficiency
- 40% ▼ -1.00%
- Reading proficiency
- 62% ▲ 11.00%
- Median HH income
- $63,667
- Composite
- 44.83/100
- National rank
- #2733
- State rank
- #134 of 517 in CA
Livability — West Covina
- Score
- 59/100
- State rank
- #647
- US rank
- #20196
Category grades
Schools grade is shown separately in the Schools card above.
Census & demographics
- Census place
- West Covina, CA
- County
- Los Angeles County · 9,444,647 people
- City population
- 108,367
- Metro
- Los Angeles-Long Beach-Anaheim, CA
- Population (ZIP)
- 30,629
- Household income
- $94,817
- Rent vs Own
- Severe rent burden
- 1330.0
Population outlook (Los Angeles County) Hauer SSP2
- Today (2025)
- 10,940,515 people
- By 2030
- 11,256,481 · +2.9%
- By 2040
- 11,729,929 · +7.2%
- By 2050
- 11,948,407 · +9.2%
- By 2075
- 11,818,114 · +8.0%
- By 2100
- 10,842,928 · -0.9%
Race, ethnicity, and origin ACS 2023
- Neighborhood character
- Diverse neighborhood (Simpson 0.64)
- Race & ethnicity
- Hispanic / Latino 42% Asian 42% Two or more races 14% Black 7% White 6%
- Hispanic origin (detail)
- Mexican 35%
- Foreign-born
- 44% · Canada, China, Vietnam
- Languages at home
- 37% English-only · Spanish 28% Chinese 15% Tagalog/Filipino 14%
Political lean MEDSL · Los Angeles
- 2024 margin
- Solid D (+32.9) · D 64.8% · R 31.9% · Other 3.3%
- 2008→2024 swing
- -7.4pp toward R · 2008: 40.4pp · 2024: 32.9pp
- All cycles
- 2024: D+32.9 2020: D+44.2 2016: D+48.0 2012: D+40.0 2008: D+40.4
Not yet ingested
- Civics
- —
Market trends
- HPI YoY
- ▼ -662.61%
- Current HPI
- 420.1138
- Rent YoY
- ▲ 5.15%
- Metro
- Los Angeles-Long Beach-Anaheim, CA
- State GDP YoY
- ▲ 3.21%
- F500 in state
- 116
Industry mix (Fortune 500 HQ in CA)
| Industry | F500 HQs | Revenue |
|---|---|---|
| Technology | 27 | $1,492B |
|
||
| Financial Services | 3 | $174B |
|
||
| Retail | 3 | $44B |
|
||
| Insurance | 3 | $26B |
|
||
| Media / Entertainment | 2 | $115B |
|
||
| Pharmaceuticals / Biotech | 2 | $62B |
|
||
Price history
+56.2% since first listed3 events — show timeline
- 2026-06-16 Coming Soon $139,000 CRMLS
- 2006-03-14 Sold (MLS) $87,000 CRMLS
- 2006-01-05 Listed $89,000 CRMLS
Property tax history
+4.7%/yrLatest (2025): $663 · +4.7% YoY. Source: county tax records.
Cash-flow waterfall
monthlySold comps — $/sqft
last 12 mo · ≤1 miLoading sold comps…