 Multi-family
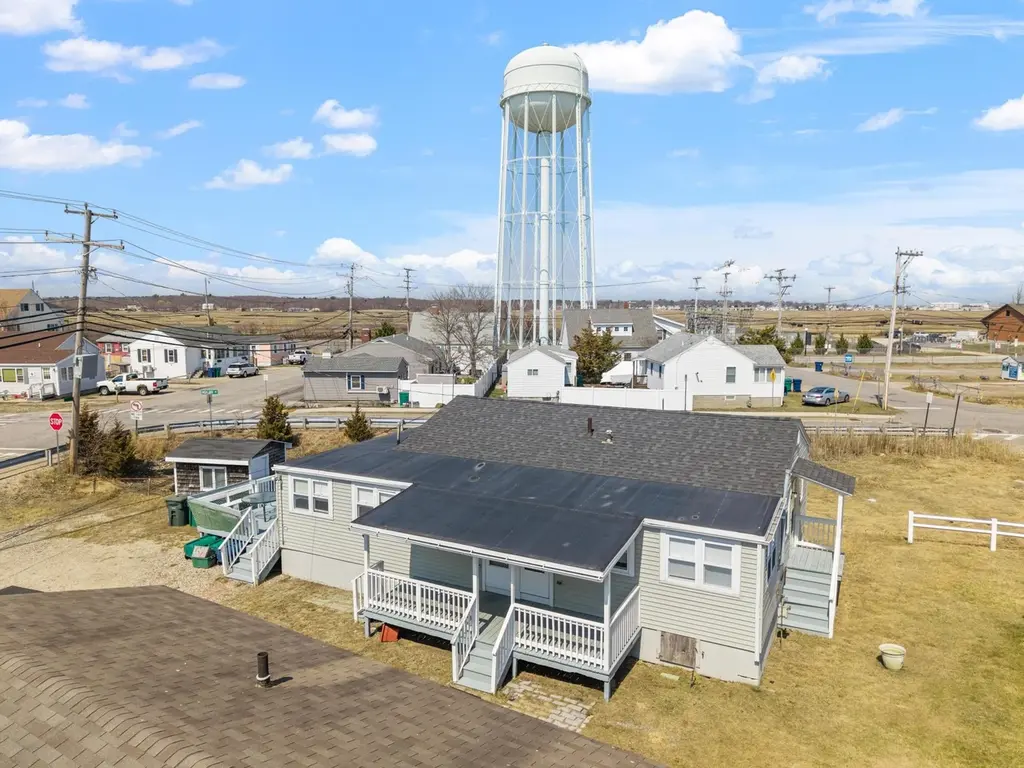
56 Nudd Ave · Hampton Beach, NH
Flood risk 10/10 · Severe
- FEMA flood zone
- AE
- Chance of flooding over 30 yrs
- 0.99%
- Est. flood insurance / yr
- $1,737 – $8,500
Fire risk 3/10 · Minor
- Est. fire insurance / yr
- $507 – $941
Heat risk 5/10 · Moderate
- Hot days now (above 92°F)
- 7 days/yr
- Hot days in 30 yrs
- 16 days/yr
Wind risk 6/10 · Moderate
- Chance of severe wind over 30 yrs
- 72.0%
Air-quality risk 2/10 · Minimal
- Unhealthy air days now
- 2 days/yr
- Unhealthy air days in 30 yrs
- 2 days/yr
Risk factors via First Street. Map © Google.
Why this score? — see what drove the B- grade
The composite is a weighted blend of 9 inputs, each scored 0–100. Each bar is that input's sub-score; the figure is the points it added to the 100-point composite (weight × sub-score).
- Cash flow +30.0/30.0
- DSCR +10.0/10.0
- 1% rule +8.6/10.0
- Schools +5.1/10.0
- Appreciation +5.0/10.0
- Livability +3.5/5.0
- Rent growth +2.5/5.0
- Condition / age +2.5/5.0
- ARV discount +1.5/15.0
$564,500
🖨 Deal sheet (PDF) 📄 Offer letter ✓ Due diligence
Multi-family units
County records classify this as Multi-Family (2-4 Unit). Listing-text estimate: 1 unit. estimate disagrees with records
Listing remarks
You could own this fantastic, prime location Hampton Beach Cottage by Summertime! Well maintained and lovingly owned by the same family for many decades. And, it's a DUPLEX with the sale including 2 adjacent lots which makes this a rare, special opportunity! Both units are over 700 sq ft each with 2 bedrooms & 1 bathroom. Side deck and back deck for outdoor fun or relaxation, some yard, large shed for storage. .. and plenty of parking - which is seasonally very coveted & a major bonus. So much opportunity with potential to expand the current footprint, build up, rebuild, convert to single family or year round use. BUT also, turn key, as is now, to begin making memories at your w
Key facts
- 2 adjacent lots
- Plenty of parking
- Side deck
Tags
Property features AI
Exterior
- Parking: Dirt driveway parking
- Utilities: Public water; Public sewer; Circuit breaker electrical service; Cable and telephone available; High-speed internet available
- Home design: Multi-family duplex / cottage style; Existing construction; Built in 1953
- Construction: Vinyl siding; Asphalt shingle roof; Crawl space foundation
- Exterior features: Level lot; Dirt driveway; Public road frontage
Interior
- Bedrooms: Two 2-bedroom units
- Bathrooms: Two full bathrooms (one in each unit)
- Heating & cooling: No central heating; Wall air conditioning units
- Interior features: Crawl space basement; Seasonal property
Neighborhood map
What this means for you Summary
Snapshot
- This is a 4-bed/2.0-bath multifamily listed at $564k.
Deal economics
- At list price, monthly cash flow is $2k ($23k/yr) — positive.
- The deal already cash-flows at list — no discount required.
- Meets the 1% rule at list price ($8k rent vs $564k).
- Recommended offer: $531k (6.0% below list) — sets the bar for market timing.
- Cap rate 11.2% vs local median 1.3% in Hampton Beach — top-decile yield for the area; either an underpriced asset or a hidden risk that comps aren't pricing in. Stress-test before assuming the spread holds.
Location & tenants
- Location reads 70/100 on livability (#48 in NH) — a middle-class / working-renter tenant base. Strengths: crime A+, health & safety A+, employment B+; Watch: amenities F, commute D-, cost of living F.
- Hampton School District (suburban): math 49% / reading 66% proficiency, ranked #19 of 98 in NH (top 19%) — acceptable for families but not a draw, mixed tenant base, ~2y average lease; only 15% free/reduced lunch — higher-income household profile.
- Zoned schools: Adeline C. Marston School (math 59% / reading 66%, grade B, #31 of 263 statewide, top 12%, 311 students, 15% FRL); Hampton Academy (math 41% / reading 66%, grade C+, #16 of 96 statewide, top 16%, 333 students, 16% FRL); Winnacunnet High School (math 43% / reading 63%, grade C-, #28 of 90 statewide, top 30%, 1,063 students, 17% FRL) — zoned schools at 16% FRL track the district average.
- Market conditions: 1 active listings in the ZIP; 2 comparable units currently listed for rent nearby; 1,276 units permitted in Rockingham County in 2024 (593 in 5+ unit buildings).
Forward outlook
- In year one you build about $21k of equity ($4k loan paydown + $17k appreciation (3.0% local appreciation)).
- At projected returns (3.0% appreciation + 3.0% rent growth), your $158k cash investment doubles in ~4 years — after that, you're playing with house money.
- By year 2, paydown + projected appreciation supports a ~$34k cash-out refi (75% LTV) — recoverable capital for the next deal without selling this one.
Negotiation context
- It's been on market 65 days — a 6% lower offer ($531k) is reasonable based on typical stale-listing flexibility.
Risks & watch-outs
- Watch-outs: flood insurance adds $427/mo; built in 1953 — expect roof / HVAC / electrical / plumbing capex.
- Climate carrying-cost: in FEMA flood zone AE (mandatory federal flood insurance); major wind risk, 72% chance of damaging wind over 30y; extreme-heat days projected 7→16/yr by 2055 (HVAC capex compounding) — expect insurance premiums to compound above CPI over the hold.
Questions for the listing agent
- It's been on market 65 days. Have you received any prior offers? Is the seller open to a 6% concession, seller financing, or rate buy-down credit?
- Built in 1953 — when were the roof, HVAC, electrical panel, plumbing, and water heater last replaced?
- What's the actual annual flood-insurance premium (NFIP or private), and is the property in a SFHA with mandatory coverage?
- Why hasn't it sold? Are there any deal-killer items the seller is aware of (foundation, flood, title, zoning, code violations)?
- Is there a deadline driving the sale (1031 exchange, divorce, estate, relocation)? That informs how much negotiation room exists.
- Schools are D-rated, which usually means shorter tenancies and higher turnover. Who's the typical renter profile here, and what's been the actual vacancy rate?
- What's the average days-on-market for RENTAL listings here right now (not sales)? A rising rental-DOM trend means longer vacancies and softer asking-rent achievability than the comps imply.
- What's the recent tenant-quality profile in this submarket — average credit score on applications, eviction rate, late-payment / NSF rate, and stable-employment percentage? A property-management company in the area should have these aggregated.
- How much new apartment / multifamily construction is in the pipeline within 1–3 miles? Heavy new supply (>2% of stock underway) typically softens rents 12–24 months out; light construction supports rent growth.
Investment metrics
- 1% rule
- 1.36% ✓
- Cap rate
- 11.19%
- Cash-on-cash
- 17.49%
- DSCR
- 1.78
- GRM
- 6.1
CMA / ARV
- ARV (on-the-fly)
- $497,760
- Comps found
- 2
Show comp detail 2 sales within ~0.75 mi
| Address | Dist | Beds/Ba | Sqft | Sold | Price | $/sf | Match |
|---|---|---|---|---|---|---|---|
| 14 Highland Ave | 0.16mi | 5/2.0 (+1) | 1,542 (+5%) | 18mo | $525,000 | $340 | 63 |
| 12 Highland Ave | 0.17mi | 5/3.0 (+1) | 1,636 (+12%) | 21mo | $550,000 | $336 | 46 |
Match score weights: distance 35% · size 25% · config 20% · recency 20%. Top-matched comps best support the ARV.
Projected returns pro-forma
3.0% appreciation · 3.0% rent growth · sell at horizon
- IRR
- 20.9%
- Equity multiple
- 2.19×
- Total profit
- $187,829
- Equity at exit
- $253,824
- IRR
- 22.0%
- Equity multiple
- 4.17×
- Total profit
- $501,636
- Equity at exit
- $391,173
Cash invested: $158,060 (down + closing). Projections, not guarantees.
Landlord ↔ Tenant lean methodology
- Overall (STATE)
- 56 Moderately Landlord-Leaning
- State New Hampshire
- 56 Moderately Landlord-Leaning · D+1
- County
- — inherits STATE
- City
- — inherits STATE
ZIP-level market 03942
- Active inventory
- 1
- Price-to-rent
- 12.2×
Monthly cashflow live
- Estimated rent
- $7,688 medium interval (Pro) →
- Mortgage (P&I)
- −$2,960
- Tax from tax record
- −$575 /mo · $6,897/yr
- Insurance
- −$235
- Flood insurance flood zone
- −$427 /mo · $5,118/yr
- HOA
- −$0
- Vacancy / Maint / Mgmt
- −$1,614
- Net cashflow
- $1,877
Break-even live
Sensitivity live
| Price | -10% $2,196 | -5% $2,036 | +0% $1,877 | +5% $1,717 | +10% $1,557 |
|---|---|---|---|---|---|
| Rent | -10% $1,269 | -5% $1,573 | +0% $1,877 | +5% $2,180 | +10% $2,484 |
| Rate | -1.0pp $2,161 | -0.5pp $2,020 | base $1,877 | +0.5pp $1,730 | +1.0pp $1,582 |
2-unit breakdown (identical units grouped — click to expand)
| Units | Beds | Baths | Est. rent |
|---|---|---|---|
| 2× units | 2 | 1 | $7,688 |
| #1 | 2 | 1 | $3,844 |
| #2 | 2 | 1 | $3,844 |
| Total (2 units) | $7,688 | ||
UW: 25.0% down · 7.5% · 30yr · 1.5% tax · 5.0% vac · 8.0% maint · 8.0% mgmt
Financing live
Cash to close
- Down payment
- $141,125
- Closing costs
- $16,935
- Reserves months
- —
- Total cash needed
- —
Loan-product check · same deal, 3 products live
Conventional
25% down · 7.5% · 30yr
- Down + closing
- —
- Monthly P&I
- —
- Monthly cashflow
- —
- DSCR
- —
- Eligible?
- —
Personal DTI + credit; lowest rate.
DSCR
20% down · 8.5% · 30yr
- Down + closing
- —
- Monthly P&I
- —
- Monthly cashflow
- —
- DSCR
- —
- Eligible?
- —
No personal income docs; deal must DSCR.
Hard money
10% down · 12.0% · 12mo
- Down + closing
- —
- Monthly P&I
- —
- Monthly cashflow
- —
- DSCR
- —
- Eligible?
- —
Short-term bridge; refi at stabilization.
Rent comps 2 comps
| Address | Beds | Baths | Sqft | Rent | $/sqft | DOM | Units | Dist |
|---|---|---|---|---|---|---|---|---|
| 9 Cole St Unit 2 Hampton, NH | 3.0 | 1.0 | 1000 | $2,200 | $2.20 | 26d | 1 | 0.28mi |
| 18 Acadia Ave Hampton, NH | 3.0 | 2.0 | 1800 | $3,800 | $2.11 | 22d | 1 | 1.08mi |
Listing history 16 events
-
2026-06-21days on market $564,500 Active 65 DOM
-
2026-06-18days on market $564,500 Active 62 DOM
-
2026-06-17days on market $564,500 Active 61 DOM
-
2026-06-16days on market $564,500 Active 60 DOM
-
2026-06-15days on market $564,500 Active 59 DOM
-
2026-06-13days on market $564,500 Active 57 DOM
-
2026-06-09days on market $564,500 Active 53 DOM
-
2026-06-08days on market $564,500 Active 52 DOM
-
2026-06-07days on market $564,500 Active 51 DOM
-
2026-06-04days on market $564,500 Active 48 DOM
-
2026-06-03days on market $564,500 Active 47 DOM
-
2026-06-02days on market $564,500 Active 46 DOM
-
2026-06-01days on market $564,500 Active 45 DOM
-
2026-05-31days on market $564,500 Active 44 DOM
-
2026-04-30price $564,500
-
2026-04-17$595,000 Active
ⓘ Source: listings_history table (triggers on properties + properties_extension) + one-shot
backfill from property_details.listing_events for pre-trigger history.
Tax reassessment forecast NH · Partial reset (capped growth)
- Current annual tax
- $6,897 · $575/mo
- Projected year-2 tax
- $9,602 · $800/mo
- Expected delta
- +$2,705/yr (+$225/mo · 39.2%)
ⓘ Screening estimate from a state-policy table — verify with the county assessor before closing.
Climate risk First Street
- Flood 10/10 Extreme FEMA zone AE · 99% chance over 30 yrs
- Wildfire 3/10 Moderate
- Heat 5/10 Major 7 d/yr ≥92°F today · 16 d/yr by 30 yrs out
- Wind 6/10 Major 72% chance of damaging wind over 30 yrs
- Air quality 2/10 Low 2 unhealthy d/yr today · 2 by 30 yrs out
Nearby sold comps map
Loading sold comps map…
Walkable amenities ~0.75 mi
Loading nearby amenities…
Taxation est. · year 1
- Rental income
- $92,256
- − Mortgage interest
- −$31,621
- − Property taxes
- −$6,897
- − Insurance
- −$7,941
- − Repairs & maintenance
- −$7,380
- − Management
- −$7,380
- − Depreciation
- −$16,422
- Taxable income
- $14,614
- Est. tax owed @ 24.0%
- −$3,507
- After-tax cash flow
- $19,013/yr
For passive investors: Depreciation is non-cash, so a rental often shows a tax loss while cash-flowing — sheltering income. Rental losses are passive: they offset passive income freely, and up to $25,000/yr can offset ordinary (W-2) income if you actively participate and your MAGI is under $100k (phasing out to $0 by $150k); unused losses carry forward. On sale, claimed depreciation is recaptured at up to 25%, and gains may owe capital-gains tax (a 1031 exchange can defer both). Figures are a year-1 estimate at your 24.0% rate — not tax advice; consult a CPA.
Schools (NCES district)
- District
- Hampton School District
- NCES district ID
- 3303510
- Math proficiency
- 49% ▼ -22.00%
- Reading proficiency
- 66% ▼ -9.00%
- Median HH income
- $71,924
- Composite
- 51.03/100
- National rank
- #1774
- State rank
- #19 of 98 in NH
Livability — Hampton Beach
- Score
- 70/100
- State rank
- #48
- US rank
- #8000
Category grades
Schools grade is shown separately in the Schools card above.
Census & demographics
- Census place
- Hampton Beach, NH
Population outlook (Rockingham County) Hauer SSP2
- Today (2025)
- 316,118 people
- By 2030
- 320,929 · +1.5%
- By 2040
- 323,358 · +2.3%
- By 2050
- 314,977 · -0.4%
- By 2075
- 297,686 · -5.8%
- By 2100
- 256,363 · -18.9%
Not yet ingested
- Political lean
- —
- Race & ethnicity
- —
- Common origin
- —
- Civics
- —
Market trends
- HPI YoY
- —
- Current HPI
- —
- Rent YoY
- —
- Metro
- —
- State GDP YoY
- —
- F500 in state
- 0
Price history
-5.1% since first listed2 events — show timeline
- 2026-04-30 Price Changed $564,500 PrimeMLS
- 2026-04-17 Listed $595,000 PrimeMLS
Property tax history
+4.1%/yrLatest (2024): $6,897 · +26.5% YoY. Source: county tax records.
Cash-flow waterfall
monthlySold comps — $/sqft
last 12 mo · ≤1 miLoading sold comps…