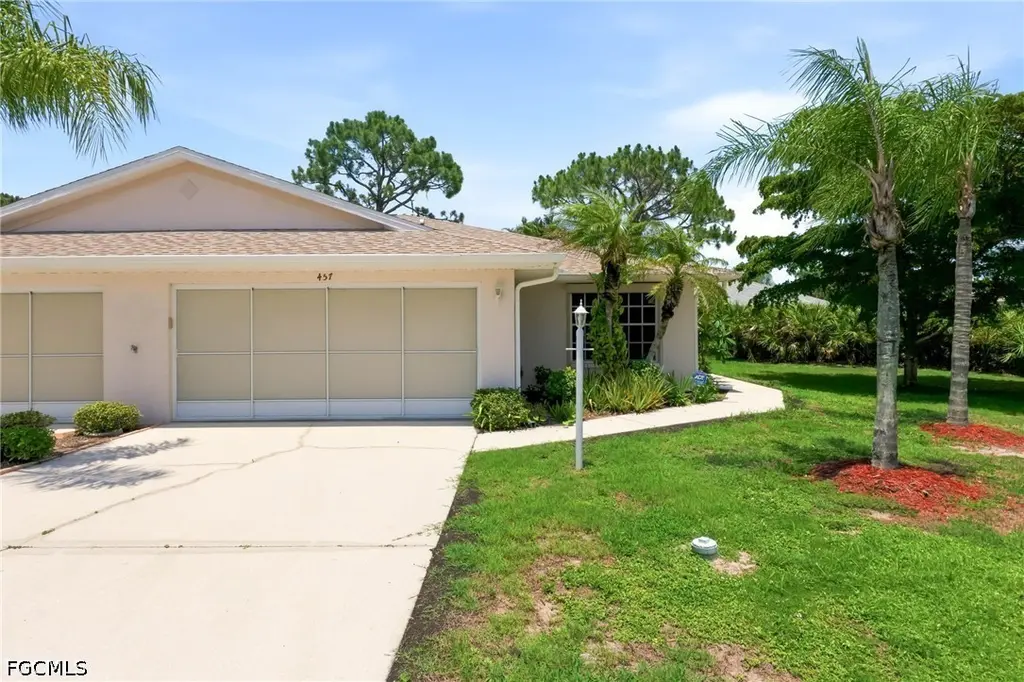
457 Bethany Village Cir · Lehigh Acres, FL
Flood risk No data
- FEMA flood zone
- —
- Chance of flooding over 30 yrs
- —
- Est. flood insurance / yr
- —
Fire risk No data
- Est. fire insurance / yr
- —
Heat risk No data
- Hot days now (above threshold)
- —
- Hot days in 30 yrs
- —
Wind risk No data
- Chance of severe wind over 30 yrs
- —
Air-quality risk No data
- Unhealthy air days now
- —
- Unhealthy air days in 30 yrs
- —
Risk factors via First Street. Map © Google.
Why this score? — see what drove the D grade
The composite is a weighted blend of 9 inputs, each scored 0–100. Each bar is that input's sub-score; the figure is the points it added to the 100-point composite (weight × sub-score).
- Cash flow +13.9/30.0
- ARV discount +7.5/15.0
- DSCR +4.2/10.0
- Schools +4.1/10.0
- 1% rule +4.0/10.0
- Livability +3.0/5.0
- Condition / age +2.5/5.0
- Rent growth +2.3/5.0
- Appreciation +0.0/10.0
$179,000
🖨 Deal sheet (PDF) 📄 Offer letter ✓ Due diligence
Listing remarks
Welcome to the gated community of Villages of Bethany Trace. This inviting villa is move in ready and offers a wonderful opportunity for buyers with vision perfect for creating a personalized space that feels truly your own. The thoughtfully designed layout features two spacious bedrooms, a versatile den (ideal for a home office, guest space, or hobby room), an open living and dining area, and a peaceful screened-in back patio for year-round enjoyment. A two-car garage with a paved driveway provides plenty of parking and storage. What truly makes this villa stand out in Bethany Trace is its spacious side yard and private wooded backyard a rare combination that delivers extra outdoor room an
Key facts
- Community pool
- Spacious side yard
- Walking paths
Tags
Property features AI
Finance
- Other: Lot is rectangular with dimensions approximately 60 x 61 x 32 x 42; Located on a private, privately maintained paved road; Zoning: RPD; Irrigation included in assessment
- Financial info: Pets allowed
- HOA & community: Homeowners association with quarterly fee of $495; Association covers cable TV, internet, insurance, pest control, road maintenance, sewer, street lights, trash and water; Community amenities include pool and sidewalks; 80 units in the community
Exterior
- Parking: Attached 2-car garage; Driveway; Paved access; Garage door opener; Two covered spaces
- Security: Smoke detector(s); Gated community; Street lights
- Utilities: Cable available; High-speed internet available; Sewer assessment paid; Water assessment paid
- Home design: Single-story; Entry level 1; Resale property; Faces southwest; Northeast exposure on lot
- Construction: Block, concrete and stucco construction; Shingle roof; Built on foundation
- Exterior features: Sprinkler/irrigation (automatic); Patio; Lanai; Porch (screened); Shutters (electric and manual); Community pool
Interior
- Kitchen: Double oven; Electric cooktop; Self-cleaning oven; Dishwasher; Disposal; Refrigerator; Freezer; Pantry; Breakfast bar; Eat-in kitchen
- Bedrooms: Den; Screened porch
- Flooring: Tile
- Bathrooms: 2 full bathrooms
- Heating & cooling: Central heating (electric); Central air conditioning; Ceiling fans
- Interior features: Attic; Breakfast bar; Built-in features; Breakfast area; Closet cabinetry; Cathedral ceilings; Entrance foyer; Eat-in kitchen; Family/dining room; Living/dining room; Pantry; Pull-down attic stairs; Shower only; Separate shower; Cable TV; Bar; Walk-in closets; Split bedrooms; Tinted windows; Unfurnished
- Laundry & utility: Washer hookup; Dryer hookup; Washer included; Dryer included
Neighborhood map
What this means for you Summary
Snapshot
- This is a 2-bed/2.0-bath condo listed at $179k.
Deal economics
- At list price, monthly cash flow is $20 ($246/yr) — positive.
- The deal already cash-flows at list — no discount required.
- To meet the 1% rule (rent ≥ 1% of price), the offer needs to be $161k (9.9% below list).
- Recommended offer: $161k (9.9% below list) — sets the bar for 1% rule.
- Cap rate 6.4% vs local median 4.7% in Lehigh Acres — top-decile yield for the area; either an underpriced asset or a hidden risk that comps aren't pricing in. Stress-test before assuming the spread holds.
Location & tenants
- Location reads 59/100 on livability (#826 in FL) — a working-class tenant base; expect higher turnover. Strengths: cost of living A+, housing A+; Watch: crime C-, employment D+, amenities F.
- Lee (suburban): math 47% / reading 50% proficiency, ranked #42 of 73 in FL (top 58%) — families likely to look elsewhere, expect single-tenant / working-renter base with shorter leases.
- Zoned schools: Veterans Park Academy For The Arts (math 41% / reading 45%, grade F, #1,366 of 2,144 statewide, top 64%, 2,133 students, 36% FRL); Oak Hammock Middle School (math 43% / reading 41%, grade D-, #340 of 571 statewide, top 61%, 1,563 students, 56% FRL); Lehigh Senior High School (math 23% / reading 45%, grade F, #394 of 667 statewide, top 60%, 2,476 students, 57% FRL).
- Market conditions: Rents soft (-0.8%/yr); 644 active listings in the ZIP; 40 comparable units currently listed for rent nearby; rentals at typical pace (median 21d on market — plan ~3-4 weeks tenant-placement turnaround); 15,411 units permitted in Lee County in 2024 (4,686 in 5+ unit buildings).
- This rent runs 38% of the median local income ($51k/yr) — at the standard rent-burdened threshold; future hikes will face affordability resistance.
Forward outlook
- Local home prices are declining (-3.0%/yr); year-one equity from $1k of loan paydown is wiped out by about $5k of value loss. Plan a longer hold.
- Lee County population projected at +44% by 2050 — long-run rental-demand tailwind backs the buy-and-hold thesis.
Negotiation context
- Only 3 days on market — expect competitive offers; lowballing is unlikely to land.
- Current owner paid $116k; list at $179k implies a 54% gain — meaningful room to come down on a strong offer.
Questions for the listing agent
- What does the HOA fee cover, when was the last increase, and are there any pending special assessments or reserve-fund shortfalls?
- Any open or pending special assessments — roof, HVAC, plumbing, elevator, façade? What's the per-unit balance and payoff schedule, and is the seller paying it off at close or rolling it to the buyer?
- Is there a deadline driving the sale (1031 exchange, divorce, estate, relocation)? That informs how much negotiation room exists.
- Schools are D-rated, which usually means shorter tenancies and higher turnover. Who's the typical renter profile here, and what's been the actual vacancy rate?
- The area grade is low — what's the realistic commute time and amenity access for the typical tenant pool here? Any planned neighborhood developments (good or bad) we should know about?
- What's the average days-on-market for RENTAL listings here right now (not sales)? A rising rental-DOM trend means longer vacancies and softer asking-rent achievability than the comps imply.
- What's the recent tenant-quality profile in this submarket — average credit score on applications, eviction rate, late-payment / NSF rate, and stable-employment percentage? A property-management company in the area should have these aggregated.
- How much new apartment / multifamily construction is in the pipeline within 1–3 miles? Heavy new supply (>2% of stock underway) typically softens rents 12–24 months out; light construction supports rent growth.
Investment metrics
- 1% rule
- 0.90% ✗
- Cap rate
- 6.43%
- Cash-on-cash
- 0.49%
- DSCR
- 1.02
- GRM
- 9.2
CMA / ARV
No comps found within radius.
Projected returns pro-forma
-3.0% appreciation · 0.0% rent growth · sell at horizon
- IRR
- -19.0%
- Equity multiple
- 0.35×
- Total profit
- $-32,396
- Equity at exit
- $26,689
- IRR
- -19.4%
- Equity multiple
- 0.11×
- Total profit
- $-44,662
- Equity at exit
- $15,477
Cash invested: $50,120 (down + closing). Projections, not guarantees.
Landlord ↔ Tenant lean methodology
- Overall (STATE)
- 87 Strongly Landlord-Friendly
- State Florida
- 87 Strongly Landlord-Friendly · R+3
- County
- — inherits STATE
- City
- — inherits STATE
ZIP-level market 33936
- Home prices YoY
- -19.9%
- Rents YoY
- -0.8%
- Active inventory
- 644
- Price-to-rent
- 9.2×
Monthly cashflow live
- Estimated rent
- $1,613 high interval (Pro) →
- Mortgage (P&I)
- −$939
- Tax from tax record
- −$76 /mo · $910/yr
- Insurance
- −$75
- HOA
- −$165
- Vacancy / Maint / Mgmt
- −$339
- Net cashflow
- $20
Break-even live
Sensitivity live
| Price | -10% $122 | -5% $71 | +0% $20 | +5% $-30 | +10% $-81 |
|---|---|---|---|---|---|
| Rent | -10% $-107 | -5% $-43 | +0% $20 | +5% $84 | +10% $148 |
| Rate | -1.0pp $111 | -0.5pp $66 | base $20 | +0.5pp $-26 | +1.0pp $-73 |
UW: 25.0% down · 7.5% · 30yr · 1.5% tax · 5.0% vac · 8.0% maint · 8.0% mgmt
Financing live
Cash to close
- Down payment
- $44,750
- Closing costs
- $5,370
- Reserves months
- —
- Total cash needed
- —
Loan-product check · same deal, 3 products live
Conventional
25% down · 7.5% · 30yr
- Down + closing
- —
- Monthly P&I
- —
- Monthly cashflow
- —
- DSCR
- —
- Eligible?
- —
Personal DTI + credit; lowest rate.
DSCR
20% down · 8.5% · 30yr
- Down + closing
- —
- Monthly P&I
- —
- Monthly cashflow
- —
- DSCR
- —
- Eligible?
- —
No personal income docs; deal must DSCR.
Hard money
10% down · 12.0% · 12mo
- Down + closing
- —
- Monthly P&I
- —
- Monthly cashflow
- —
- DSCR
- —
- Eligible?
- —
Short-term bridge; refi at stabilization.
Rent comps 40 comps
| Address | Beds | Baths | Sqft | Rent | $/sqft | DOM | Units | Dist |
|---|---|---|---|---|---|---|---|---|
| 202 Eaglesmere Dr Lehigh Acres, FL | 3.0 | 2.0 | 1443 | $1,600 | $1.11 | 5d | 1 | 0.52mi |
| 202 Eaglesmere Dr Lehigh Acres, FL | 3.0 | 2.0 | 1443 | $1,695 | $1.17 | 25d | 1 | 0.52mi |
| 222 Ground Dove Cir Lehigh Acres, FL | 3.0 | 2.0 | 1417 | $1,695 | $1.20 | 12d | 1 | 0.62mi |
| 127 Highview Ave Lehigh Acres, FL | 3.0 | 2.0 | 1495 | $1,860 | $1.24 | 5d | 1 | 0.65mi |
| 351 Ranchito Ave Lehigh Acres, FL | 3.0 | 2.5 | 1500 | $2,000 | $1.33 | 25d | 1 | 0.65mi |
| 217 Jayview Ave Lehigh Acres, FL | 3.0 | 2.0 | 1491 | $1,600 | $1.07 | 16d | 1 | 0.70mi |
| 20055 Lake Vista Cir N Lehigh Acres, FL | 3.0 | 2.0 | 1442 | $1,700 | $1.18 | 25d | 1 | 0.77mi |
| 448 Reading St Lehigh Acres, FL | 3.0 | 2.0 | 1100 | $1,890 | $1.72 | 5d | 1 | 0.78mi |
| 374 Compese Ave S Lehigh Acres, FL | 3.0 | 2.0 | 1200 | $1,750 | $1.46 | 17d | 1 | 0.80mi |
| 10738 Cocoatree Ct Lehigh Acres, FL | 3.0 | 2.0 | 1220 | $1,600 | $1.31 | 3d | 1 | 0.82mi |
| 19949 Lake Vista Cir N #1 Lehigh Acres, FL | 3.0 | 2.0 | 1442 | $1,800 | $1.25 | 25d | 1 | 0.84mi |
| 19480 Poppytree Ct Lehigh Acres, FL | 3.0 | 2.0 | 1334 | $1,750 | $1.31 | 25d | 1 | 0.87mi |
| 397 Carrillon Ave S Lehigh Acres, FL | 3.0 | 2.0 | 1200 | $1,550 | $1.29 | 5d | 1 | 0.94mi |
| 201 Fireside Ct Unit N/A Lehigh Acres, FL | 2.0 | 2.0 | 1370 | $1,675 | $1.22 | 4d | 1 | 0.95mi |
| 201 Fireside Ct Lehigh Acres, FL | 2.0 | 2.0 | 1370 | $1,550 | $1.13 | 4d | 1 | 0.95mi |
| 718 Sunrise Blvd Lehigh Acres, FL | 3.0 | 2.0 | 1100 | $1,610 | $1.46 | 25d | 1 | 0.97mi |
| 6 Aztec Lily Ln Lehigh Acres, FL | 2.0 | 2.0 | 853 | $1,500 | $1.76 | 21d | 1 | 0.97mi |
| 6 Aztec Lily Ln Lehigh Acres, FL | 2.0 | 2.0 | 853 | $2,600 | $3.05 | 25d | 1 | 0.97mi |
| 713 Cardinal St E Lehigh Acres, FL | 3.0 | 2.0 | 1100 | $1,635 | $1.49 | 5d | 1 | 0.98mi |
| 10625 Windsmont Ct Lehigh Acres, FL | 3.0 | 2.0 | 1080 | $1,350 | $1.25 | 25d | 1 | 1.05mi |
| 10525 Putnam Ct Lehigh Acres, FL | 2.0 | 2.0 | 1014 | $1,250 | $1.23 | 21d | 1 | 1.07mi |
| 463 Piedmont St Unit 463 Lehigh Acres, FL | 3.0 | 2.0 | 1200 | $1,350 | $1.12 | 5d | 1 | 1.09mi |
| 3 Desert Candle Cir Lehigh Acres, FL | 2.0 | 2.0 | 853 | $1,200 | $1.41 | 25d | 1 | 1.09mi |
| 10578 Quincy Ct Unit 1 Lehigh Acres, FL | 2.0 | 2.0 | 899 | $1,275 | $1.42 | 25d | 1 | 1.10mi |
| 448 Grant Blvd Unit 1 Lehigh Acres, FL | 2.0 | 2.0 | 1244 | $1,595 | $1.28 | 3d | 1 | 1.12mi |
| 448 Grant Blvd Unit 1 Lehigh Acres, FL | 3.0 | 2.0 | 1244 | $1,650 | $1.33 | 23d | 1 | 1.12mi |
| 448 Grant Blvd Unit 1 Lehigh Acres, FL | 2.0 | 2.0 | 1244 | $1,595 | $1.28 | 3d | 1 | 1.12mi |
| 10554 Quincy Ct Lehigh Acres, FL | 2.0 | 2.0 | 1004 | $1,300 | $1.29 | 20d | 1 | 1.12mi |
| 442 Grant Blvd Lehigh Acres, FL | 3.0 | 2.0 | 1199 | $1,625 | $1.36 | 15d | 1 | 1.13mi |
| 404 Chalet Ave S Lehigh Acres, FL | 3.0 | 2.0 | 1200 | $1,850 | $1.54 | 25d | 1 | 1.14mi |
| 424 Cactus Cir Lehigh Acres, FL | 3.0 | 2.0 | 1173 | $1,495 | $1.27 | 17d | 1 | 1.14mi |
| 106 Leeland Heights Blvd W Lehigh Acres, FL | 1.0 | 1.0 | 794 | $1,450 | $1.83 | 25d | 1 | 1.14mi |
| 406 Chalet Ave S Lehigh Acres, FL | 3.0 | 2.0 | 1200 | $1,850 | $1.54 | 25d | 1 | 1.14mi |
| 46 Hamlin Ct Lehigh Acres, FL | 2.0 | 2.0 | 812 | $1,050 | $1.29 | 25d | 1 | 1.18mi |
| 44 Tangelo Ct Lehigh Acres, FL | 2.0 | 2.0 | 812 | $1,150 | $1.42 | 5d | 1 | 1.19mi |
| 10 Tangerine Ct Lehigh Acres, FL | 2.0 | 2.0 | 812 | $1,200 | $1.48 | 20d | 1 | 1.19mi |
| 47 Tangelo Ct Lehigh Acres, FL | 2.0 | 2.0 | 812 | $1,150 | $1.42 | 25d | 1 | 1.19mi |
| 9 Hamlin Ct Lehigh Acres, FL | 1.0 | 1.5 | 807 | $950 | $1.18 | 5d | 1 | 1.21mi |
| 110 Texas Rd Lehigh Acres, FL | 3.0 | 1.0 | 1118 | $1,750 | $1.57 | 17d | 1 | 1.23mi |
| 759 Cane St E Lehigh Acres, FL | 3.0 | 2.0 | 1169 | $1,950 | $1.67 | 5d | 1 | 1.26mi |
HOA detail condo
- Monthly dues
- $165 · $1,980/yr
- Likely covers
- security
- Assessments
- None detected in remarks — confirm with the listing agent.
Listing history 3 events
-
2026-06-22days on market $179,000 Active 3 DOM
-
2026-06-18remarks 699-char remark
-
2026-06-18$179,000 Active 1 DOM
ⓘ Source: listings_history table (triggers on properties + properties_extension) + one-shot
backfill from property_details.listing_events for pre-trigger history.
Tax reassessment forecast FL · Resets to sale price
- Current annual tax
- $910 · $76/mo
- Projected year-2 tax
- $1,486 · $124/mo
- Expected delta
- +$576/yr (+$48/mo · 63.3%)
ⓘ Screening estimate from a state-policy table — verify with the county assessor before closing.
Nearby sold comps map
Loading sold comps map…
Walkable amenities ~0.75 mi
Loading nearby amenities…
Taxation est. · year 1
- Rental income
- $19,360
- − Mortgage interest
- −$10,027
- − Property taxes
- −$910
- − Insurance
- −$895
- − Repairs & maintenance
- −$1,549
- − Management
- −$1,549
- − HOA
- −$1,980
- − Depreciation
- −$5,207
- Taxable loss
- −$2,756
- Est. tax savings @ 24.0%
- +$661
- After-tax cash flow
- $907/yr
For passive investors: Depreciation is non-cash, so a rental often shows a tax loss while cash-flowing — sheltering income. Rental losses are passive: they offset passive income freely, and up to $25,000/yr can offset ordinary (W-2) income if you actively participate and your MAGI is under $100k (phasing out to $0 by $150k); unused losses carry forward. On sale, claimed depreciation is recaptured at up to 25%, and gains may owe capital-gains tax (a 1031 exchange can defer both). Figures are a year-1 estimate at your 24.0% rate — not tax advice; consult a CPA.
Schools (NCES district)
- District
- Lee
- NCES district ID
- 1201080
- Math proficiency
- 47% ▼ -11.00%
- Reading proficiency
- 50% ▼ -4.00%
- Median HH income
- $49,518
- Composite
- 41.49/100
- National rank
- #3458
- State rank
- #42 of 73 in FL
Livability — Lehigh Acres
- Score
- 59/100
- State rank
- #826
- US rank
- #20055
Category grades
Schools grade is shown separately in the Schools card above.
Census & demographics
- Census place
- Lehigh Acres, FL
- County
- Lee County · 788,662 people
- City population
- 130,638
- Metro
- Cape Coral-Fort Myers, FL
- Population (ZIP)
- 27,967
- Household income
- $51,417
- Rent vs Own
- Severe rent burden
- 1027.0
Population outlook (Lee County) Hauer SSP2
- Today (2025)
- 871,946 people
- By 2030
- 955,468 · +9.6%
- By 2040
- 1,113,587 · +27.7%
- By 2050
- 1,256,891 · +44.1%
- By 2075
- 1,560,270 · +78.9%
- By 2100
- 1,726,848 · +98.0%
Race, ethnicity, and origin ACS 2023
- Neighborhood character
- Diverse neighborhood (Simpson 0.63)
- Race & ethnicity
- Hispanic / Latino 44% White 41% Two or more races 21% Black 9% Asian 1%
- Hispanic origin (detail)
- Mexican 7% Puerto Rican 9% Cuban 18% Dominican 2%
- Common ancestry
- Hispanic 3% Romanian 2% Lithuanian 1%
- Foreign-born
- 28% · Canada, Jamaica
- Languages at home
- 59% English-only · Spanish 36% French/Haitian/Cajun 3% Tagalog/Filipino 1%
Political lean MEDSL · Lee
- 2024 margin
- Strong R (+28.4) · D 35.5% · R 63.9%
- 2008→2024 swing
- -18.0pp toward R · 2008: -10.4pp · 2024: -28.4pp
- All cycles
- 2024: R+28.4 2020: R+19.2 2016: R+20.4 2012: R+16.6 2008: R+10.4
Not yet ingested
- Civics
- —
Market trends
- HPI YoY
- ▼ -86.78%
- Current HPI
- 348.8631
- Rent YoY
- ▼ -0.77%
- Metro
- Cape Coral-Fort Myers, FL
- State GDP YoY
- ▲ 3.28%
- F500 in state
- 36
Industry mix (Fortune 500 HQ in FL)
| Industry | F500 HQs | Revenue |
|---|---|---|
| Industrial Technology | 2 | $29B |
|
||
| Insurance | 2 | $17B |
|
||
| Retail | 1 | $60B |
|
||
| Technology Distribution | 1 | $58B |
|
||
| Homebuilding | 1 | $35B |
|
||
| Technology Manufacturing | 1 | $35B |
|
||
Price history
-66.3% since first listed3 events — show timeline
- 2026-06-18 Listed $179,000 FORTMLS
- 2002-11-23 Sold (Public Records) $116,500 Public Records
- 1996-11-01 Sold (Public Records) $531,400 Public Records
Property tax history
+5.9%/yrLatest (2025): $910 · +9.7% YoY. Source: county tax records.
Cash-flow waterfall
monthlySold comps — $/sqft
last 12 mo · ≤1 miLoading sold comps…