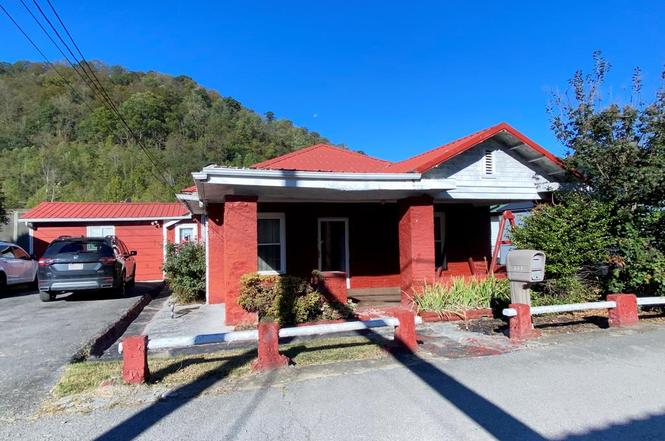
233 Parkway Dr · Williamson, WV
Flood risk 1/10 · Minimal
- FEMA flood zone
- X
- Chance of flooding over 30 yrs
- 0.0%
- Est. flood insurance / yr
- $507 – $1,088
Fire risk 5/10 · Moderate
- Est. fire insurance / yr
- $787 – $1,461
Heat risk 5/10 · Moderate
- Hot days now (above 103°F)
- 7 days/yr
- Hot days in 30 yrs
- 21 days/yr
Wind risk 2/10 · Minimal
- Chance of severe wind over 30 yrs
- 1.0%
Air-quality risk 1/10 · Minimal
- Unhealthy air days now
- 0 days/yr
- Unhealthy air days in 30 yrs
- 0 days/yr
Risk factors via First Street. Map © Google.
Why this score? — see what drove the B grade
The composite is a weighted blend of 9 inputs, each scored 0–100. Each bar is that input's sub-score; the figure is the points it added to the 100-point composite (weight × sub-score).
- Cash flow +30.0/30.0
- 1% rule +10.0/10.0
- DSCR +10.0/10.0
- ARV discount +7.5/15.0
- Appreciation +6.4/10.0
- Livability +3.0/5.0
- Rent growth +2.5/5.0
- Condition / age +2.5/5.0
- Schools +2.3/10.0
$55,000
🖨 Deal sheet (PDF) 📄 Offer letter ✓ Due diligence
Listing remarks
Charming 3 Bedroom / 2 Bath brick home in a great West Williamson location! Situated within walking distance of Southern West Virginia Community College and the Williamson Community Center, and within 3/4 mile of the Trail 10 Connector of the Buffalo Mountain Hatfield McCoy ATV Trail. Enjoy being just minutes from Williamson K–8 School, recreational fields, and the pickleball and basketball courts. . Inside, you'll find three nice-sized bedrooms plus a versatile office that could serve as a fourth bedroom. A cozy living area with a fireplace. . Kitchen/ Dining area, Laundry Area. Nice Back Yard
Key facts
- Recreational fields
- Laundry area
- Versatile office
Tags
Property features AI
Exterior
- Parking: Asphalt parking
- Utilities: Public water; Public sewer
- Home design: Residential single-family home
- Construction: Brick and wood siding construction; Metal roof
- Exterior features: Deck
Interior
- Flooring: Carpet flooring; Vinyl flooring
- Heating & cooling: Electric heating; Heat pump; Central air conditioning; Ceiling fans
- Interior features: Insulated windows; 7 total rooms
Neighborhood map
What this means for you Summary
Snapshot
- This is a 3-bed/1.0-bath single-family listed at $55k.
Deal economics
- At list price, monthly cash flow is $464 ($6k/yr) — positive.
- The deal already cash-flows at list — no discount required.
- Meets the 1% rule at list price ($1k rent vs $55k).
- Recommended offer: $48k (12.0% below list) — sets the bar for market timing.
Location & tenants
- Location reads 59/100 on livability (#228 in WV) — a working-class tenant base; expect higher turnover. Strengths: crime A+, cost of living A+; Watch: amenities F, commute F, employment F.
- Mingo County Schools (rural): math 21% / reading 36% proficiency, ranked #42 of 55 in WV (top 76%) — low school quality limits family demand, transient renter base, plan for 1-2y turnover.
- Zoned schools: Williamson Pk8 (math 26% / reading 41%, grade F, #189 of 377 statewide, top 50%, 527 students, 0% FRL); Mingo Central Comprehensive High School (math 12% / reading 32%, grade F, #97 of 110 statewide, top 90%, 635 students, 0% FRL) — zoned schools average 0% FRL vs 55% district-wide (55 pts lower); this property's tenant base skews higher-income than the district average.
- Market conditions: 19 active listings in the ZIP.
Forward outlook
- In year one you build about $2k of equity ($380 loan paydown + $2k appreciation (2.7% local appreciation)).
- Mingo County population projected at -37% by 2050 — secular population decline; favor cash flow + early exit over multi-decade hold.
- At projected returns (2.7% appreciation + 3.0% rent growth), your $15k cash investment doubles in ~3 years — after that, you're playing with house money.
Negotiation context
- It's been on market 178 days — a 12% lower offer ($48k) is reasonable based on typical stale-listing flexibility.
- 4 sale attempts; this cycle's ask has dropped $15k (21%) from the opening price — seller is motivated, your offer sets the floor, not the list.
Risks & watch-outs
- Watch-outs: built in 1922 — expect roof / HVAC / electrical / plumbing capex.
- Climate carrying-cost: moderate wildfire risk; extreme-heat days projected 7→21/yr by 2055 (HVAC capex compounding) — expect insurance premiums to compound above CPI over the hold.
Questions for the listing agent
- It's been on market 178 days. Have you received any prior offers? Is the seller open to a 12% concession, seller financing, or rate buy-down credit?
- Built in 1922 — when were the roof, HVAC, electrical panel, plumbing, and water heater last replaced?
- Why hasn't it sold? Are there any deal-killer items the seller is aware of (foundation, flood, title, zoning, code violations)?
- Is there a deadline driving the sale (1031 exchange, divorce, estate, relocation)? That informs how much negotiation room exists.
- Schools are F-rated, which usually means shorter tenancies and higher turnover. Who's the typical renter profile here, and what's been the actual vacancy rate?
- What's the average days-on-market for RENTAL listings here right now (not sales)? A rising rental-DOM trend means longer vacancies and softer asking-rent achievability than the comps imply.
- What's the recent tenant-quality profile in this submarket — average credit score on applications, eviction rate, late-payment / NSF rate, and stable-employment percentage? A property-management company in the area should have these aggregated.
- How much new for-sale + rental construction is in the pipeline within 1–3 miles? Heavy new supply typically softens prices + rents 12–24 months out; constrained supply supports both.
Investment metrics
- 1% rule
- 1.94% ✓
- Cap rate
- 16.43%
- Cash-on-cash
- 36.19%
- DSCR
- 2.61
- GRM
- 4.3
CMA / ARV
- ARV (on-the-fly)
- $114,810
- Comps found
- 2
Show comp detail 2 sales within ~0.75 mi
| Address | Dist | Beds/Ba | Sqft | Sold | Price | $/sf | Match |
|---|---|---|---|---|---|---|---|
| 1503 W 4th Ave | 0.14mi | 2/1.0 (-1) | 1,260 (-2%) | 3mo | $110,000 | $87 | 82 |
| 14 South Sunset Blvd | 0.37mi | 3/1.0 | 1,128 (-13%) | 7mo | $100,000 | $89 | 56 |
Match score weights: distance 35% · size 25% · config 20% · recency 20%. Top-matched comps best support the ARV.
Projected returns pro-forma
2.73% appreciation · 3.0% rent growth · sell at horizon
- IRR
- 41.4%
- Equity multiple
- 3.30×
- Total profit
- $35,446
- Equity at exit
- $23,908
- IRR
- 41.6%
- Equity multiple
- 6.57×
- Total profit
- $85,736
- Equity at exit
- $36,219
Cash invested: $15,400 (down + closing). Projections, not guarantees.
Landlord ↔ Tenant lean methodology
- Overall (STATE)
- 83 Strongly Landlord-Friendly
- State West Virginia
- 83 Strongly Landlord-Friendly · R+22
- County
- — inherits STATE
- City
- — inherits STATE
ZIP-level market 25661
- Home prices YoY
- 2.1%
- Active inventory
- 19
- Price-to-rent
- 4.3×
Monthly cashflow live
- Estimated rent
- $1,069 medium interval (Pro) →
- Mortgage (P&I)
- −$288
- Tax est. 1.5%
- −$69 /mo · $825/yr
- Insurance
- −$23
- HOA
- −$0
- Vacancy / Maint / Mgmt
- −$224
- Net cashflow
- $464
Break-even live
Sensitivity live
| Price | -10% $502 | -5% $483 | +0% $464 | +5% $445 | +10% $426 |
|---|---|---|---|---|---|
| Rent | -10% $380 | -5% $422 | +0% $464 | +5% $507 | +10% $549 |
| Rate | -1.0pp $492 | -0.5pp $478 | base $464 | +0.5pp $450 | +1.0pp $436 |
UW: 25.0% down · 7.5% · 30yr · 1.5% tax · 5.0% vac · 8.0% maint · 8.0% mgmt
Financing live
Cash to close
- Down payment
- $13,750
- Closing costs
- $1,650
- Reserves months
- —
- Total cash needed
- —
Loan-product check · same deal, 3 products live
Conventional
25% down · 7.5% · 30yr
- Down + closing
- —
- Monthly P&I
- —
- Monthly cashflow
- —
- DSCR
- —
- Eligible?
- —
Personal DTI + credit; lowest rate.
DSCR
20% down · 8.5% · 30yr
- Down + closing
- —
- Monthly P&I
- —
- Monthly cashflow
- —
- DSCR
- —
- Eligible?
- —
No personal income docs; deal must DSCR.
Hard money
10% down · 12.0% · 12mo
- Down + closing
- —
- Monthly P&I
- —
- Monthly cashflow
- —
- DSCR
- —
- Eligible?
- —
Short-term bridge; refi at stabilization.
Listing history 26 events
-
2026-06-21days on market $55,000 Active 178 DOM
-
2026-06-21days on market $55,000 Active 177 DOM
-
2026-06-18days on market $55,000 Active 175 DOM
-
2026-06-17days on market $55,000 Active 174 DOM
-
2026-06-16days on market $55,000 Active 173 DOM
-
2026-06-15days on market $55,000 Active 172 DOM
-
2026-06-15days on market $55,000 Active 171 DOM
-
2026-06-13days on market $55,000 Active 170 DOM
-
2026-06-12days on market $55,000 Active 169 DOM
-
2026-06-09days on market $55,000 Active 166 DOM
-
2026-06-08days on market $55,000 Active 165 DOM
-
2026-06-08days on market $55,000 Active 164 DOM
-
2026-06-07days on market $55,000 Active 163 DOM
-
2026-06-04days on market $55,000 Active 161 DOM
-
2026-06-03days on market $55,000 Active 160 DOM
-
2026-06-02days on market $55,000 Active 159 DOM
-
2026-06-01days on market $55,000 Active 158 DOM
-
2026-05-31days on market $55,000 Active 157 DOM
-
2026-04-14status Active
-
2026-03-04status Active
-
2026-02-20status Pending
-
2026-02-11status Active
-
2026-01-22status Pending
-
2025-12-30price $55,000
-
2025-11-20price $62,000
-
2025-10-13$70,000 Active
ⓘ Source: listings_history table (triggers on properties + properties_extension) + one-shot
backfill from property_details.listing_events for pre-trigger history.
Climate risk First Street
- Flood 1/10 Low FEMA zone X · 0% chance over 30 yrs
- Wildfire 5/10 Major
- Heat 5/10 Major 7 d/yr ≥103°F today · 21 d/yr by 30 yrs out
- Wind 2/10 Low 100% chance of damaging wind over 30 yrs
- Air quality 1/10 Low 0 unhealthy d/yr today · 0 by 30 yrs out
Nearby sold comps map
Loading sold comps map…
Walkable amenities ~0.75 mi
Loading nearby amenities…
Taxation est. · year 1
- Rental income
- $12,828
- − Mortgage interest
- −$3,081
- − Property taxes
- −$825
- − Insurance
- −$275
- − Repairs & maintenance
- −$1,026
- − Management
- −$1,026
- − Depreciation
- −$1,600
- Taxable income
- $4,994
- Est. tax owed @ 24.0%
- −$1,199
- After-tax cash flow
- $4,374/yr
For passive investors: Depreciation is non-cash, so a rental often shows a tax loss while cash-flowing — sheltering income. Rental losses are passive: they offset passive income freely, and up to $25,000/yr can offset ordinary (W-2) income if you actively participate and your MAGI is under $100k (phasing out to $0 by $150k); unused losses carry forward. On sale, claimed depreciation is recaptured at up to 25%, and gains may owe capital-gains tax (a 1031 exchange can defer both). Figures are a year-1 estimate at your 24.0% rate — not tax advice; consult a CPA.
Schools (NCES district)
- District
- Mingo County Schools
- NCES district ID
- 5400900
- Math proficiency
- 21% ▼ -14.00%
- Reading proficiency
- 36% ▼ -6.00%
- Median HH income
- $32,574
- Composite
- 23.24/100
- National rank
- #7937
- State rank
- #42 of 55 in WV
Livability — Williamson
- Score
- 59/100
- State rank
- #228
- US rank
- #19971
Category grades
Schools grade is shown separately in the Schools card above.
Census & demographics
- Census place
- Williamson, WV
- Population (ZIP)
- 4,485
Population outlook (Mingo County) Hauer SSP2
- Today (2025)
- 21,874 people
- By 2030
- 20,048 · -8.3%
- By 2040
- 16,653 · -23.9%
- By 2050
- 13,842 · -36.7%
- By 2075
- 8,629 · -60.6%
- By 2100
- 5,142 · -76.5%
Race, ethnicity, and origin ACS 2023
- Neighborhood character
- Predominantly White (88%)
- Race & ethnicity
- White 88% Two or more races 6% Black 6%
- Common ancestry
- Serbian 2% Lithuanian 1%
- Foreign-born
- 1%
- Languages at home
- 99% English-only · German/W. Germanic 1%
Political lean MEDSL · Mingo
- 2024 margin
- Solid R (+73.8) · D 12.5% · R 86.3% · Other 1.2%
- 2008→2024 swing
- -61.7pp toward R · 2008: -12.1pp · 2024: -73.8pp
- All cycles
- 2024: R+73.8 2020: R+71.3 2016: R+68.8 2012: R+42.5 2008: R+12.1
Not yet ingested
- Civics
- —
Market trends
- HPI YoY
- ▲ 2.73%
- Current HPI
- 134.3708
- Rent YoY
- —
- Metro
- —
- State GDP YoY
- —
- F500 in state
- 0
Price history
-21.4% since first listed8 events — show timeline
- 2026-04-14 Relisted — EKAR
- 2026-03-04 Relisted — EKAR
- 2026-02-20 Pending — EKAR
- 2026-02-11 Relisted — EKAR
- 2026-01-22 Pending — EKAR
- 2025-12-30 Price Changed $55,000 EKAR
- 2025-11-20 Price Changed $62,000 EKAR
- 2025-10-13 Listed $70,000 EKAR
Property tax history
+3.8%/yrLatest (2025): $100 · -1.1% YoY. Source: county tax records.
Cash-flow waterfall
monthlySold comps — $/sqft
last 12 mo · ≤1 miLoading sold comps…