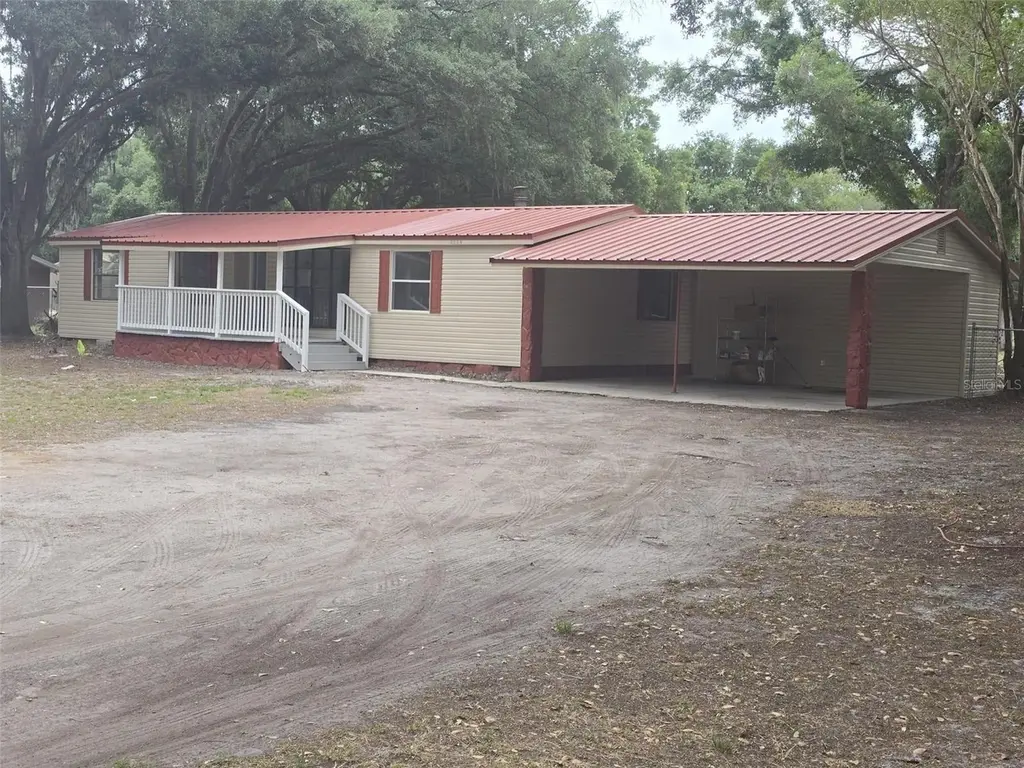
8009 Franklin Rd · Thonotosassa, FL
Flood risk 1/10 · Minimal
- FEMA flood zone
- X (unshaded)
- Chance of flooding over 30 yrs
- 0.0%
- Est. flood insurance / yr
- $507 – $1,088
Fire risk 4/10 · Minor
- Est. fire insurance / yr
- $947 – $1,759
Heat risk 9/10 · Severe
- Hot days now (above 110°F)
- 7 days/yr
- Hot days in 30 yrs
- 25 days/yr
Wind risk 9/10 · Severe
- Chance of severe wind over 30 yrs
- 99.0%
Air-quality risk 2/10 · Minimal
- Unhealthy air days now
- 2 days/yr
- Unhealthy air days in 30 yrs
- 2 days/yr
Risk factors via First Street. Map © Google.
Why this score? — see what drove the D grade
The composite is a weighted blend of 9 inputs, each scored 0–100. Each bar is that input's sub-score; the figure is the points it added to the 100-point composite (weight × sub-score).
- Cash flow +15.3/30.0
- ARV discount +7.5/15.0
- DSCR +4.7/10.0
- Schools +4.2/10.0
- Livability +3.2/5.0
- 1% rule +3.0/10.0
- Rent growth +2.5/5.0
- Condition / age +2.5/5.0
- Appreciation +0.0/10.0
$299,000
🖨 Deal sheet (PDF) 📄 Offer letter ✓ Due diligence
Listing remarks
Discover Your New Home in Plant City! Located at 8009 Franklin Rd, this charming property sitting on 1.08 acres for those looking for a cozy place to settle down. With its convenient location, everything you need is within reach. Near your new home, you’ll find: Quality schools: for families, with nearby educational options Grocery stores and shops: Easy access to multiple options for your daily needs Hospitals and healthcare centers: Medical care just minutes away, ensuring your well-being and that of your family Parks and recreational areas: Perfect spaces to enjoy the outdoors Don’t miss the opportunity to make this house your home.
Key facts
- 1.08 acre lot
- 2 parking spots
- Built 1984
Property features AI
Finance
- Other: Approximately 1.01 acres lot size
- Financial info: Annual tax noted (see listing for details)
- HOA & community: No association; Pets allowed
Exterior
- Parking: Carport with 2 spaces
- Utilities: Well water; Septic system; Electricity available; Water service available
- Home design: Manufactured double-wide home; Single-story; Faces north; Completed condition
- Construction: Metal siding; Vinyl siding; Metal roof; Block foundation; Built as a double wide
- Exterior features: Other exterior features; Asphalt road access
Interior
- Kitchen: Convection oven; Microwave; Refrigerator
- Bedrooms: 4 bedrooms
- Flooring: Carpet
- Bathrooms: 2 full bathrooms
- Heating & cooling: Central heating; Central air conditioning
- Interior features: Other interior features
- Laundry & utility: Indoor laundry
Neighborhood map
What this means for you Summary
Snapshot
- This is a 3-bed/2.0-bath manufactured listed at $299k.
Deal economics
- At list price, monthly cash flow is $108 ($1k/yr) — positive.
- The deal already cash-flows at list — no discount required.
- To meet the 1% rule (rent ≥ 1% of price), the offer needs to be $239k (20.0% below list).
- Recommended offer: $239k (20.0% below list) — sets the bar for 1% rule.
Location & tenants
- Location reads 64/100 on livability (#673 in FL) — a middle-class / working-renter tenant base. Strengths: cost of living A+, housing A+, crime B; Watch: amenities F, commute F, employment D-.
- Hillsborough (suburban): math 47% / reading 50% proficiency, ranked #41 of 73 in FL (top 56%) — families likely to look elsewhere, expect single-tenant / working-renter base with shorter leases.
- Zoned schools: Bailey Elementary School (math 49% / reading 43%, grade D-, #1,234 of 2,144 statewide, top 58%, 741 students, 66% FRL); Marshall Middle Magnet School (math 28% / reading 31%, grade F, #469 of 571 statewide, top 84%, 1,089 students, 69% FRL); Strawberry Crest High School (math 49% / reading 55%, grade D+, #160 of 667 statewide, top 25%, 2,558 students, 44% FRL).
- Market conditions: 323 active listings in the ZIP; 1 comparable units currently listed for rent nearby; 9,053 units permitted in Hillsborough County in 2024 (4,555 in 5+ unit buildings).
- This rent runs 39% of the median local income ($73k/yr) — at the standard rent-burdened threshold; future hikes will face affordability resistance.
Forward outlook
- Local home prices are declining (-3.0%/yr); year-one equity from $2k of loan paydown is wiped out by about $9k of value loss. Plan a longer hold.
- Hillsborough County population projected at +37% by 2050 — long-run rental-demand tailwind backs the buy-and-hold thesis.
Negotiation context
- Only 3 days on market — expect competitive offers; lowballing is unlikely to land.
- 2 sale attempts with the ask held roughly flat each time — persistent listings suggest the price (not the market) is what's stuck; bring a comps-based counter.
- Current owner paid $120k; list at $299k implies a 149% gain — meaningful room to come down on a strong offer.
Risks & watch-outs
- Climate carrying-cost: severe wind risk, 99% chance of damaging wind over 30y; extreme-heat days projected 7→25/yr by 2055 (HVAC capex compounding) — expect insurance premiums to compound above CPI over the hold.
Questions for the listing agent
- Is there a deadline driving the sale (1031 exchange, divorce, estate, relocation)? That informs how much negotiation room exists.
- Schools are D-rated, which usually means shorter tenancies and higher turnover. Who's the typical renter profile here, and what's been the actual vacancy rate?
- The area grade is low — what's the realistic commute time and amenity access for the typical tenant pool here? Any planned neighborhood developments (good or bad) we should know about?
- What's the average days-on-market for RENTAL listings here right now (not sales)? A rising rental-DOM trend means longer vacancies and softer asking-rent achievability than the comps imply.
- What's the recent tenant-quality profile in this submarket — average credit score on applications, eviction rate, late-payment / NSF rate, and stable-employment percentage? A property-management company in the area should have these aggregated.
- How much new for-sale + rental construction is in the pipeline within 1–3 miles? Heavy new supply typically softens prices + rents 12–24 months out; constrained supply supports both.
Investment metrics
- 1% rule
- 0.80% ✗
- Cap rate
- 6.73%
- Cash-on-cash
- 1.55%
- DSCR
- 1.07
- GRM
- 10.4
CMA / ARV
No comps found within radius.
Projected returns pro-forma
-3.0% appreciation · 3.0% rent growth · sell at horizon
- IRR
- -13.9%
- Equity multiple
- 0.50×
- Total profit
- $-41,689
- Equity at exit
- $44,582
- IRR
- -5.1%
- Equity multiple
- 0.67×
- Total profit
- $-27,980
- Equity at exit
- $25,852
Cash invested: $83,720 (down + closing). Projections, not guarantees.
Landlord ↔ Tenant lean methodology
- Overall (STATE)
- 87 Strongly Landlord-Friendly
- State Florida
- 87 Strongly Landlord-Friendly · R+3
- County
- — inherits STATE
- City
- — inherits STATE
ZIP-level market 33565
- Home prices YoY
- -24.7%
- Active inventory
- 323
- Price-to-rent
- 10.4×
Monthly cashflow live
- Estimated rent
- $2,392 medium interval (Pro) →
- Mortgage (P&I)
- −$1,568
- Tax from tax record
- −$89 /mo · $1,068/yr
- Insurance
- −$125
- HOA
- −$0
- Vacancy / Maint / Mgmt
- −$502
- Net cashflow
- $108
Break-even live
Sensitivity live
| Price | -10% $278 | -5% $193 | +0% $108 | +5% $24 | +10% $-61 |
|---|---|---|---|---|---|
| Rent | -10% $-81 | -5% $14 | +0% $108 | +5% $203 | +10% $297 |
| Rate | -1.0pp $259 | -0.5pp $184 | base $108 | +0.5pp $31 | +1.0pp $-48 |
UW: 25.0% down · 7.5% · 30yr · 1.5% tax · 5.0% vac · 8.0% maint · 8.0% mgmt
Financing live
Cash to close
- Down payment
- $74,750
- Closing costs
- $8,970
- Reserves months
- —
- Total cash needed
- —
Loan-product check · same deal, 3 products live
Conventional
25% down · 7.5% · 30yr
- Down + closing
- —
- Monthly P&I
- —
- Monthly cashflow
- —
- DSCR
- —
- Eligible?
- —
Personal DTI + credit; lowest rate.
DSCR
20% down · 8.5% · 30yr
- Down + closing
- —
- Monthly P&I
- —
- Monthly cashflow
- —
- DSCR
- —
- Eligible?
- —
No personal income docs; deal must DSCR.
Hard money
10% down · 12.0% · 12mo
- Down + closing
- —
- Monthly P&I
- —
- Monthly cashflow
- —
- DSCR
- —
- Eligible?
- —
Short-term bridge; refi at stabilization.
Rent comps 1 comps
| Address | Beds | Baths | Sqft | Rent | $/sqft | DOM | Units | Dist |
|---|---|---|---|---|---|---|---|---|
| 7503 Shorter Rd Plant City, FL | 3.0 | 2.0 | 1226 | $2,400 | $1.96 | 26d | 1 | 0.75mi |
Listing history 8 events
-
2026-05-20status Pending
-
2026-05-20status Active
-
2026-05-19status Pending
-
2026-05-18soldstatus Closed
-
2026-05-07status Pending
-
2026-05-04$299,000 Active
-
2025-12-18soldstatus $120,000
-
2002-02-18soldstatus $115,500
ⓘ Source: listings_history table (triggers on properties + properties_extension) + one-shot
backfill from property_details.listing_events for pre-trigger history.
Tax reassessment forecast FL · Resets to sale price
- Current annual tax
- $1,068 · $89/mo
- Projected year-2 tax
- $2,482 · $207/mo
- Expected delta
- +$1,413/yr (+$118/mo · 132.3%)
ⓘ Screening estimate from a state-policy table — verify with the county assessor before closing.
Climate risk First Street
- Flood 1/10 Low FEMA zone X (unshaded) · 0% chance over 30 yrs
- Wildfire 4/10 Moderate
- Heat 9/10 Extreme 7 d/yr ≥110°F today · 25 d/yr by 30 yrs out
- Wind 9/10 Extreme 99% chance of damaging wind over 30 yrs
- Air quality 2/10 Low 2 unhealthy d/yr today · 2 by 30 yrs out
Nearby sold comps map
Loading sold comps map…
Walkable amenities ~0.75 mi
Loading nearby amenities…
Taxation est. · year 1
- Rental income
- $28,708
- − Mortgage interest
- −$16,749
- − Property taxes
- −$1,068
- − Insurance
- −$1,495
- − Repairs & maintenance
- −$2,297
- − Management
- −$2,297
- − Depreciation
- −$8,698
- Taxable loss
- −$3,895
- Est. tax savings @ 24.0%
- +$935
- After-tax cash flow
- $2,235/yr
For passive investors: Depreciation is non-cash, so a rental often shows a tax loss while cash-flowing — sheltering income. Rental losses are passive: they offset passive income freely, and up to $25,000/yr can offset ordinary (W-2) income if you actively participate and your MAGI is under $100k (phasing out to $0 by $150k); unused losses carry forward. On sale, claimed depreciation is recaptured at up to 25%, and gains may owe capital-gains tax (a 1031 exchange can defer both). Figures are a year-1 estimate at your 24.0% rate — not tax advice; consult a CPA.
Schools (NCES district)
- District
- Hillsborough
- NCES district ID
- 1200870
- Math proficiency
- 47% ▼ -8.00%
- Reading proficiency
- 50% ▼ -4.00%
- Median HH income
- $50,622
- Composite
- 41.6/100
- National rank
- #3435
- State rank
- #41 of 73 in FL
Livability — Thonotosassa
- Score
- 64/100
- State rank
- #673
- US rank
- #13914
Category grades
Schools grade is shown separately in the Schools card above.
Census & demographics
- County
- Hillsborough County · 1,540,968 people
- City population
- 12,333
- Metro
- Tampa-St. Petersburg-Clearwater, FL
- Population (ZIP)
- 18,108
- Household income
- $73,414
- Rent vs Own
- Severe rent burden
- 152.0
Population outlook (Hillsborough County) Hauer SSP2
- Today (2025)
- 1,607,022 people
- By 2030
- 1,733,968 · +7.9%
- By 2040
- 1,979,565 · +23.2%
- By 2050
- 2,203,427 · +37.1%
- By 2075
- 2,667,893 · +66.0%
- By 2100
- 2,891,558 · +79.9%
Race, ethnicity, and origin ACS 2023
- Neighborhood character
- Predominantly White (71%)
- Race & ethnicity
- White 71% Hispanic / Latino 23% Two or more races 14% Black 2% Native American 1%
- Hispanic origin (detail)
- Mexican 16% Puerto Rican 2% Cuban 1%
- Common ancestry
- Romanian 2% Slovak 1% Iranian 1%
- Foreign-born
- 10% · Canada, Jamaica
- Languages at home
- 80% English-only · Spanish 19%
Political lean MEDSL · Hillsborough
- 2024 margin
- Toss-up / Even · D 47.8% · R 50.9% · Other 1.3%
- 2008→2024 swing
- -10.2pp toward R · 2008: 7.1pp · 2024: -3.1pp
- All cycles
- 2024: R+3.1 2020: D+6.9 2016: D+6.8 2012: D+6.7 2008: D+7.1
Not yet ingested
- Civics
- —
Market trends
- HPI YoY
- ▼ -114.17%
- Current HPI
- 347.2475
- Rent YoY
- —
- Metro
- Tampa-St. Petersburg-Clearwater, FL
- State GDP YoY
- ▲ 3.28%
- F500 in state
- 36
Industry mix (Fortune 500 HQ in FL)
| Industry | F500 HQs | Revenue |
|---|---|---|
| Industrial Technology | 2 | $29B |
|
||
| Insurance | 2 | $17B |
|
||
| Retail | 1 | $60B |
|
||
| Technology Distribution | 1 | $58B |
|
||
| Homebuilding | 1 | $35B |
|
||
| Technology Manufacturing | 1 | $35B |
|
||
Price history
+158.9% since first listed8 events — show timeline
- 2026-05-20 Pending — Stellar MLS as Distributed by MLS Grid
- 2026-05-20 Relisted — Stellar MLS as Distributed by MLS Grid
- 2026-05-19 Pending — Stellar MLS as Distributed by MLS Grid
- 2026-05-18 Sold (MLS) — Stellar MLS as Distributed by MLS Grid
- 2026-05-07 Pending — Stellar MLS as Distributed by MLS Grid
- 2026-05-04 Listed $299,000 Stellar MLS as Distributed by MLS Grid
- 2025-12-18 Sold (Public Records) $120,000 Public Records
- 2002-02-18 Sold (Public Records) $115,500 Public Records
Property tax history
+2.0%/yrLatest (2025): $1,068 · +7.7% YoY. Source: county tax records.
Cash-flow waterfall
monthlySold comps — $/sqft
last 12 mo · ≤1 miLoading sold comps…