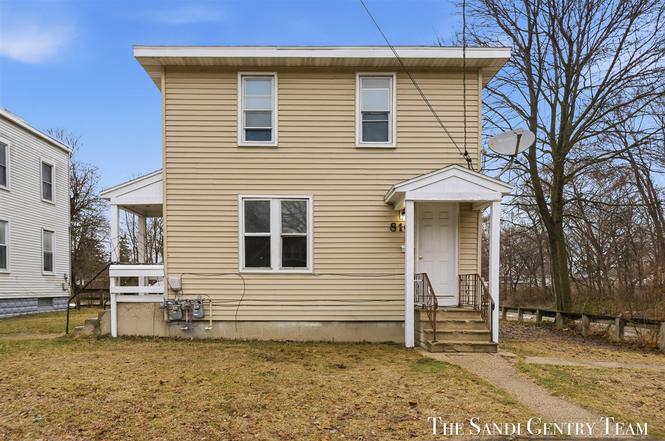
810 W Southern Ave · Muskegon, MI
Flood risk 1/10 · Minimal
- FEMA flood zone
- X (unshaded)
- Chance of flooding over 30 yrs
- 0.0%
- Est. flood insurance / yr
- $473 – $860
Fire risk 1/10 · Minimal
- Est. fire insurance / yr
- $784 – $1,456
Heat risk 1/10 · Minimal
- Hot days now (above 93°F)
- 7 days/yr
- Hot days in 30 yrs
- 15 days/yr
Wind risk 1/10 · Minimal
- Chance of severe wind over 30 yrs
- —
Air-quality risk 4/10 · Minor
- Unhealthy air days now
- 5 days/yr
- Unhealthy air days in 30 yrs
- 7 days/yr
Risk factors via First Street. Map © Google.
Why this score? — see what drove the C grade
The composite is a weighted blend of 9 inputs, each scored 0–100. Each bar is that input's sub-score; the figure is the points it added to the 100-point composite (weight × sub-score).
- Cash flow +21.0/30.0
- ARV discount +15.0/15.0
- DSCR +6.7/10.0
- Rent growth +5.0/5.0
- 1% rule +4.9/10.0
- Livability +4.0/5.0
- Condition / age +2.5/5.0
- Schools +0.6/10.0
- Appreciation +0.0/10.0
$169,900
🖨 Deal sheet 📄 Offer letter ✓ Due diligence
Listing remarks MLS
Great Investment Opportunity. Solid 2 unit income property located in the City of Muskegon. The main floor unit features 2 bedrooms and 1 full bath. The upper level unit offers 1 bedroom and 1 full bath, providing flexible rental options and strong income potential. Rental certificates are in place and valid through May 2028, offering added value and peace of mind for investors. This property is ideal for both seasoned investors and those looking to expand their portfolio with a well maintained, income producing asset. A smart addition to any investment strategy.
Key facts
- Income property
- 9,583 sq ft lot
- Built 1900
Tags
Property features AI
Finance
- Other: Property listed by RE/MAX Lakeshore
Exterior
- Utilities: Public water; Public sewer; Electricity connected; Natural gas connected
- Home design: Multi-family residential income property; Vinyl siding
- Construction: Vinyl siding construction
- Exterior features: Paved, public-maintained road access; Lot dimensions approximately 55 x 175 (0.22 acres)
Interior
- Heating & cooling: Forced air heating; Natural gas heating
- Interior features: Full basement
- Laundry & utility: No laundry in unit
Neighborhood map
What this means for you Summary
Snapshot
- This is a 4-bed/2.0-bath single-family listed at $170k.
Deal economics
- At list price, monthly cash flow is $239 ($3k/yr) — positive.
- The deal already cash-flows at list — no discount required.
- To meet the 1% rule (rent ≥ 1% of price), the offer needs to be $168k (1.2% below list).
- Recommended offer: $160k (6.0% below list) — sets the bar for market timing.
- Cap rate 8.0% vs local median 4.6% in Muskegon — top-decile yield for the area; either an underpriced asset or a hidden risk that comps aren't pricing in. Stress-test before assuming the spread holds.
Location & tenants
- Location reads 79/100 on livability (#92 in MI, #2,096 nationally) — a middle-class / working-renter tenant base. Strengths: amenities A+, commute A+, cost of living A+; Watch: schools D-, crime F, employment F.
- Muskegon Public Schools Of The City Of (urban): math 4% / reading 12% proficiency, ranked #534 of 540 in MI (top 99%) — low school quality limits family demand, transient renter base, plan for 1-2y turnover; 81% free/reduced lunch — lower-income household profile, screen leases tightly.
- Market conditions: Rents rising fast (+18.1%/yr); 268 active listings in the ZIP; 6 comparable units currently listed for rent nearby; rentals at typical pace (median 22d on market — plan ~3-4 weeks tenant-placement turnaround); 438 units permitted in Muskegon County in 2024 (115 in 5+ unit buildings).
Forward outlook
- Local home prices are declining (-3.0%/yr); year-one equity from $1k of loan paydown is wiped out by about $5k of value loss. Plan a longer hold.
- Muskegon County population projected to shrink 8% by 2050 — rents likely to lag national; underwrite the cash flow, not the appreciation.
- At projected returns (-3.0% appreciation + 8.0% rent growth), your $48k cash investment doubles in ~9 years — after that, you're playing with house money.
Negotiation context
- It's been on market 75 days — a 6% lower offer ($160k) is reasonable based on typical stale-listing flexibility.
- 2 sale attempts with the ask held roughly flat each time — persistent listings suggest the price (not the market) is what's stuck; bring a comps-based counter.
Risks & watch-outs
- Watch-outs: built in 1900 — expect roof / HVAC / electrical / plumbing capex.
Questions for the listing agent
- It's been on market 75 days. Have you received any prior offers? Is the seller open to a 6% concession, seller financing, or rate buy-down credit?
- Built in 1900 — when were the roof, HVAC, electrical panel, plumbing, and water heater last replaced?
- Why hasn't it sold? Are there any deal-killer items the seller is aware of (foundation, flood, title, zoning, code violations)?
- Is there a deadline driving the sale (1031 exchange, divorce, estate, relocation)? That informs how much negotiation room exists.
- Schools are D-rated, which usually means shorter tenancies and higher turnover. Who's the typical renter profile here, and what's been the actual vacancy rate?
- Crime grade is F in this area — have there been break-ins, vandalism, or insurance claims at this property in the last 3 years? What carrier currently insures it and at what premium?
- What's the average days-on-market for RENTAL listings here right now (not sales)? A rising rental-DOM trend means longer vacancies and softer asking-rent achievability than the comps imply.
- What's the recent tenant-quality profile in this submarket — average credit score on applications, eviction rate, late-payment / NSF rate, and stable-employment percentage? A property-management company in the area should have these aggregated.
- How much new for-sale + rental construction is in the pipeline within 1–3 miles? Heavy new supply typically softens prices + rents 12–24 months out; constrained supply supports both.
Investment metrics
- 1% rule
- 0.99% ✗
- Cap rate
- 7.98%
- Cash-on-cash
- 6.04%
- DSCR
- 1.27
- GRM
- 8.4
CMA / ARV
- ARV (on-the-fly)
- $212,432
- Comps found
- 12
Show comp detail 12 sales within ~0.75 mi
| Address | Dist | Beds/Ba | Sqft | Sold | Price | $/sf | Match |
|---|---|---|---|---|---|---|---|
| 905 W Forest Ave | 0.15mi | 4/2.0 | 1,414 (-6%) | 5mo | $169,000 | $120 | 80 |
| 1092 Ireland Ave | 0.38mi | 4/2.0 | 1,582 (+6%) | 8mo | $246,000 | $155 | 66 |
| 1643 Henry St | 0.13mi | 3/1.0 (-1) | 1,360 (-9%) | 8mo | $48,500 | $36 | 63 |
| 314 W Southern Ave | 0.58mi | 4/1.5 | 1,558 (+4%) | 2mo | $141,400 | $91 | 63 |
| 817 W Dale Ave | 0.19mi | 3/1.0 (-1) | 1,672 (+12%) | 1mo | $210,000 | $126 | 62 |
| 352 Mason Ave | 0.55mi | 3/2.5 (-1) | 1,456 (-3%) | 2mo | $255,000 | $175 | 61 |
| 1886 Crowley St | 0.43mi | 4/1.0 | 1,337 (-11%) | 7mo | $189,900 | $142 | 52 |
| 1875 Henry St | 0.43mi | 3/2.0 (-1) | 1,310 (-12%) | 3mo | $199,900 | $153 | 52 |
| 1936 Crowley St | 0.50mi | 3/1.0 (-1) | 1,388 (-7%) | 6mo | $210,000 | $151 | 51 |
| 1781 Davis St | 0.59mi | 3/1.0 (-1) | 1,440 (-4%) | 9mo | $146,900 | $102 | 50 |
| 1704 7th St | 0.57mi | 3/1.0 (-1) | 1,360 (-9%) | 6mo | $165,000 | $121 | 44 |
| 1141 W Larch Ave | 0.50mi | 3/1.0 (-1) | 1,315 (-12%) | 9mo | $222,000 | $169 | 40 |
Match score weights: distance 35% · size 25% · config 20% · recency 20%. Top-matched comps best support the ARV.
Projected returns pro-forma
-3.0% appreciation · 8.0% rent growth · sell at horizon
- IRR
- -1.8%
- Equity multiple
- 0.93×
- Total profit
- $-3,443
- Equity at exit
- $25,333
- IRR
- 12.4%
- Equity multiple
- 2.20×
- Total profit
- $56,893
- Equity at exit
- $14,690
Cash invested: $47,572 (down + closing). Projections, not guarantees.
Landlord ↔ Tenant lean methodology
- Overall (STATE)
- 62 Landlord-Friendly
- State Michigan
- 62 Landlord-Friendly · EVEN
- County
- — inherits STATE
- City
- — inherits STATE
ZIP-level market 49441
- Rents YoY
- 18.1%
- Active inventory
- 268
- Price-to-rent
- 8.4×
Monthly cashflow live
- Estimated rent
- $1,679 high interval (Pro) →
- Mortgage (P&I)
- −$891
- Tax from tax record
- −$125 /mo · $1,499/yr
- Insurance
- −$71
- HOA
- −$0
- Vacancy / Maint / Mgmt
- −$352
- Net cashflow
- $239
Break-even live
UW: 25.0% down · 7.5% · 30yr · 1.5% tax · 5.0% vac · 8.0% maint · 8.0% mgmt
Financing live
Cash to close
- Down payment
- $42,475
- Closing costs
- $5,097
- Reserves months
- —
- Total cash needed
- —
Loan-product check · same deal, 3 products live
Conventional
25% down · 7.5% · 30yr
- Down + closing
- —
- Monthly P&I
- —
- Monthly cashflow
- —
- DSCR
- —
- Eligible?
- —
Personal DTI + credit; lowest rate.
DSCR
20% down · 8.5% · 30yr
- Down + closing
- —
- Monthly P&I
- —
- Monthly cashflow
- —
- DSCR
- —
- Eligible?
- —
No personal income docs; deal must DSCR.
Hard money
10% down · 12.0% · 12mo
- Down + closing
- —
- Monthly P&I
- —
- Monthly cashflow
- —
- DSCR
- —
- Eligible?
- —
Short-term bridge; refi at stabilization.
Rent comps 6 comps
| Address | Beds | Baths | Sqft | Rent | $/sqft | DOM | Units | Dist |
|---|---|---|---|---|---|---|---|---|
| 1644 Beidler St Muskegon, MI | 3.0 | 2.0 | 1228 | $1,700 | $1.38 | 21d | 1 | 0.19mi |
| 449 Washington Ave Muskegon, MI | 3.0 | 2.0 | 1152 | $1,695 | $1.47 | 21d | 1 | 0.42mi |
| 2065 Dowd St Muskegon, MI | 3.0 | 2.0 | 1228 | $1,695 | $1.38 | 21d | 1 | 0.72mi |
| 2073 Dowd St Muskegon, MI | 3.0 | 2.5 | 1228 | $1,750 | $1.43 | 21d | 1 | 0.74mi |
| 80 E Grand Ave Muskegon, MI | 3.0 | 1.5 | 1200 | $1,300 | $1.08 | 21d | 1 | 1.04mi |
| 1188 Spring St Muskegon, MI | 3.0 | 1.0 | 1443 | $1,500 | $1.04 | 21d | 1 | 1.37mi |
Listing history 4 events
-
2026-05-11status Pending 569-char remark
Show marketing remark (569 chars)
Great Investment Opportunity. Solid 2 unit income property located in the City of Muskegon. The main floor unit features 2 bedrooms and 1 full bath. The upper level unit offers 1 bedroom and 1 full bath, providing flexible rental options and strong income potential. Rental certificates are in place and valid through May 2028, offering added value and peace of mind for investors. This property is ideal for both seasoned investors and those looking to expand their portfolio with a well maintained, income producing asset. A smart addition to any investment strategy.
-
2026-05-11status Pending
Show marketing remark (569 chars)
Great Investment Opportunity. Solid 2 unit income property located in the City of Muskegon. The main floor unit features 2 bedrooms and 1 full bath. The upper level unit offers 1 bedroom and 1 full bath, providing flexible rental options and strong income potential. Rental certificates are in place and valid through May 2028, offering added value and peace of mind for investors. This property is ideal for both seasoned investors and those looking to expand their portfolio with a well maintained, income producing asset. A smart addition to any investment strategy.
-
2026-02-25$169,900 Active
Show marketing remark (569 chars)
Great Investment Opportunity. Solid 2 unit income property located in the City of Muskegon. The main floor unit features 2 bedrooms and 1 full bath. The upper level unit offers 1 bedroom and 1 full bath, providing flexible rental options and strong income potential. Rental certificates are in place and valid through May 2028, offering added value and peace of mind for investors. This property is ideal for both seasoned investors and those looking to expand their portfolio with a well maintained, income producing asset. A smart addition to any investment strategy.
-
2026-02-25$169,900 Active 569-char remark
Show marketing remark (569 chars)
Great Investment Opportunity. Solid 2 unit income property located in the City of Muskegon. The main floor unit features 2 bedrooms and 1 full bath. The upper level unit offers 1 bedroom and 1 full bath, providing flexible rental options and strong income potential. Rental certificates are in place and valid through May 2028, offering added value and peace of mind for investors. This property is ideal for both seasoned investors and those looking to expand their portfolio with a well maintained, income producing asset. A smart addition to any investment strategy.
ⓘ Source: listings_history table (triggers on properties + properties_extension) + one-shot
backfill from property_details.listing_events for pre-trigger history.
Tax reassessment forecast MI · Partial reset (capped growth)
- Current annual tax
- $1,499 · $125/mo
- Projected year-2 tax
- $2,058 · $171/mo
- Expected delta
- +$559/yr (+$47/mo · 37.3%)
ⓘ Screening estimate from a state-policy table — verify with the county assessor before closing.
Climate risk First Street
- Flood 1/10 Low FEMA zone X (unshaded) · 0% chance over 30 yrs
- Wildfire 1/10 Low
- Heat 1/10 Low 7 d/yr ≥93°F today · 15 d/yr by 30 yrs out
- Wind 1/10 Low
- Air quality 4/10 Moderate 5 unhealthy d/yr today · 7 by 30 yrs out
Nearby sold comps map
Loading sold comps map…
Walkable amenities ~0.75 mi
Loading nearby amenities…
Taxation est. · year 1
- Rental income
- $20,143
- − Mortgage interest
- −$9,517
- − Property taxes
- −$1,499
- − Insurance
- −$850
- − Repairs & maintenance
- −$1,611
- − Management
- −$1,611
- − Depreciation
- −$4,943
- Taxable income
- $112
- Est. tax owed @ 24.0%
- −$27
- After-tax cash flow
- $2,846/yr
For passive investors: Depreciation is non-cash, so a rental often shows a tax loss while cash-flowing — sheltering income. Rental losses are passive: they offset passive income freely, and up to $25,000/yr can offset ordinary (W-2) income if you actively participate and your MAGI is under $100k (phasing out to $0 by $150k); unused losses carry forward. On sale, claimed depreciation is recaptured at up to 25%, and gains may owe capital-gains tax (a 1031 exchange can defer both). Figures are a year-1 estimate at your 24.0% rate — not tax advice; consult a CPA.
Schools (NCES district)
- District
- Muskegon Public Schools Of The City Of
- NCES district ID
- 2624840
- Math proficiency
- 4% ▼ -9.00%
- Reading proficiency
- 12% ▼ -9.00%
- Median HH income
- $27,622
- Composite
- 5.8/100
- National rank
- #10017
- State rank
- #534 of 540 in MI
Livability — Muskegon
- Score
- 79/100
- State rank
- #92
- US rank
- #2096
Category grades
Schools grade is shown separately in the Schools card above.
Census & demographics
- Census place
- Muskegon, MI
- County
- Muskegon County · 107,917 people
- City population
- 44,766
- Metro
- Muskegon, MI
- Population (ZIP)
- 36,779
- Household income
- $67,427
- Rent vs Own
- Severe rent burden
- 938.0
Population outlook (Muskegon County) Hauer SSP2
- Today (2025)
- 174,032 people
- By 2030
- 173,365 · -0.4%
- By 2040
- 168,877 · -3.0%
- By 2050
- 160,306 · -7.9%
- By 2075
- 134,426 · -22.8%
- By 2100
- 98,836 · -43.2%
Race, ethnicity, and origin ACS 2023
- Neighborhood character
- Predominantly White (79%)
- Race & ethnicity
- White 79% Black 9% Two or more races 8% Hispanic / Latino 7%
- Hispanic origin (detail)
- Mexican 5%
- Common ancestry
- Iranian 8% Romanian 5% Lithuanian 2%
- Foreign-born
- 3% · Canada
- Languages at home
- 94% English-only · Spanish 4% German/W. Germanic 1%
Political lean MEDSL · Muskegon
- 2024 margin
- Toss-up / Even · D 48.4% · R 50.2% · Other 1.5%
- 2008→2024 swing
- -31.1pp toward R · 2008: 29.3pp · 2024: -1.8pp
- All cycles
- 2024: R+1.8 2020: D+0.6 2016: D+0.9 2012: D+17.8 2008: D+29.3
Not yet ingested
- Civics
- —
Market trends
- HPI YoY
- ▼ -448.86%
- Current HPI
- 263.8317
- Rent YoY
- ▲ 18.11%
- Metro
- Muskegon, MI
- State GDP YoY
- ▲ 1.37%
- F500 in state
- 28
Industry mix (Fortune 500 HQ in MI)
| Industry | F500 HQs | Revenue |
|---|---|---|
| Automotive Parts | 3 | $48B |
|
||
| Automotive | 2 | $372B |
|
||
| Chemicals | 1 | $45B |
|
||
| Automotive Retail | 1 | $29B |
|
||
| Healthcare / Medical Devices | 1 | $23B |
|
||
| Automotive Technology | 1 | $20B |
|
||
Price history
+0.0% since first listed4 events — show timeline
- 2026-05-11 Pending — MiRealSource-MiMLS
- 2026-05-11 Pending — REALCOMP
- 2026-02-25 Listed $169,900 REALCOMP
- 2026-02-25 Listed $169,900 MiRealSource-MiMLS
Property tax history
+2.9%/yrLatest (2025): $1,499 · +2.2% YoY. Source: county tax records.
Cash-flow waterfall
monthlySold comps — $/sqft
last 12 mo · ≤1 miLoading sold comps…