151 Monte Vista Rd · Statesville, NC
Flood risk 1/10 · Minimal
- FEMA flood zone
- X (unshaded)
- Chance of flooding over 30 yrs
- 0.0%
- Est. flood insurance / yr
- $507 – $1,088
Fire risk 3/10 · Minor
- Est. fire insurance / yr
- $906 – $1,684
Heat risk 5/10 · Moderate
- Hot days now (above 103°F)
- 7 days/yr
- Hot days in 30 yrs
- 18 days/yr
Wind risk 3/10 · Minor
- Chance of severe wind over 30 yrs
- 4.0%
Air-quality risk 3/10 · Minor
- Unhealthy air days now
- 2 days/yr
- Unhealthy air days in 30 yrs
- 3 days/yr
Risk factors via First Street. Map © Google.
Why this score? — see what drove the D+ grade
The composite is a weighted blend of 9 inputs, each scored 0–100. Each bar is that input's sub-score; the figure is the points it added to the 100-point composite (weight × sub-score).
- Cash flow +13.9/30.0
- ARV discount +13.3/15.0
- Schools +4.5/10.0
- DSCR +4.2/10.0
- Rent growth +3.2/5.0
- Livability +3.0/5.0
- 1% rule +2.8/10.0
- Condition / age +2.5/5.0
- Appreciation +0.0/10.0
$258,500
🖨 Deal sheet (PDF) 📄 Offer letter ✓ Due diligence
Listing remarks
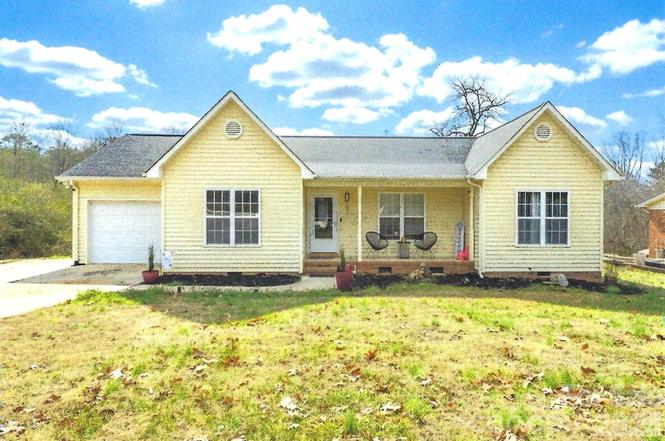
Charming ranch home featuring one level floor plan, open living and dining areas. The inviting living room offers a cozy fireplace, perfect for relaxing and entertaining. Recently remodeled kitchen boasts new appliances, providing a fresh, modern feel. Covered porch and large garage add room for a 'work area". A wonderful opportunity for first-time homeowners or downsizing seniors seeking comfort, functionality, and value. This property needs some work but has great potential - Needs some paint, carpet and wooden floor refinished.
Key facts
- Covered porch
- New appliances
- One level floor plan
Tags
Property features AI
Finance
- Other: Property type: Residential — Single Family Residence; Development status: Completed; Zoning: R-10; Lot approximately 0.45 acres (dimensions 100x200), elevation ~1000
- HOA & community: No HOA dues
Exterior
- Parking: Attached 1-car garage; Driveway with 2 open parking spaces; Has garage and open parking
- Utilities: County water; Septic system installed
- Home design: Single family residence; Site built; 1 story with F.R.O.G. (finished room over garage)
- Construction: Aluminum and block construction; Composition roof; Crawl space foundation
- Exterior features: Front porch; Patio; Outbuilding; Steep slope lot; Concrete / paved public road access
Interior
- Kitchen: Dishwasher; Disposal; Electric cooktop / electric range / oven; Microwave; Refrigerator; Plumbed for ice maker
- Bedrooms: 3 bedrooms on the main level
- Flooring: Carpet; Wood
- Bathrooms: 2 full bathrooms on the main level
- Heating & cooling: Forced air heating (natural gas); Central air conditioning; Ceiling fans; Gas for cooling system listed
- Interior features: 6 total rooms; Ceiling fan(s); Gas log fireplace with insert
- Laundry & utility: In-unit laundry; Washer and dryer included
Neighborhood map
What this means for you Summary
Snapshot
- This is a 3-bed/2.0-bath single-family listed at $258k.
Deal economics
- At list price, monthly cash flow is $26 ($318/yr) — positive.
- The deal already cash-flows at list — no discount required.
- To meet the 1% rule (rent ≥ 1% of price), the offer needs to be $202k (22.0% below list).
- Recommended offer: $202k (22.0% below list) — sets the bar for 1% rule.
- Cap rate 6.4% vs local median 3.7% in Statesville — top-decile yield for the area; either an underpriced asset or a hidden risk that comps aren't pricing in. Stress-test before assuming the spread holds.
Location & tenants
- Location reads 59/100 on livability (#557 in NC) — a working-class tenant base; expect higher turnover. Strengths: cost of living A+, housing A+; Watch: crime D, amenities F, commute F.
- Iredell-Statesville Schools (rural): math 53% / reading 52% proficiency, ranked #51 of 178 in NC (top 29%) — acceptable for families but not a draw, mixed tenant base, ~2y average lease.
- Zoned schools: N B Mills Elementary (math 17% / reading 22%, grade F, #1,242 of 1,410 statewide, top 90%, 411 students, 98% FRL); The Brawley School (math 91% / reading 88%, grade A+, #2 of 475 statewide, top 0%, 639 students, 9% FRL); Statesville High (math 17% / reading 27%, grade F, #484 of 535 statewide, top 91%, 879 students, 77% FRL) — zoned schools average 61% FRL vs 38% district-wide (24 pts higher); higher-poverty schools than district average — tighter screening recommended.
- Market conditions: Rents rising (+2.7%/yr); 289 active listings in the ZIP; 2 comparable units currently listed for rent nearby; 1,955 units permitted in Iredell County in 2024 (128 in 5+ unit buildings).
- This rent runs 38% of the median local income ($64k/yr) — at the standard rent-burdened threshold; future hikes will face affordability resistance.
Forward outlook
- Local home prices are declining (-3.0%/yr); year-one equity from $2k of loan paydown is wiped out by about $8k of value loss. Plan a longer hold.
- Iredell County population projected at +26% by 2050 — long-run rental-demand tailwind backs the buy-and-hold thesis.
Negotiation context
- It's been on market 103 days — a 9% lower offer ($235k) is reasonable based on typical stale-listing flexibility.
Risks & watch-outs
- Climate carrying-cost: extreme-heat days projected 7→18/yr by 2055 (HVAC capex compounding) — expect insurance premiums to compound above CPI over the hold.
Questions for the listing agent
- It's been on market 103 days. Have you received any prior offers? Is the seller open to a 22% concession, seller financing, or rate buy-down credit?
- Why hasn't it sold? Are there any deal-killer items the seller is aware of (foundation, flood, title, zoning, code violations)?
- Is there a deadline driving the sale (1031 exchange, divorce, estate, relocation)? That informs how much negotiation room exists.
- Schools are D-rated, which usually means shorter tenancies and higher turnover. Who's the typical renter profile here, and what's been the actual vacancy rate?
- Crime grade is D in this area — have there been break-ins, vandalism, or insurance claims at this property in the last 3 years? What carrier currently insures it and at what premium?
- The area grade is low — what's the realistic commute time and amenity access for the typical tenant pool here? Any planned neighborhood developments (good or bad) we should know about?
- What's the average days-on-market for RENTAL listings here right now (not sales)? A rising rental-DOM trend means longer vacancies and softer asking-rent achievability than the comps imply.
- What's the recent tenant-quality profile in this submarket — average credit score on applications, eviction rate, late-payment / NSF rate, and stable-employment percentage? A property-management company in the area should have these aggregated.
- How much new for-sale + rental construction is in the pipeline within 1–3 miles? Heavy new supply typically softens prices + rents 12–24 months out; constrained supply supports both.
Investment metrics
- 1% rule
- 0.78% ✗
- Cap rate
- 6.42%
- Cash-on-cash
- 0.44%
- DSCR
- 1.02
- GRM
- 10.7
CMA / ARV
- ARV (on-the-fly)
- $296,400
- Comps found
- 10
Show comp detail 10 sales within ~0.75 mi
| Address | Dist | Beds/Ba | Sqft | Sold | Price | $/sf | Match |
|---|---|---|---|---|---|---|---|
| 114 Bass Ln | 0.09mi | 3/2.0 | 1,540 (+4%) | 16mo | $335,000 | $218 | 76 |
| 136 Monte Vista Rd | 0.07mi | 2/2.0 (-1) | 1,457 (-2%) | 16mo | $291,000 | $200 | 76 |
| 242 Bradley Farm Rd | 0.37mi | 3/2.0 | 1,586 (+7%) | 0mo | $364,900 | $230 | 71 |
| 301 Monticello Rd | 0.23mi | 3/2.0 | 1,503 (+1%) | 22mo | $296,000 | $197 | 69 |
| 177 Monticello Rd | 0.42mi | 3/2.0 | 1,586 (+7%) | 2mo | $360,000 | $227 | 67 |
| 116 Miller Farm Rd | 0.34mi | 3/2.5 | 1,439 (-3%) | 13mo | $275,000 | $191 | 67 |
| 342 Monticello Rd | 0.39mi | 3/2.0 | 1,562 (+5%) | 14mo | $319,000 | $204 | 61 |
| 155 Timberbrook Ln | 0.23mi | 3/2.5 | 1,683 (+14%) | 17mo | $263,000 | $156 | 51 |
| 126 Flatrock Ln | 0.67mi | 3/2.0 | 1,386 (-6%) | 17mo | $245,000 | $177 | 44 |
| 129 Sara Ln | 0.63mi | 3/2.0 | 1,688 (+14%) | 8mo | $335,000 | $198 | 41 |
Match score weights: distance 35% · size 25% · config 20% · recency 20%. Top-matched comps best support the ARV.
Projected returns pro-forma
-3.0% appreciation · 2.72% rent growth · sell at horizon
- IRR
- -15.9%
- Equity multiple
- 0.44×
- Total profit
- $-40,874
- Equity at exit
- $38,543
- IRR
- -8.1%
- Equity multiple
- 0.50×
- Total profit
- $-36,159
- Equity at exit
- $22,350
Cash invested: $72,380 (down + closing). Projections, not guarantees.
Landlord ↔ Tenant lean methodology
- Overall (STATE)
- 85 Strongly Landlord-Friendly
- State North Carolina
- 85 Strongly Landlord-Friendly · R+3
- County
- — inherits STATE
- City
- — inherits STATE
ZIP-level market 28625
- Home prices YoY
- -22.3%
- Rents YoY
- 2.7%
- Active inventory
- 289
- Price-to-rent
- 10.7×
Monthly cashflow live
- Estimated rent
- $2,016 medium interval (Pro) →
- Mortgage (P&I)
- −$1,356
- Tax from tax record
- −$103 /mo · $1,234/yr
- Insurance
- −$108
- HOA
- −$0
- Vacancy / Maint / Mgmt
- −$423
- Net cashflow
- $26
Break-even live
Sensitivity live
| Price | -10% $173 | -5% $100 | +0% $26 | +5% $-47 | +10% $-120 |
|---|---|---|---|---|---|
| Rent | -10% $-133 | -5% $-53 | +0% $26 | +5% $106 | +10% $186 |
| Rate | -1.0pp $157 | -0.5pp $92 | base $26 | +0.5pp $-41 | +1.0pp $-109 |
UW: 25.0% down · 7.5% · 30yr · 1.5% tax · 5.0% vac · 8.0% maint · 8.0% mgmt
Financing live
Cash to close
- Down payment
- $64,625
- Closing costs
- $7,755
- Reserves months
- —
- Total cash needed
- —
Loan-product check · same deal, 3 products live
Conventional
25% down · 7.5% · 30yr
- Down + closing
- —
- Monthly P&I
- —
- Monthly cashflow
- —
- DSCR
- —
- Eligible?
- —
Personal DTI + credit; lowest rate.
DSCR
20% down · 8.5% · 30yr
- Down + closing
- —
- Monthly P&I
- —
- Monthly cashflow
- —
- DSCR
- —
- Eligible?
- —
No personal income docs; deal must DSCR.
Hard money
10% down · 12.0% · 12mo
- Down + closing
- —
- Monthly P&I
- —
- Monthly cashflow
- —
- DSCR
- —
- Eligible?
- —
Short-term bridge; refi at stabilization.
Rent comps 2 comps
| Address | Beds | Baths | Sqft | Rent | $/sqft | DOM | Units | Dist |
|---|---|---|---|---|---|---|---|---|
| 1825 Old Wilkesboro Rd Statesville, NC | 1.0–2.0 | 1.0–2.0 | 900 | $1,043 | $1.16 | 14d | 1 | 0.87mi |
| 1378 Melviney St Statesville, NC | 4.0 | 3.0 | 1723 | $2,150 | $1.25 | 25d | 1 | 1.46mi |
Listing history 17 events
-
2026-06-21days on market $258,500 Active 103 DOM
-
2026-06-18days on market $258,500 Active 100 DOM
-
2026-06-17days on market $258,500 Active 99 DOM
-
2026-06-16days on market $258,500 Active 98 DOM
-
2026-06-15days on market $258,500 Active 97 DOM
-
2026-06-13days on market $258,500 Active 95 DOM
-
2026-06-13days on market $258,500 Active 94 DOM
-
2026-06-09days on market $258,500 Active 91 DOM
-
2026-06-08days on market $258,500 Active 90 DOM
-
2026-06-07days on market $258,500 Active 89 DOM
-
2026-06-04days on market $258,500 Active 86 DOM
-
2026-06-03days on market $258,500 Active 85 DOM
-
2026-06-02days on market $258,500 Active 84 DOM
-
2026-06-01days on market $258,500 Active 83 DOM
-
2026-05-31days on market $258,500 Active 82 DOM
-
2026-04-01price $268,500
-
2026-03-09$275,000 Active
ⓘ Source: listings_history table (triggers on properties + properties_extension) + one-shot
backfill from property_details.listing_events for pre-trigger history.
Tax reassessment forecast NC · Resets to sale price
- Current annual tax
- $1,234 · $103/mo
- Projected year-2 tax
- $2,120 · $177/mo
- Expected delta
- +$886/yr (+$74/mo · 71.8%)
ⓘ Screening estimate from a state-policy table — verify with the county assessor before closing.
Climate risk First Street
- Flood 1/10 Low FEMA zone X (unshaded) · 0% chance over 30 yrs
- Wildfire 3/10 Moderate
- Heat 5/10 Major 7 d/yr ≥103°F today · 18 d/yr by 30 yrs out
- Wind 3/10 Moderate 4% chance of damaging wind over 30 yrs
- Air quality 3/10 Moderate 2 unhealthy d/yr today · 3 by 30 yrs out
Nearby sold comps map
Loading sold comps map…
Walkable amenities ~0.75 mi
Loading nearby amenities…
Taxation est. · year 1
- Rental income
- $24,192
- − Mortgage interest
- −$14,480
- − Property taxes
- −$1,234
- − Insurance
- −$1,292
- − Repairs & maintenance
- −$1,935
- − Management
- −$1,935
- − Depreciation
- −$7,520
- Taxable loss
- −$4,206
- Est. tax savings @ 24.0%
- +$1,009
- After-tax cash flow
- $1,327/yr
For passive investors: Depreciation is non-cash, so a rental often shows a tax loss while cash-flowing — sheltering income. Rental losses are passive: they offset passive income freely, and up to $25,000/yr can offset ordinary (W-2) income if you actively participate and your MAGI is under $100k (phasing out to $0 by $150k); unused losses carry forward. On sale, claimed depreciation is recaptured at up to 25%, and gains may owe capital-gains tax (a 1031 exchange can defer both). Figures are a year-1 estimate at your 24.0% rate — not tax advice; consult a CPA.
Schools (NCES district)
- District
- Iredell-Statesville Schools
- NCES district ID
- 3702310
- Math proficiency
- 53% ▲ 8.00%
- Reading proficiency
- 52% ▲ 4.00%
- Median HH income
- $51,201
- Composite
- 44.98/100
- National rank
- #2703
- State rank
- #51 of 178 in NC
Livability — Statesville
- Score
- 59/100
- State rank
- #557
- US rank
- #20505
Category grades
Schools grade is shown separately in the Schools card above.
Census & demographics
- County
- Iredell County · 182,638 people
- City population
- 78,393
- Metro
- Charlotte-Concord-Gastonia, NC-SC
- Population (ZIP)
- 39,574
- Household income
- $64,060
- Rent vs Own
- Severe rent burden
- 905.0
Population outlook (Iredell County) Hauer SSP2
- Today (2025)
- 194,510 people
- By 2030
- 206,171 · +6.0%
- By 2040
- 227,781 · +17.1%
- By 2050
- 245,102 · +26.0%
- By 2075
- 280,896 · +44.4%
- By 2100
- 294,375 · +51.3%
Race, ethnicity, and origin ACS 2023
- Neighborhood character
- Predominantly White (72%)
- Race & ethnicity
- White 72% Black 11% Hispanic / Latino 11% Two or more races 6% Asian 3%
- Hispanic origin (detail)
- Mexican 5%
- Common ancestry
- Serbian 3% Slovak 2% Italian 2%
- Foreign-born
- 6% · Canada, Jamaica
- Languages at home
- 88% English-only · Spanish 8% Other Asian/Pacific 2%
Political lean MEDSL · Iredell
- 2024 margin
- Solid R (+32.6) · D 33.2% · R 65.8%
- 2008→2024 swing
- -8.2pp toward R · 2008: -24.4pp · 2024: -32.6pp
- All cycles
- 2024: R+32.6 2020: R+32.4 2016: R+36.8 2012: R+30.5 2008: R+24.4
Not yet ingested
- Civics
- —
Market trends
- HPI YoY
- ▼ -67.88%
- Current HPI
- 237.0011
- Rent YoY
- ▲ 2.72%
- Metro
- Charlotte-Concord-Gastonia, NC-SC
- State GDP YoY
- ▲ 3.28%
- F500 in state
- 26
Industry mix (Fortune 500 HQ in NC)
| Industry | F500 HQs | Revenue |
|---|---|---|
| Financial Services | 2 | $213B |
|
||
| Retail | 2 | $95B |
|
||
| Industrial Conglomerate | 1 | $38B |
|
||
| Metals / Steel | 1 | $35B |
|
||
| Utilities | 1 | $30B |
|
||
| Industrial Machinery | 1 | $19B |
|
||
Price history
-2.4% since first listed2 events — show timeline
- 2026-04-01 Price Changed $268,500 CANOPYMLS as Distributed by MLS Grid
- 2026-03-09 Listed $275,000 CANOPYMLS as Distributed by MLS Grid
Property tax history
+4.5%/yrLatest (2025): $1,234 · +0.0% YoY. Source: county tax records.
Cash-flow waterfall
monthlySold comps — $/sqft
last 12 mo · ≤1 miLoading sold comps…