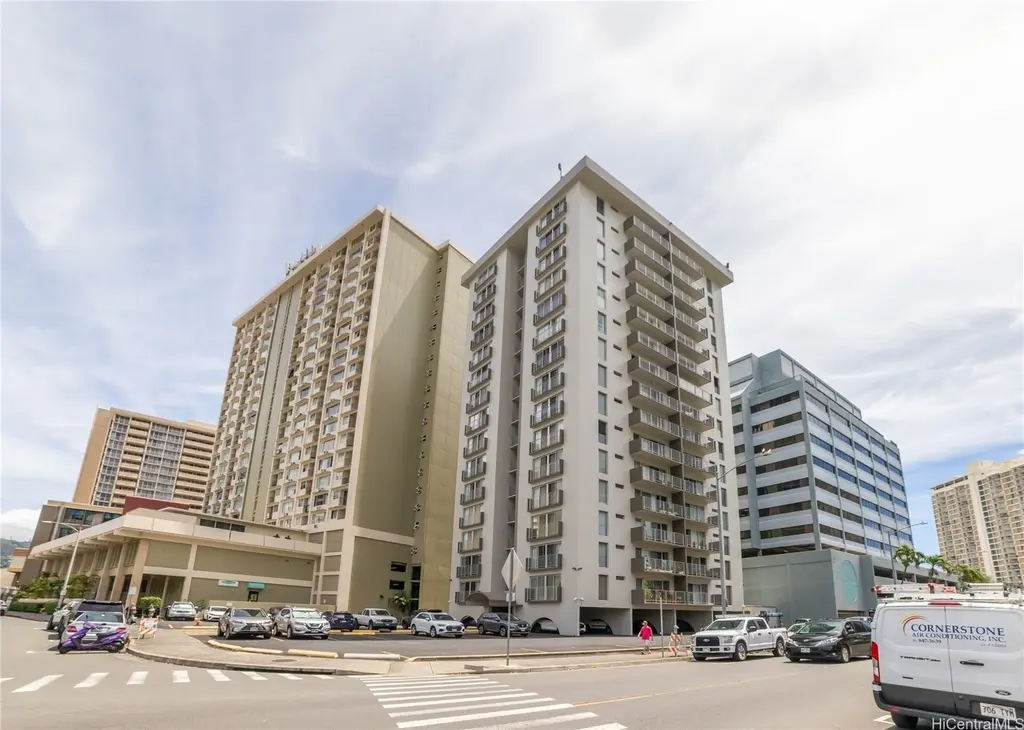
731 Amana St #303 · Urban Honolulu, HI
Flood risk 5/10 · Moderate
- FEMA flood zone
- X (unshaded)
- Chance of flooding over 30 yrs
- 0.38%
- Est. flood insurance / yr
- $507 – $1,088
Fire risk No data
- Est. fire insurance / yr
- —
Heat risk No data
- Hot days now (above threshold)
- —
- Hot days in 30 yrs
- —
Wind risk No data
- Chance of severe wind over 30 yrs
- —
Air-quality risk 1/10 · Minimal
- Unhealthy air days now
- —
- Unhealthy air days in 30 yrs
- —
Risk factors via First Street. Map © Google.
Why this score? — see what drove the C grade
The composite is a weighted blend of 9 inputs, each scored 0–100. Each bar is that input's sub-score; the figure is the points it added to the 100-point composite (weight × sub-score).
- Cash flow +14.7/30.0
- ARV discount +12.2/15.0
- Appreciation +6.0/10.0
- 1% rule +5.8/10.0
- DSCR +4.5/10.0
- Schools +3.7/10.0
- Rent growth +3.3/5.0
- Livability +2.5/5.0
- Condition / age +2.5/5.0
$425,000
🖨 Deal sheet 📄 Offer letter ✓ Due diligence
Listing remarks MLS
OPPORTUNITY KNOCKS at Coty Towers! A rare chance for new owners to bring their vision to life and create the home of their dreams in this well-maintained residence. Coty Tower is a secure, meticulously cared for building featuring ONLY four units per floor, FOB entry access, and an on-site resident manager. Conveniently located near Ala Moana Shopping Center, Walmart, Target, Don Quijote, beaches, dining, and bus lines — offering the best of city living in the heart of Honolulu. BONUS: Unit comes with in-unit Washer/Dryer!
Key facts
- Secure building
- Four units per floor
- In-unit washer dryer
Tags
Neighborhood map
What this means for you Summary
Snapshot
- This is a 2-bed/2.0-bath condo listed at $425k.
Deal economics
- At list price, monthly cash flow is $111 ($1k/yr) — positive.
- The deal already cash-flows at list — no discount required.
- Meets the 1% rule at list price ($5k rent vs $425k).
- Recommended offer: $412k (3.0% below list) — sets the bar for market timing.
- Cap rate 6.6% vs local median 1.5% in Urban Honolulu — top-decile yield for the area; either an underpriced asset or a hidden risk that comps aren't pricing in. Stress-test before assuming the spread holds.
Location & tenants
- Location reads: area grade C — affects rentability + tenant quality, not the cash-flow math above.
- Hawaii Department Of Education (suburban): math 32% / reading 50% proficiency, ranked #1 of 1 in HI (top 100%) — families likely to look elsewhere, expect single-tenant / working-renter base with shorter leases.
- Market conditions: Rents rising (+3.1%/yr); 549 active listings in the ZIP; 40 comparable units currently listed for rent nearby; rentals at typical pace (median 24d on market — plan ~3-4 weeks tenant-placement turnaround); solid renter incomes; 1,638 units permitted in Honolulu County in 2024 (793 in 5+ unit buildings).
- At $4,571/mo this rent would consume 71% of the median local household income ($78k/yr) (locally 1641% of renters already pay >50% of income on rent) — very limited rent-growth headroom before tenants either downsize or default.
Forward outlook
- In year one you build about $11k of equity ($3k loan paydown + $8k appreciation (2.0% local appreciation)).
- Honolulu County population projected at +17% by 2050 — long-run rental-demand tailwind backs the buy-and-hold thesis.
- At projected returns (2.0% appreciation + 3.1% rent growth), your $119k cash investment doubles in ~7 years — after that, you're playing with house money.
- By year 4, paydown + projected appreciation supports a ~$39k cash-out refi (75% LTV) — recoverable capital for the next deal without selling this one.
Negotiation context
- It's been on market 59 days — a 3% lower offer ($412k) is reasonable based on typical stale-listing flexibility.
- 2 sale attempts since 10y ago; this cycle's ask has dropped $24k (5%) from the opening price — seller is motivated, your offer sets the floor, not the list.
Risks & watch-outs
- Watch-outs: HOA is 21% of rent.
- Climate carrying-cost: moderate flood risk — expect insurance premiums to compound above CPI over the hold.
Questions for the listing agent
- It's been on market 59 days. Have you received any prior offers? Is the seller open to a 3% concession, seller financing, or rate buy-down credit?
- Built in 1968 — when were the roof, HVAC, electrical panel, plumbing, and water heater last replaced?
- What does the HOA fee cover, when was the last increase, and are there any pending special assessments or reserve-fund shortfalls?
- Any open or pending special assessments — roof, HVAC, plumbing, elevator, façade? What's the per-unit balance and payoff schedule, and is the seller paying it off at close or rolling it to the buyer?
- Is there a deadline driving the sale (1031 exchange, divorce, estate, relocation)? That informs how much negotiation room exists.
- What's the average days-on-market for RENTAL listings here right now (not sales)? A rising rental-DOM trend means longer vacancies and softer asking-rent achievability than the comps imply.
- What's the recent tenant-quality profile in this submarket — average credit score on applications, eviction rate, late-payment / NSF rate, and stable-employment percentage? A property-management company in the area should have these aggregated.
- How much new apartment / multifamily construction is in the pipeline within 1–3 miles? Heavy new supply (>2% of stock underway) typically softens rents 12–24 months out; light construction supports rent growth.
Investment metrics
- 1% rule
- 1.08% ✓
- Cap rate
- 6.61%
- Cash-on-cash
- 1.12%
- DSCR
- 1.05
- GRM
- 7.7
CMA / ARV
- ARV (median comp)
- $474,339
- List price
- $425,000
- Delta
- -10.40%
- Verdict
- UNDERPRICED
- Comps
- 20 within 1.0 mi
Projected returns pro-forma
1.98% appreciation · 3.1% rent growth · sell at horizon
- IRR
- 5.7%
- Equity multiple
- 1.31×
- Total profit
- $36,585
- Equity at exit
- $167,089
- IRR
- 9.3%
- Equity multiple
- 2.27×
- Total profit
- $150,897
- Equity at exit
- $240,196
Cash invested: $119,000 (down + closing). Projections, not guarantees.
Landlord ↔ Tenant lean methodology
- Overall (STATE)
- 37 Tenant-Leaning
- State Hawaii
- 37 Tenant-Leaning · D+13
- County
- — inherits STATE
- City
- — inherits STATE
ZIP-level market 96814
- Home prices YoY
- 0.5%
- Rents YoY
- 3.1%
- Active inventory
- 549
- Price-to-rent
- 7.7×
Monthly cashflow live
- Estimated rent
- $4,571 high interval (Pro) →
- Mortgage (P&I)
- −$2,229
- Tax from tax record
- −$124 /mo · $1,494/yr
- Insurance
- −$177
- HOA
- −$970
- Vacancy / Maint / Mgmt
- −$960
- Net cashflow
- $111
Break-even live
UW: 25.0% down · 7.5% · 30yr · 1.5% tax · 5.0% vac · 8.0% maint · 8.0% mgmt
Financing live
Cash to close
- Down payment
- $106,250
- Closing costs
- $12,750
- Reserves months
- —
- Total cash needed
- —
Loan-product check · same deal, 3 products live
Conventional
25% down · 7.5% · 30yr
- Down + closing
- —
- Monthly P&I
- —
- Monthly cashflow
- —
- DSCR
- —
- Eligible?
- —
Personal DTI + credit; lowest rate.
DSCR
20% down · 8.5% · 30yr
- Down + closing
- —
- Monthly P&I
- —
- Monthly cashflow
- —
- DSCR
- —
- Eligible?
- —
No personal income docs; deal must DSCR.
Hard money
10% down · 12.0% · 12mo
- Down + closing
- —
- Monthly P&I
- —
- Monthly cashflow
- —
- DSCR
- —
- Eligible?
- —
Short-term bridge; refi at stabilization.
Rent comps 40 comps
| Address | Beds | Baths | Sqft | Rent | $/sqft | DOM | Units | Dist |
|---|---|---|---|---|---|---|---|---|
| 1555 Kapiolani Blvd Honolulu, HI | 1.0–3.0 | 1.0–3.0 | 1719 | $12,750 | $7.42 | 3d | 4 | 0.10mi |
| 1555 Kapiolani Blvd Honolulu, HI | 1.0–2.0 | 1.0–2.0 | 1006 | $9,500 | $9.44 | 43d | 4 | 0.10mi |
| 629 Keeaumoku St Honolulu, HI | 1.0–2.0 | 1.0–2.0 | 919 | $6,300 | $6.86 | 43d | 2 | 0.14mi |
| 629 Keeaumoku St Honolulu, HI | 1.0–2.0 | 1.0–2.0 | 923 | $6,300 | $6.82 | 17d | 2 | 0.14mi |
| 629 Keeaumoku St Honolulu, HI | 1.0 | 1.0 | 618 | $3,350 | $5.42 | 2d | 2 | 0.14mi |
| 1631 Kapiolani Blvd #3301 Honolulu, HI | 2.0 | 2.0 | 892 | $3,675 | $4.12 | 3d | 1 | 0.14mi |
| 1631 Kapiolani Blvd #3511 Honolulu, HI | 2.0 | 2.0 | 895 | $3,750 | $4.19 | 43d | 1 | 0.14mi |
| 1500 Rycroft St Unit 800R Honolulu, HI | 2.0 | 2.0 | 942 | $4,700 | $4.99 | 43d | 1 | 0.23mi |
| 1500 Rycroft St Unit 1904 Honolulu, HI | 1.0 | 1.0 | 564 | $3,400 | $6.03 | 17d | 1 | 0.23mi |
| 1500 Rycroft St Unit 3903 Honolulu, HI | 1.0 | 1.0 | 571 | $3,750 | $6.57 | 23d | 1 | 0.23mi |
| 1500 Rycroft St Unit 2304 Honolulu, HI | 1.0 | 1.0 | 569 | $3,200 | $5.62 | 23d | 1 | 0.23mi |
| 1500 Rycroft St Unit 4419R Honolulu, HI | 2.0 | 2.0 | 1074 | $6,000 | $5.59 | 43d | 1 | 0.23mi |
| 1500 Rycroft St Unit 4116R Honolulu, HI | 2.0 | 2.0 | 872 | $5,000 | $5.73 | 23d | 1 | 0.23mi |
| 1500 Rycroft St Unit 2306R Honolulu, HI | 1.0 | 1.0 | 563 | $4,000 | $7.10 | 43d | 1 | 0.23mi |
| 1500 Rycroft St Unit 2519R Honolulu, HI | 2.0 | 2.0 | 1074 | $5,300 | $4.93 | 43d | 1 | 0.23mi |
| 1500 Rycroft St Unit 2607R Honolulu, HI | 1.0 | 1.0 | 618 | $3,500 | $5.66 | 23d | 1 | 0.23mi |
| 1388 Kapiolani Blvd Honolulu, HI | 2.0 | 2.0 | 901 | $5,500 | $6.10 | 43d | 1 | 0.24mi |
| 1388 Kapiolani Blvd Unit 3910 Honolulu, HI | 1.0 | 1.0 | 619 | $4,000 | $6.46 | 3d | 1 | 0.24mi |
| 1388 Kapiolani Blvd #1606 Honolulu, HI | 2.0 | 2.0 | 809 | $4,500 | $5.56 | 11d | 1 | 0.24mi |
| 1388 Kapiolani Blvd #2903 Honolulu, HI | 1.0 | 1.0 | 574 | $3,500 | $6.10 | 10d | 1 | 0.24mi |
| 1388 Kapiolani Blvd #4205 Honolulu, HI | 1.0 | 1.0 | 567 | $4,500 | $7.94 | 43d | 1 | 0.24mi |
| 1388 Kapiolani Blvd #2201 Honolulu, HI | 2.0 | 2.0 | 901 | $5,800 | $6.44 | 43d | 1 | 0.24mi |
| 1388 Kapiolani Blvd #1611 Honolulu, HI | 2.0 | 2.0 | 801 | $4,550 | $5.68 | 43d | 1 | 0.24mi |
| 1388 Kapiolani Blvd #4111 Honolulu, HI | 2.0 | 2.0 | 816 | $6,500 | $7.97 | 43d | 1 | 0.24mi |
| 1388 Kapiolani Blvd #1606 Honolulu, HI | 2.0 | 2.0 | 809 | $4,500 | $5.56 | 43d | 1 | 0.24mi |
| 1388 Kapiolani Blvd #2703 Honolulu, HI | 1.0 | 1.0 | 574 | $3,500 | $6.10 | 23d | 1 | 0.24mi |
| 1388 Kapiolani Blvd #2901 Honolulu, HI | 2.0 | 2.0 | 901 | $4,800 | $5.33 | 43d | 1 | 0.24mi |
| 1391 Kapiolani Blvd Honolulu, HI | 1.0–3.0 | 1.0–2.0 | 971 | $4,750 | $4.89 | 3d | 2 | 0.25mi |
| 475 Atkinson Dr Honolulu, HI | 1.0–2.0 | 1.0 | 855 | $3,000 | $3.51 | 23d | 2 | 0.25mi |
| 475 Atkinson Dr Honolulu, HI | 1.0–2.0 | 1.0 | 798 | $3,000 | $3.76 | 21d | 3 | 0.25mi |
| 1374 Kapiolani Blvd Unit 1327705P Honolulu, HI | 2.0 | 2.0 | 796 | $5,740 | $7.21 | 2d | 1 | 0.26mi |
| 1515 Liona St Unit 4401L Honolulu, HI | 2.0 | 2.0 | 990 | $4,900 | $4.95 | 43d | 1 | 0.28mi |
| 1515 Liona St Unit 4216L Honolulu, HI | 2.0 | 2.0 | 872 | $4,500 | $5.16 | 14d | 1 | 0.28mi |
| 1515 Liona St Unit 4216L Honolulu, HI | 2.0 | 2.0 | 872 | $4,500 | $5.16 | 17d | 1 | 0.28mi |
| 1515 Liona St #4407 Honolulu, HI | 1.0 | 1.0 | 606 | $3,750 | $6.19 | 3d | 1 | 0.28mi |
| 1650 Ala Moana Blvd #1611 Honolulu, HI | 1.0 | 1.0 | 930 | $3,100 | $3.33 | 3d | 1 | 0.29mi |
| 419A Atkinson Dr #1103 Honolulu, HI | 2.0 | 1.0 | 664 | $2,700 | $4.07 | 16d | 1 | 0.30mi |
| 419A Atkinson Dr Honolulu, HI | 2.0 | 1.0 | 664 | $2,698 | $4.06 | 17d | 2 | 0.30mi |
| 1750 Kalakaua Ave #2704 Honolulu, HI | 2.0 | 2.0 | 1065 | $3,300 | $3.10 | 23d | 1 | 0.30mi |
| 1267 Rycroft St Honolulu, HI | 2.0 | 1.0 | 816 | $2,750 | $3.37 | 23d | 1 | 0.33mi |
HOA detail condo
- Monthly dues
- $970 · $11,640/yr
- Assessments
- None detected in remarks — confirm with the listing agent.
Listing history 21 events
-
2026-06-18days on market $425,000 Active 59 DOM
-
2026-06-17days on market $425,000 Active 58 DOM
-
2026-06-16days on market $425,000 Active 57 DOM
-
2026-06-15days on market $425,000 Active 56 DOM
-
2026-06-13days on market $425,000 Active 54 DOM
-
2026-06-13days on market $425,000 Active 53 DOM
-
2026-06-10days on market $425,000 Active 51 DOM
-
2026-06-09days on market $425,000 Active 50 DOM
-
2026-06-08days on market $425,000 Active 49 DOM
-
2026-06-07days on market $425,000 Active 48 DOM
-
2026-06-05days on market $425,000 Active 45 DOM
-
2026-06-03days on market $425,000 Active 44 DOM
-
2026-06-02days on market $425,000 Active 43 DOM
-
2026-06-01days on market $425,000 Active 42 DOM
-
2026-05-31days on market $425,000 Active 41 DOM
-
2026-04-27price $425,000 534-char remark
Show marketing remark (534 chars)
OPPORTUNITY KNOCKS at Coty Towers! A rare chance for new owners to bring their vision to life and create the home of their dreams in this well-maintained residence. Coty Tower is a secure, meticulously cared for building featuring ONLY four units per floor, FOB entry access, and an on-site resident manager. Conveniently located near Ala Moana Shopping Center, Walmart, Target, Don Quijote, beaches, dining, and bus lines — offering the best of city living in the heart of Honolulu. BONUS: Unit comes with in-unit Washer/Dryer!
-
2026-04-20$449,000 Active 534-char remark
Show marketing remark (534 chars)
OPPORTUNITY KNOCKS at Coty Towers! A rare chance for new owners to bring their vision to life and create the home of their dreams in this well-maintained residence. Coty Tower is a secure, meticulously cared for building featuring ONLY four units per floor, FOB entry access, and an on-site resident manager. Conveniently located near Ala Moana Shopping Center, Walmart, Target, Don Quijote, beaches, dining, and bus lines — offering the best of city living in the heart of Honolulu. BONUS: Unit comes with in-unit Washer/Dryer!
-
2016-04-06soldstatus $400,000 Sold 106-char remark
Show marketing remark (106 chars)
Convenient Holiday Mart neighborhood, Ala Moana Shopping Center and buslines. Newer appliances. Great buy!
-
2016-04-06soldstatus $400,000
Show marketing remark (106 chars)
Convenient Holiday Mart neighborhood, Ala Moana Shopping Center and buslines. Newer appliances. Great buy!
-
2016-03-08$419,000 Active 106-char remark
Show marketing remark (106 chars)
Convenient Holiday Mart neighborhood, Ala Moana Shopping Center and buslines. Newer appliances. Great buy!
-
1977-10-01soldstatus $56,400
ⓘ Source: listings_history table (triggers on properties + properties_extension) + one-shot
backfill from property_details.listing_events for pre-trigger history.
Tax reassessment forecast HI · Partial reset (capped growth)
- Current annual tax
- $1,494 · $124/mo
- Projected year-2 tax
- $1,494 · $124/mo
- Expected delta
- $0/yr ($0/mo · 0.0%)
ⓘ Screening estimate from a state-policy table — verify with the county assessor before closing.
Climate risk First Street
- Flood 5/10 Major FEMA zone X (unshaded) · 38% chance over 30 yrs
- Air quality 1/10 Low
Nearby sold comps map
Loading sold comps map…
Walkable amenities ~0.75 mi
Loading nearby amenities…
Taxation est. · year 1
- Rental income
- $54,858
- − Mortgage interest
- −$23,807
- − Property taxes
- −$1,494
- − Insurance
- −$2,125
- − Repairs & maintenance
- −$4,389
- − Management
- −$4,389
- − HOA
- −$11,640
- − Depreciation
- −$12,364
- Taxable loss
- −$5,348
- Est. tax savings @ 24.0%
- +$1,284
- After-tax cash flow
- $2,618/yr
For passive investors: Depreciation is non-cash, so a rental often shows a tax loss while cash-flowing — sheltering income. Rental losses are passive: they offset passive income freely, and up to $25,000/yr can offset ordinary (W-2) income if you actively participate and your MAGI is under $100k (phasing out to $0 by $150k); unused losses carry forward. On sale, claimed depreciation is recaptured at up to 25%, and gains may owe capital-gains tax (a 1031 exchange can defer both). Figures are a year-1 estimate at your 24.0% rate — not tax advice; consult a CPA.
Schools (NCES district)
- District
- Hawaii Department Of Education
- NCES district ID
- 1500030
- Math proficiency
- 32% ▼ -10.00%
- Reading proficiency
- 50% ▼ -3.00%
- Median HH income
- $69,005
- Composite
- 37.07/100
- National rank
- #4504
- State rank
- #1 of 1 in HI
Livability — Urban Honolulu
No livability data for this city. (Only ~50 U.S. cities are tracked.)
Census & demographics
- Census place
- Urban Honolulu, HI
- County
- Honolulu County · 963,448 people
- City population
- 309,956
- Metro
- Urban Honolulu, HI
- Population (ZIP)
- 24,689
- Household income
- $77,768
- Rent vs Own
- Severe rent burden
- 1641.0
Population outlook (Honolulu County) Hauer SSP2
- Today (2025)
- 1,072,641 people
- By 2030
- 1,110,460 · +3.5%
- By 2040
- 1,181,593 · +10.2%
- By 2050
- 1,257,584 · +17.2%
- By 2075
- 1,501,120 · +39.9%
- By 2100
- 1,764,430 · +64.5%
Race, ethnicity, and origin ACS 2023
- Neighborhood character
- Diverse neighborhood (Simpson 0.58)
- Race & ethnicity
- Asian 64% Two or more races 14% White 13% Pacific Islander 6% Hispanic / Latino 5% Black 1%
- Hispanic origin (detail)
- Mexican 2% Puerto Rican 2%
- Common ancestry
- Russian 1% Lithuanian 1% Italian 1%
- Foreign-born
- 35% · China, South Korea, Vietnam
- Languages at home
- 58% English-only · Other Asian/Pacific 15% Chinese 10% Korean 9%
Political lean MEDSL · Honolulu
- 2024 margin
- Strong D (+21.6) · D 59.9% · R 38.3% · Other 1.8%
- 2008→2024 swing
- -19.4pp toward R · 2008: 41.1pp · 2024: 21.6pp
- All cycles
- 2024: D+21.6 2020: D+26.9 2016: D+29.9 2012: D+39.1 2008: D+41.1
Not yet ingested
- Civics
- —
Market trends
- HPI YoY
- ▲ 1.98%
- Current HPI
- 376.4197
- Rent YoY
- ▲ 3.10%
- Metro
- Urban Honolulu, HI
- State GDP YoY
- —
- F500 in state
- 0
Price history
+653.5% since first listed6 events — show timeline
- 2026-04-27 Price Changed $425,000 HiCentral MLS
- 2026-04-20 Listed $449,000 HiCentral MLS
- 2016-04-06 Sold (Public Records) $400,000 Public Records
- 2016-04-06 Sold (MLS) $400,000 HiCentral MLS
- 2016-03-08 Listed $419,000 HiCentral MLS
- 1977-10-01 Sold (Public Records) $56,400 Public Records
Property tax history
+2.3%/yrLatest (2022): $1,494 · +3.7% YoY. Source: county tax records.
Cash-flow waterfall
monthlySold comps — $/sqft
last 12 mo · ≤1 miLoading sold comps…