1179 Los Tulipanes Dr SE · Los Lunas, NM
Flood risk 1/10 · Minimal
- FEMA flood zone
- AE
- Chance of flooding over 30 yrs
- 0.0%
- Est. flood insurance / yr
- $1,737 – $8,500
Fire risk 5/10 · Moderate
- Est. fire insurance / yr
- $706 – $1,312
Heat risk 5/10 · Moderate
- Hot days now (above 97°F)
- 7 days/yr
- Hot days in 30 yrs
- 20 days/yr
Wind risk 1/10 · Minimal
- Chance of severe wind over 30 yrs
- —
Air-quality risk 2/10 · Minimal
- Unhealthy air days now
- 1 days/yr
- Unhealthy air days in 30 yrs
- 1 days/yr
Risk factors via First Street. Map © Google.
Why this score? — see what drove the B grade
The composite is a weighted blend of 9 inputs, each scored 0–100. Each bar is that input's sub-score; the figure is the points it added to the 100-point composite (weight × sub-score).
- Cash flow +30.0/30.0
- 1% rule +10.0/10.0
- DSCR +10.0/10.0
- ARV discount +7.5/15.0
- Rent growth +5.0/5.0
- Condition / age +5.0/5.0
- Livability +3.3/5.0
- Schools +2.6/10.0
- Appreciation +0.0/10.0
$89,500
🖨 Deal sheet 📄 Offer letter ✓ Due diligence
Listing remarks
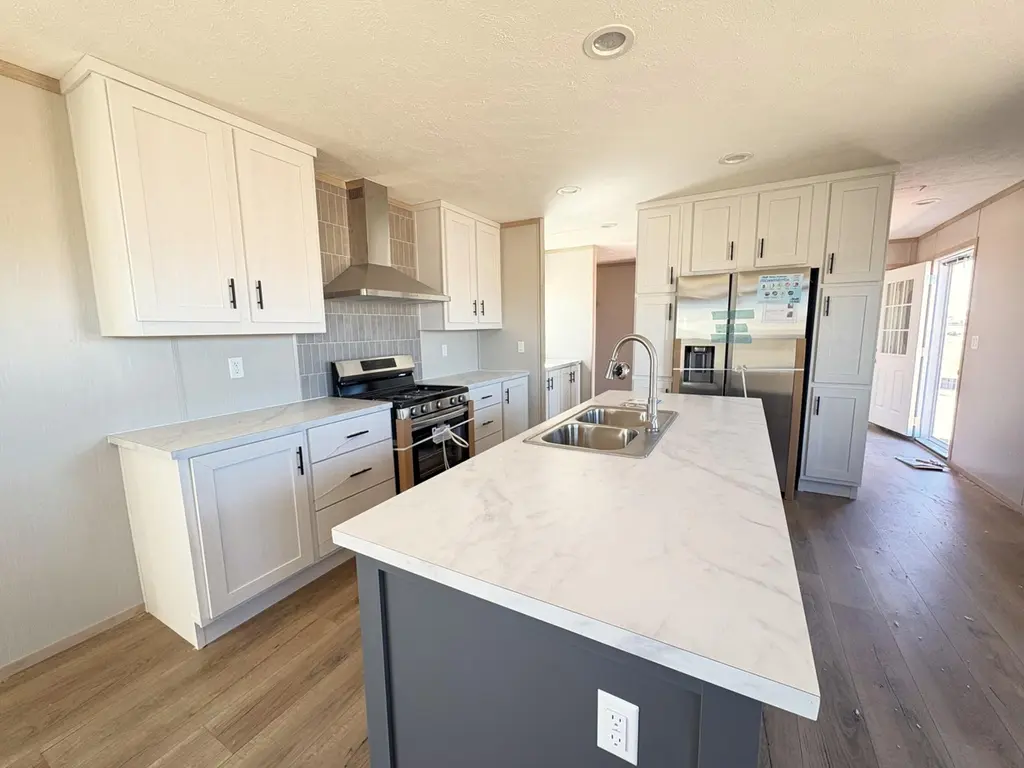
Brand new 2026 single wide MOBILE HOME ONLY! 3-bedroom 2 bath. Kitchen includes brand new appliances, dish washer, coffee bar. Centrally located in Los Lunas, near the train station and river! Ready for you to move in. LAND LEASE $750 monthly
Key facts
- Brand new appliances
- Centrally located
- Coffee bar
Tags
Property features AI
Finance
- Other: Zoning: R-1
- Financial info: Monthly land lease: $750
- HOA & community: Leased land
Exterior
- Utilities: Cable available; Electricity available; Natural gas available; Phone available; Public sewer; Public water
- Home design: Single-story home; New construction; Faces west; Mariner model by Clayton
- Construction: Vinyl siding; Pitched shingle roof; Block foundation; Manufactured home model Mariner (76' x 16'); Built by Clayton
- Exterior features: Back yard fencing; City street frontage; Asphalt road access
Interior
- Kitchen: Dishwasher; Free-standing gas range; Refrigerator
- Bedrooms: Bedroom on the main level (10' x 10')
- Flooring: Vinyl
- Bathrooms: 2 full bathrooms
- Heating & cooling: Natural gas heating
- Interior features: Double-pane insulated windows; Vinyl flooring
- Laundry & utility: Electric dryer hookup
Neighborhood map
What this means for you Summary
Snapshot
- This is a 3-bed/2.0-bath manufactured listed at $90k. Condition is rated excellent.
Deal economics
- At list price, monthly cash flow is $378 ($5k/yr) — positive.
- The deal already cash-flows at list — no discount required.
- Meets the 1% rule at list price ($2k rent vs $90k).
- Recommended offer: $87k (3.0% below list) — sets the bar for market timing.
- Cap rate 17.1% vs local median 3.8% in Los Lunas — top-decile yield for the area; either an underpriced asset or a hidden risk that comps aren't pricing in. Stress-test before assuming the spread holds.
Location & tenants
- Location reads 66/100 on livability (#46 in NM) — a middle-class / working-renter tenant base. Strengths: cost of living A+, housing A+; Watch: schools F, crime F, amenities F.
- Los Lunas Public Schools (suburban): math 20% / reading 34% proficiency, ranked #34 of 95 in NM (top 36%) — low school quality limits family demand, transient renter base, plan for 1-2y turnover; 63% free/reduced lunch — lower-income household profile, screen leases tightly.
- Market conditions: Rents rising fast (+33.2%/yr); 562 active listings in the ZIP; 4 comparable units currently listed for rent nearby; rentals leasing fast (median 10d on market — plan ~1-2 weeks tenant-placement turnaround); 303 units permitted in Valencia County in 2024 (0 in 5+ unit buildings).
- This rent runs 35% of the median local income ($61k/yr) — at the standard rent-burdened threshold; future hikes will face affordability resistance.
Forward outlook
- Local home prices are declining (-3.0%/yr); year-one equity from $619 of loan paydown is wiped out by about $3k of value loss. Plan a longer hold.
- Valencia County population projected at -14% by 2050 — secular population decline; favor cash flow + early exit over multi-decade hold.
- At projected returns (-3.0% appreciation + 8.0% rent growth), your $25k cash investment doubles in ~5 years — after that, you're playing with house money.
Negotiation context
- It's been on market 44 days — a 3% lower offer ($87k) is reasonable based on typical stale-listing flexibility.
- 2 sale attempts with the ask held roughly flat each time — persistent listings suggest the price (not the market) is what's stuck; bring a comps-based counter.
Risks & watch-outs
- Watch-outs: flood insurance adds $427/mo.
- Climate carrying-cost: in FEMA flood zone AE (mandatory federal flood insurance); moderate wildfire risk; extreme-heat days projected 7→20/yr by 2055 (HVAC capex compounding) — expect insurance premiums to compound above CPI over the hold.
Questions for the listing agent
- It's been on market 44 days. Have you received any prior offers? Is the seller open to a 3% concession, seller financing, or rate buy-down credit?
- What's the actual annual flood-insurance premium (NFIP or private), and is the property in a SFHA with mandatory coverage?
- Is there a deadline driving the sale (1031 exchange, divorce, estate, relocation)? That informs how much negotiation room exists.
- Schools are F-rated, which usually means shorter tenancies and higher turnover. Who's the typical renter profile here, and what's been the actual vacancy rate?
- Crime grade is F in this area — have there been break-ins, vandalism, or insurance claims at this property in the last 3 years? What carrier currently insures it and at what premium?
- What's the average days-on-market for RENTAL listings here right now (not sales)? A rising rental-DOM trend means longer vacancies and softer asking-rent achievability than the comps imply.
- What's the recent tenant-quality profile in this submarket — average credit score on applications, eviction rate, late-payment / NSF rate, and stable-employment percentage? A property-management company in the area should have these aggregated.
- How much new for-sale + rental construction is in the pipeline within 1–3 miles? Heavy new supply typically softens prices + rents 12–24 months out; constrained supply supports both.
Investment metrics
- 1% rule
- 2.01% ✓
- Cap rate
- 17.08%
- Cash-on-cash
- 38.53%
- DSCR
- 2.71
- GRM
- 4.1
CMA / ARV
- ARV (on-the-fly)
- $184,680
- Comps found
- 4
Show comp detail 4 sales within ~0.75 mi
| Address | Dist | Beds/Ba | Sqft | Sold | Price | $/sf | Match |
|---|---|---|---|---|---|---|---|
| 1188 Los Tulipanes Dr SE | 0.03mi | 3/2.0 | 1,140 (0%) | 1mo | $89,500 | $79 | 98 |
| 1088 Orsino Ct SE | 0.31mi | 3/2.0 | 1,110 (-3%) | 2mo | $180,000 | $162 | 80 |
| 1092 Orsino Ct SE | 0.31mi | 3/2.0 | 1,092 (-4%) | 9mo | $205,000 | $188 | 72 |
| 1082 Lamb Ct SE | 0.29mi | 3/2.0 | 1,232 (+8%) | 19mo | $162,000 | $131 | 57 |
Match score weights: distance 35% · size 25% · config 20% · recency 20%. Top-matched comps best support the ARV.
Projected returns pro-forma
-3.0% appreciation · 8.0% rent growth · sell at horizon
- IRR
- 17.6%
- Equity multiple
- 1.77×
- Total profit
- $19,389
- Equity at exit
- $13,345
- IRR
- 30.5%
- Equity multiple
- 4.69×
- Total profit
- $92,399
- Equity at exit
- $7,738
Cash invested: $25,060 (down + closing). Projections, not guarantees.
Landlord ↔ Tenant lean methodology
- Overall (STATE)
- 55 Moderately Landlord-Leaning
- State New Mexico
- 55 Moderately Landlord-Leaning · D+3
- County
- — inherits STATE
- City
- — inherits STATE
ZIP-level market 87031
- Home prices YoY
- -29.8%
- Rents YoY
- 33.2%
- Active inventory
- 562
- Price-to-rent
- 4.1×
Monthly cashflow live
- Estimated rent
- $1,801 medium interval (Pro) →
- Mortgage (P&I)
- −$469
- Tax est. 1.5%
- −$112 /mo · $1,342/yr
- Insurance
- −$37
- Flood insurance flood zone
- −$427 /mo · $5,118/yr
- HOA
- −$0
- Vacancy / Maint / Mgmt
- −$378
- Net cashflow
- $378
Break-even live
UW: 25.0% down · 7.5% · 30yr · 1.5% tax · 5.0% vac · 8.0% maint · 8.0% mgmt
Financing live
Cash to close
- Down payment
- $22,375
- Closing costs
- $2,685
- Reserves months
- —
- Total cash needed
- —
Loan-product check · same deal, 3 products live
Conventional
25% down · 7.5% · 30yr
- Down + closing
- —
- Monthly P&I
- —
- Monthly cashflow
- —
- DSCR
- —
- Eligible?
- —
Personal DTI + credit; lowest rate.
DSCR
20% down · 8.5% · 30yr
- Down + closing
- —
- Monthly P&I
- —
- Monthly cashflow
- —
- DSCR
- —
- Eligible?
- —
No personal income docs; deal must DSCR.
Hard money
10% down · 12.0% · 12mo
- Down + closing
- —
- Monthly P&I
- —
- Monthly cashflow
- —
- DSCR
- —
- Eligible?
- —
Short-term bridge; refi at stabilization.
Rent comps 4 comps
| Address | Beds | Baths | Sqft | Rent | $/sqft | DOM | Units | Dist |
|---|---|---|---|---|---|---|---|---|
| 1140 Elm Ct Los Lunas, NM | 3.0 | 1.0 | 1275 | $1,495 | $1.17 | 14d | 1 | 0.32mi |
| 1143 De Vargas Ct SE Los Lunas, NM | 3.0 | 2.0 | 1100 | $1,700 | $1.55 | 10d | 1 | 0.45mi |
| 250 Village Dr Apt 258 Los Lunas, NM | 2.0 | 1.0 | 800 | $1,225 | $1.53 | 1d | 1 | 0.49mi |
| 250 Village Dr Apt 296 Los Lunas, NM | 2.0 | 1.0 | 800 | $1,250 | $1.56 | 1d | 1 | 0.49mi |
Listing history 17 events
-
2026-06-18days on market $89,500 Active 44 DOM
-
2026-06-17days on market $89,500 Active 43 DOM
-
2026-06-16days on market $89,500 Active 42 DOM
-
2026-06-15days on market $89,500 Active 41 DOM
-
2026-06-13days on market $89,500 Active 39 DOM
-
2026-06-10days on market $89,500 Active 36 DOM
-
2026-06-09days on market $89,500 Active 35 DOM
-
2026-06-08days on market $89,500 Active 34 DOM
-
2026-06-07days on market $89,500 Active 33 DOM
-
2026-06-05days on market $89,500 Active 30 DOM
-
2026-06-03days on market $89,500 Active 29 DOM
-
2026-06-02days on market $89,500 Active 28 DOM
-
2026-06-01days on market $89,500 Active 27 DOM
-
2026-05-31days on market $89,500 Active 26 DOM
-
2026-05-20status Active
-
2026-04-22status Pending
-
2026-04-07$89,500 Active
ⓘ Source: listings_history table (triggers on properties + properties_extension) + one-shot
backfill from property_details.listing_events for pre-trigger history.
Climate risk First Street
- Flood 1/10 Low FEMA zone AE · 0% chance over 30 yrs
- Wildfire 5/10 Major
- Heat 5/10 Major 7 d/yr ≥97°F today · 20 d/yr by 30 yrs out
- Wind 1/10 Low
- Air quality 2/10 Low 1 unhealthy d/yr today · 1 by 30 yrs out
Nearby sold comps map
Loading sold comps map…
Walkable amenities ~0.75 mi
Loading nearby amenities…
Taxation est. · year 1
- Rental income
- $21,618
- − Mortgage interest
- −$5,013
- − Property taxes
- −$1,342
- − Insurance
- −$5,566
- − Repairs & maintenance
- −$1,729
- − Management
- −$1,729
- − Depreciation
- −$2,604
- Taxable income
- $3,633
- Est. tax owed @ 24.0%
- −$872
- After-tax cash flow
- $3,665/yr
For passive investors: Depreciation is non-cash, so a rental often shows a tax loss while cash-flowing — sheltering income. Rental losses are passive: they offset passive income freely, and up to $25,000/yr can offset ordinary (W-2) income if you actively participate and your MAGI is under $100k (phasing out to $0 by $150k); unused losses carry forward. On sale, claimed depreciation is recaptured at up to 25%, and gains may owe capital-gains tax (a 1031 exchange can defer both). Figures are a year-1 estimate at your 24.0% rate — not tax advice; consult a CPA.
Condition & rehab AI · 10 photos
This brand new 2026 single-wide mobile home is move-in ready with no repairs or maintenance needed. It offers a good investment opportunity with a land lease included in the monthly payment.
Value-add opportunities
- Both Land lease — Land lease included in the monthly payment, making it a turnkey investment.
- Both Landscaping — Landscaping can enhance curb appeal and increase property value.
- Both Furniture — Furniture can make the home more appealing to potential buyers or renters.
- Both Decor — Decor can make the home more inviting and increase its appeal to potential buyers or renters.
Renovation cost estimate screening
Value-add ROI direction
- Both Land lease — Land lease included in the monthly payment, making it a turnkey investment. ↑
- Both Landscaping — Landscaping can enhance curb appeal and increase property value. ↑
- Both Furniture — Furniture can make the home more appealing to potential buyers or renters. ↑
- Both Decor — Decor can make the home more inviting and increase its appeal to potential buyers or renters. ↑
ⓘ Cost ranges are severity-bucket heuristics (US national rule-of-thumb). Get contractor quotes + a written scope before underwriting a rehab budget.
Schools (NCES district)
- District
- Los Lunas Public Schools
- NCES district ID
- 3501680
- Math proficiency
- 20% —
- Reading proficiency
- 34% —
- Median HH income
- $44,438
- Composite
- 26.11/100
- National rank
- #12724
- State rank
- #34 of 95 in NM
Livability — Los Lunas
- Score
- 66/100
- State rank
- #46
- US rank
- #12347
Category grades
Schools grade is shown separately in the Schools card above.
Census & demographics
- Census place
- Los Lunas, NM
- County
- Valencia County · 68,779 people
- City population
- 47,514
- Metro
- Albuquerque, NM
- Population (ZIP)
- 47,514
- Household income
- $60,902
- Rent vs Own
- Severe rent burden
- 602.0
Population outlook (Valencia County) Hauer SSP2
- Today (2025)
- 73,788 people
- By 2030
- 72,101 · -2.3%
- By 2040
- 67,930 · -7.9%
- By 2050
- 63,191 · -14.4%
- By 2075
- 53,644 · -27.3%
- By 2100
- 40,882 · -44.6%
Race, ethnicity, and origin ACS 2023
- Neighborhood character
- Majority Hispanic (63%)
- Race & ethnicity
- Hispanic / Latino 63% White 30% Two or more races 29% Native American 4% Black 1%
- Hispanic origin (detail)
- Mexican 38%
- Common ancestry
- Serbian 1% Russian 1% Slovak 1%
- Foreign-born
- 8% · Canada
- Languages at home
- 71% English-only · Spanish 27%
Political lean MEDSL · Valencia
- 2024 margin
- R (+16.4) · D 40.9% · R 57.3% · Other 1.8%
- 2008→2024 swing
- -24.1pp toward R · 2008: 7.7pp · 2024: -16.4pp
- All cycles
- 2024: R+16.4 2020: R+9.6 2016: R+8.7 2012: D+2.5 2008: D+7.7
Not yet ingested
- Civics
- —
Market trends
- HPI YoY
- ▼ -85.17%
- Current HPI
- 201.0508
- Rent YoY
- ▲ 33.16%
- Metro
- Albuquerque, NM
- State GDP YoY
- —
- F500 in state
- 0
Price history
3 events — show timeline
- 2026-05-20 Relisted — Southwest MLS
- 2026-04-22 Pending — Southwest MLS
- 2026-04-07 Listed $89,500 Southwest MLS
Cash-flow waterfall
monthlySold comps — $/sqft
last 12 mo · ≤1 miLoading sold comps…