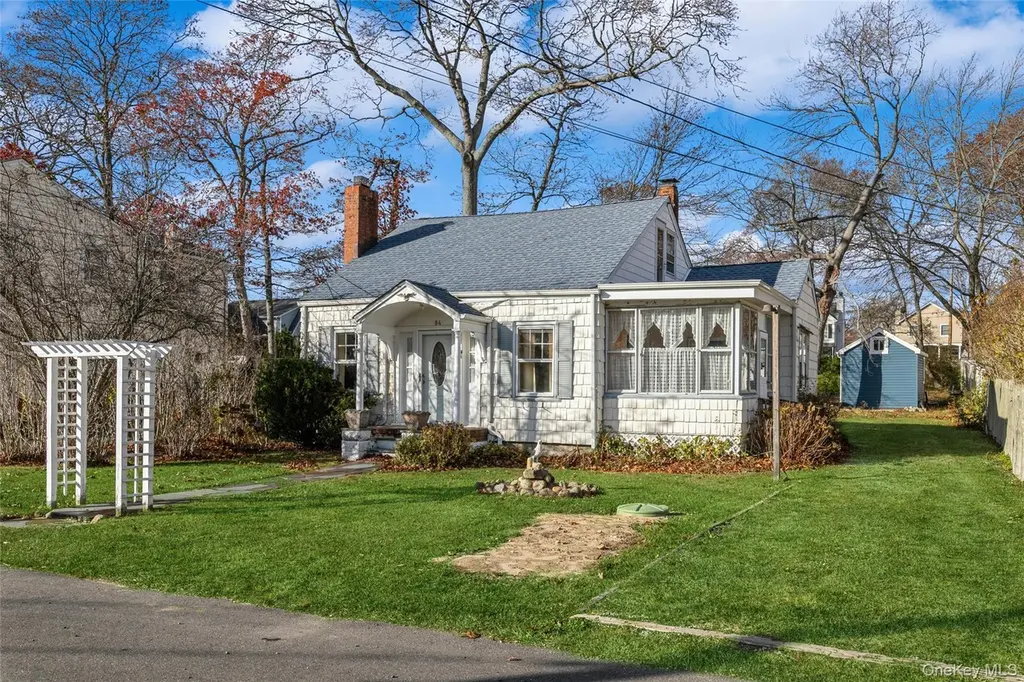
84 Riviera Dr · Mastic, NY
Flood risk 9/10 · Severe
- FEMA flood zone
- AE
- Chance of flooding over 30 yrs
- 0.99%
- Est. flood insurance / yr
- $2,026 – $9,024
Fire risk 1/10 · Minimal
- Est. fire insurance / yr
- $691 – $1,283
Heat risk 4/10 · Minor
- Hot days now (above 91°F)
- 7 days/yr
- Hot days in 30 yrs
- 19 days/yr
Wind risk 8/10 · Major
- Chance of severe wind over 30 yrs
- 80.0%
Air-quality risk 4/10 · Minor
- Unhealthy air days now
- 3 days/yr
- Unhealthy air days in 30 yrs
- 5 days/yr
Risk factors via First Street. Map © Google.
Why this score? — see what drove the C grade
The composite is a weighted blend of 9 inputs, each scored 0–100. Each bar is that input's sub-score; the figure is the points it added to the 100-point composite (weight × sub-score).
- Cash flow +20.3/30.0
- ARV discount +15.0/15.0
- DSCR +6.4/10.0
- Schools +4.7/10.0
- 1% rule +4.2/10.0
- Livability +3.2/5.0
- Rent growth +2.5/5.0
- Condition / age +2.5/5.0
- Appreciation +0.0/10.0
$399,999
🖨 Deal sheet (PDF) 📄 Offer letter ✓ Due diligence
Listing remarks
Enjoy beautiful waterview’s from this delightful Cape Cod offers the perfect blend of charm, comfort, and location. Nestled on a peaceful, tree-lined street, this 4 bedroom home welcomes you with a warm atmosphere, sunlit interiors, and classic architectural details that create an inviting place to call home. Whether you're seeking a year-round residence, a weekend escape, or an opportunity to personalize a home with character, this property delivers a rare combination of water views and everyday convenience. Step inside to find beautiful wood floors, elegant crown molding, and a cozy wood-burning fireplace that serves as the heart of the home, creating the perfect setting for relaxin
Key facts
- Wood floors
- Tree lined street
- Updated roof
Tags
Property features AI
Exterior
- Parking: Driveway parking
- Utilities: Electric service by PSEG; Water available; Public trash collection; Cable available; Electricity available; No sewer service
- Home design: Single-family residence
- Construction: Frame construction
- Exterior features: Frame construction; Not waterfront; No additional parcels
Interior
- Kitchen: Electric range
- Bathrooms: 1 full bathroom
- Heating & cooling: Hot air heating; No central cooling
- Interior features: First-floor full bathroom; Unfinished basement; Attic details: see remarks; 6 total rooms
Neighborhood map
What this means for you Summary
Snapshot
- This is a 4-bed/1.0-bath single-family listed at $400k.
Deal economics
- At list price, monthly cash flow is $49 ($585/yr) — positive.
- The deal already cash-flows at list — no discount required.
- To meet the 1% rule (rent ≥ 1% of price), the offer needs to be $368k (8.0% below list).
- Recommended offer: $368k (8.0% below list) — sets the bar for 1% rule.
- Cap rate 7.8% vs local median 4.7% in Mastic — top-decile yield for the area; either an underpriced asset or a hidden risk that comps aren't pricing in. Stress-test before assuming the spread holds.
Location & tenants
- Location reads 63/100 on livability (#816 in NY) — a middle-class / working-renter tenant base. Strengths: employment A+, housing A+, health & safety B; Watch: crime D, amenities F, commute F.
- William Floyd Union Free School District (suburban): math 48% / reading 57% proficiency, ranked #309 of 590 in NY (top 52%) — acceptable for families but not a draw, mixed tenant base, ~2y average lease.
- Zoned schools: Moriches Elementary School (math 52% / reading 57%, grade C, #908 of 2,108 statewide, top 46%, 822 students, 57% FRL); William Floyd Middle School (math 36% / reading 47%, grade F, #394 of 729 statewide, top 55%, 1,053 students, 54% FRL); William Floyd High School (math 65% / reading 87%, grade A-, #616 of 1,100 statewide, top 57%, 3,013 students, 54% FRL).
- Market conditions: 100 active listings in the ZIP; 4 comparable units currently listed for rent nearby; rentals at typical pace (median 27d on market — plan ~3-4 weeks tenant-placement turnaround); 1,366 units permitted in Suffolk County in 2024 (216 in 5+ unit buildings).
Forward outlook
- Local home prices are declining (-3.0%/yr); year-one equity from $3k of loan paydown is wiped out by about $12k of value loss. Plan a longer hold.
- Suffolk County population projected to shrink 5% by 2050 — rents likely to lag national; underwrite the cash flow, not the appreciation.
Negotiation context
- Only 11 days on market — expect competitive offers; lowballing is unlikely to land.
- 2 sale attempts with the ask held roughly flat each time — persistent listings suggest the price (not the market) is what's stuck; bring a comps-based counter.
- Current owner paid $102k; list at $400k implies a 290% gain — meaningful room to come down on a strong offer.
Risks & watch-outs
- Watch-outs: flood insurance adds $460/mo; built in 1940 — expect roof / HVAC / electrical / plumbing capex.
- Climate carrying-cost: in FEMA flood zone AE (mandatory federal flood insurance); severe wind risk, 80% chance of damaging wind over 30y — expect insurance premiums to compound above CPI over the hold.
Questions for the listing agent
- Built in 1940 — when were the roof, HVAC, electrical panel, plumbing, and water heater last replaced?
- What's the actual annual flood-insurance premium (NFIP or private), and is the property in a SFHA with mandatory coverage?
- Is there a deadline driving the sale (1031 exchange, divorce, estate, relocation)? That informs how much negotiation room exists.
- Schools are F-rated, which usually means shorter tenancies and higher turnover. Who's the typical renter profile here, and what's been the actual vacancy rate?
- Crime grade is D in this area — have there been break-ins, vandalism, or insurance claims at this property in the last 3 years? What carrier currently insures it and at what premium?
- What's the average days-on-market for RENTAL listings here right now (not sales)? A rising rental-DOM trend means longer vacancies and softer asking-rent achievability than the comps imply.
- What's the recent tenant-quality profile in this submarket — average credit score on applications, eviction rate, late-payment / NSF rate, and stable-employment percentage? A property-management company in the area should have these aggregated.
- How much new for-sale + rental construction is in the pipeline within 1–3 miles? Heavy new supply typically softens prices + rents 12–24 months out; constrained supply supports both.
Investment metrics
- 1% rule
- 0.92% ✗
- Cap rate
- 7.82%
- Cash-on-cash
- 5.46%
- DSCR
- 1.24
- GRM
- 9.1
CMA / ARV
- ARV (median comp)
- $489,687
- List price
- $399,999
- Delta
- -8.31%
- Verdict
- FAIR
- Comps
- 20 within 1.0 mi
Show comp detail 12 sales within ~0.75 mi
| Address | Dist | Beds/Ba | Sqft | Sold | Price | $/sf | Match |
|---|---|---|---|---|---|---|---|
| 161 Shinnecock Ave | 0.29mi | 3/1.0 (-1) | 1,300 (+2%) | 4mo | $450,000 | $346 | 74 |
| 136 B Hampton Ave | 0.48mi | 3/1.0 (-1) | 1,260 (-1%) | 0mo | $450,000 | $357 | 71 |
| 115 Coventry Ave | 0.22mi | 3/1.0 (-1) | 1,164 (-8%) | 4mo | $375,000 | $322 | 68 |
| 108 Riviera Dr | 0.20mi | 3/2.0 (-1) | 1,200 (-6%) | 7mo | $500,000 | $417 | 67 |
| 24 Dover Ave | 0.37mi | 3/2.0 (-1) | 1,224 (-4%) | 6mo | $530,000 | $433 | 62 |
| 145A Hampton Ave | 0.46mi | 3/2.5 (-1) | 1,322 (+4%) | 3mo | $525,000 | $397 | 58 |
| 77 Poospatuck Ln | 0.32mi | 3/2.0 (-1) | 1,152 (-9%) | 5mo | $355,000 | $308 | 57 |
| 145 Clinton Ave | 0.73mi | 3/1.0 (-1) | 1,278 (+1%) | 6mo | $430,000 | $336 | 55 |
| 180 Main Ave | 0.31mi | 3/1.0 (-1) | 1,082 (-15%) | 5mo | $430,000 | $397 | 52 |
| 169 Pawnee Ave | 0.44mi | 3/1.5 (-1) | 1,100 (-13%) | 7mo | $430,000 | $391 | 44 |
| 155 Moriches Ave | 0.51mi | 3/2.0 (-1) | 1,408 (+11%) | 6mo | $355,000 | $252 | 44 |
| 118 Moriches Ave | 0.64mi | 3/2.0 (-1) | 1,451 (+14%) | 2mo | $570,000 | $393 | 36 |
Match score weights: distance 35% · size 25% · config 20% · recency 20%. Top-matched comps best support the ARV.
Projected returns pro-forma
-3.0% appreciation · 3.0% rent growth · sell at horizon
- IRR
- -15.4%
- Equity multiple
- 0.45×
- Total profit
- $-61,597
- Equity at exit
- $59,641
- IRR
- -6.9%
- Equity multiple
- 0.56×
- Total profit
- $-49,177
- Equity at exit
- $34,585
Cash invested: $112,000 (down + closing). Projections, not guarantees.
Landlord ↔ Tenant lean methodology
- Overall (STATE)
- 15 Strongly Tenant-Friendly
- State New York
- 15 Strongly Tenant-Friendly · D+10
- County
- — inherits STATE
- City
- — inherits STATE
ZIP-level market 11950
- Home prices YoY
- -33.2%
- Active inventory
- 100
- Price-to-rent
- 9.1×
Monthly cashflow live
- Estimated rent
- $3,679 medium interval (Pro) →
- Mortgage (P&I)
- −$2,098
- Tax from tax record
- −$133 /mo · $1,595/yr
- Insurance
- −$167
- Flood insurance flood zone
- −$460 /mo · $5,525/yr
- HOA
- −$0
- Vacancy / Maint / Mgmt
- −$773
- Net cashflow
- $49
Break-even live
Sensitivity live
| Price | -10% $275 | -5% $162 | +0% $49 | +5% $-64 | +10% $-178 |
|---|---|---|---|---|---|
| Rent | -10% $-242 | -5% $-97 | +0% $49 | +5% $194 | +10% $339 |
| Rate | -1.0pp $250 | -0.5pp $151 | base $49 | +0.5pp $-55 | +1.0pp $-160 |
UW: 25.0% down · 7.5% · 30yr · 1.5% tax · 5.0% vac · 8.0% maint · 8.0% mgmt
Financing live
Cash to close
- Down payment
- $100,000
- Closing costs
- $12,000
- Reserves months
- —
- Total cash needed
- —
Loan-product check · same deal, 3 products live
Conventional
25% down · 7.5% · 30yr
- Down + closing
- —
- Monthly P&I
- —
- Monthly cashflow
- —
- DSCR
- —
- Eligible?
- —
Personal DTI + credit; lowest rate.
DSCR
20% down · 8.5% · 30yr
- Down + closing
- —
- Monthly P&I
- —
- Monthly cashflow
- —
- DSCR
- —
- Eligible?
- —
No personal income docs; deal must DSCR.
Hard money
10% down · 12.0% · 12mo
- Down + closing
- —
- Monthly P&I
- —
- Monthly cashflow
- —
- DSCR
- —
- Eligible?
- —
Short-term bridge; refi at stabilization.
Rent comps 4 comps
| Address | Beds | Baths | Sqft | Rent | $/sqft | DOM | Units | Dist |
|---|---|---|---|---|---|---|---|---|
| 48 Eleanor Ave Mastic, NY | 3.0 | 1.0 | 975 | $3,500 | $3.59 | 26d | 1 | 0.56mi |
| 61 Montgomery Ave Mastic, NY | 3.0 | 2.0 | 1025 | $3,400 | $3.32 | 21d | 1 | 1.13mi |
| 14 Titmus Dr Mastic, NY | 4.0 | 1.0 | 1428 | $3,800 | $2.66 | 46d | 1 | 1.18mi |
| 61 Gores Dr Mastic, NY | 4.0 | 2.0 | 1397 | $4,200 | $3.01 | 0d | 1 | 1.34mi |
Listing history 12 events
-
2026-06-21days on market $399,999 Active 11 DOM
-
2026-06-18days on market $399,999 Active 8 DOM
-
2026-06-17days on market $399,999 Active 7 DOM
-
2026-06-16days on market $399,999 Active 6 DOM
-
2026-06-15days on market $399,999 Active 5 DOM
-
2026-06-13days on market $399,999 Active 3 DOM
-
2026-06-13remarks 693-char remark
-
2026-06-13pricestatusdays on market $399,999 Active 2 DOM
-
2026-05-16historical
-
2025-11-15$449,000 Active
-
1988-02-16soldstatus $102,500
-
1986-10-20soldstatus $52,000
ⓘ Source: listings_history table (triggers on properties + properties_extension) + one-shot
backfill from property_details.listing_events for pre-trigger history.
Tax reassessment forecast NY · Partial reset (capped growth)
- Current annual tax
- $1,595 · $133/mo
- Projected year-2 tax
- $4,177 · $348/mo
- Expected delta
- +$2,583/yr (+$215/mo · 161.9%)
ⓘ Screening estimate from a state-policy table — verify with the county assessor before closing.
Climate risk First Street
- Flood 9/10 Extreme FEMA zone AE · 99% chance over 30 yrs
- Wildfire 1/10 Low
- Heat 4/10 Moderate 7 d/yr ≥91°F today · 19 d/yr by 30 yrs out
- Wind 8/10 Severe 80% chance of damaging wind over 30 yrs
- Air quality 4/10 Moderate 3 unhealthy d/yr today · 5 by 30 yrs out
Nearby sold comps map
Loading sold comps map…
Walkable amenities ~0.75 mi
Loading nearby amenities…
Taxation est. · year 1
- Rental income
- $44,148
- − Mortgage interest
- −$22,406
- − Property taxes
- −$1,595
- − Insurance
- −$7,525
- − Repairs & maintenance
- −$3,532
- − Management
- −$3,532
- − Depreciation
- −$11,636
- Taxable loss
- −$6,078
- Est. tax savings @ 24.0%
- +$1,459
- After-tax cash flow
- $2,044/yr
For passive investors: Depreciation is non-cash, so a rental often shows a tax loss while cash-flowing — sheltering income. Rental losses are passive: they offset passive income freely, and up to $25,000/yr can offset ordinary (W-2) income if you actively participate and your MAGI is under $100k (phasing out to $0 by $150k); unused losses carry forward. On sale, claimed depreciation is recaptured at up to 25%, and gains may owe capital-gains tax (a 1031 exchange can defer both). Figures are a year-1 estimate at your 24.0% rate — not tax advice; consult a CPA.
Schools (NCES district)
- District
- William Floyd Union Free School District
- NCES district ID
- 3618690
- Math proficiency
- 48% ▲ 3.00%
- Reading proficiency
- 57% ▲ 11.00%
- Median HH income
- $70,564
- Composite
- 46.79/100
- National rank
- #2383
- State rank
- #309 of 590 in NY
Livability — Mastic
- Score
- 63/100
- State rank
- #816
- US rank
- #15786
Category grades
Schools grade is shown separately in the Schools card above.
Census & demographics
- Census place
- Mastic, NY
- City population
- 16,944
- Population (ZIP)
- 16,944
Population outlook (Suffolk County) Hauer SSP2
- Today (2025)
- 1,505,262 people
- By 2030
- 1,498,318 · -0.5%
- By 2040
- 1,471,101 · -2.3%
- By 2050
- 1,424,848 · -5.3%
- By 2075
- 1,337,157 · -11.2%
- By 2100
- 1,217,720 · -19.1%
Race, ethnicity, and origin ACS 2023
- Neighborhood character
- Diverse neighborhood (Simpson 0.59)
- Race & ethnicity
- White 55% Hispanic / Latino 30% Two or more races 15% Black 7% Native American 2% Asian 1%
- Hispanic origin (detail)
- Mexican 6% Puerto Rican 8%
- Common ancestry
- Romanian 3% Scotch-Irish 1%
- Foreign-born
- 18% · Canada, Jamaica
- Languages at home
- 72% English-only · Spanish 20% Other Indo-European 3% Russian/Polish/Slavic 2%
Political lean MEDSL · Suffolk
- 2024 margin
- Lean R (+10.0) · D 45.0% · R 55.0%
- 2008→2024 swing
- -16.0pp toward R · 2008: 6.0pp · 2024: -10.0pp
- All cycles
- 2024: R+10.0 2020: R+0.0 2016: R+8.2 2012: D+2.9 2008: D+6.0
Not yet ingested
- Civics
- —
Market trends
- HPI YoY
- ▼ -228.55%
- Current HPI
- 460.0878
- Rent YoY
- —
- Metro
- —
- State GDP YoY
- ▲ 2.60%
- F500 in state
- 92
Industry mix (Fortune 500 HQ in NY)
| Industry | F500 HQs | Revenue |
|---|---|---|
| Financial Services | 10 | $950B |
|
||
| Consumer Goods | 9 | $162B |
|
||
| Insurance | 4 | $225B |
|
||
| Telecommunications | 2 | $144B |
|
||
| Pharmaceuticals | 2 | $112B |
|
||
| Media / Entertainment | 2 | $69B |
|
||
Price history
+669.2% since first listed5 events — show timeline
- 2026-06-08 Listed $399,999 OneKey® MLS as Distributed by MLS Grid
- 2026-05-16 Listing Removed — OneKey® MLS as Distributed by MLS Grid
- 2025-11-15 Listed $449,000 OneKey® MLS as Distributed by MLS Grid
- 1988-02-16 Sold (Public Records) $102,500 Public Records
- 1986-10-20 Sold (Public Records) $52,000 Public Records
Property tax history
-6.2%/yrLatest (2025): $1,595 · +0.0% YoY. Source: county tax records.
Cash-flow waterfall
monthlySold comps — $/sqft
last 12 mo · ≤1 miLoading sold comps…