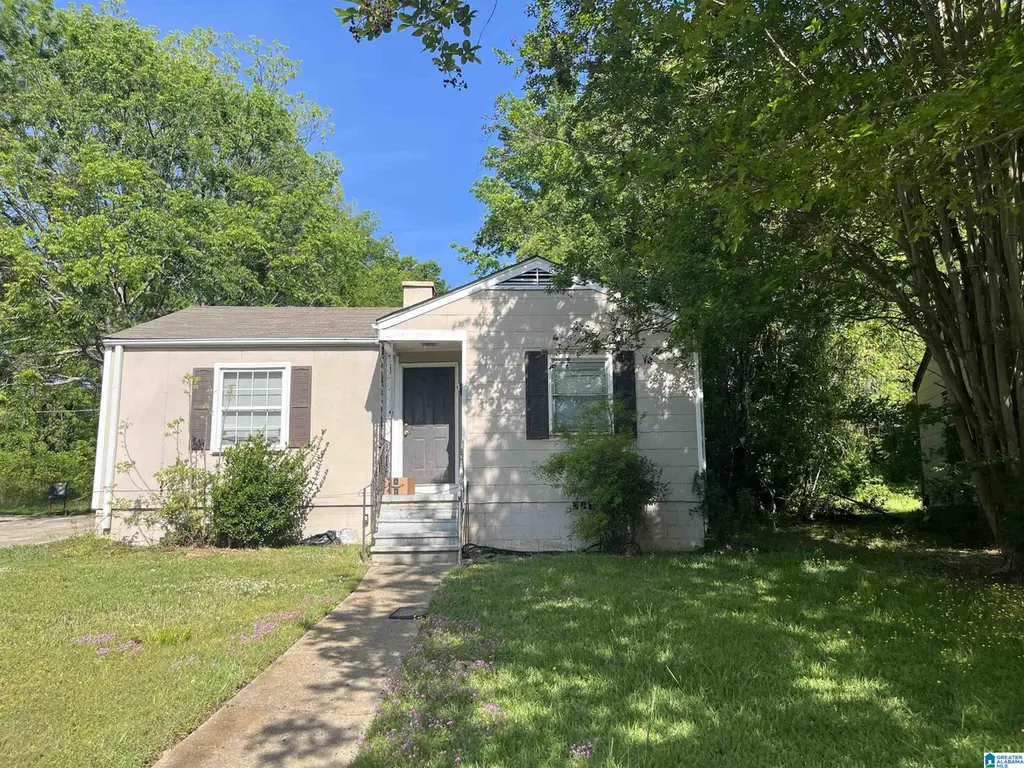
3712 68th St N · Birmingham, AL
Flood risk 1/10 · Minimal
- FEMA flood zone
- X (unshaded)
- Chance of flooding over 30 yrs
- 0.0%
- Est. flood insurance / yr
- $507 – $1,088
Fire risk 1/10 · Minimal
- Est. fire insurance / yr
- $916 – $1,700
Heat risk 6/10 · Moderate
- Hot days now (above 106°F)
- 7 days/yr
- Hot days in 30 yrs
- 19 days/yr
Wind risk 6/10 · Moderate
- Chance of severe wind over 30 yrs
- 27.0%
Air-quality risk 5/10 · Moderate
- Unhealthy air days now
- 7 days/yr
- Unhealthy air days in 30 yrs
- 9 days/yr
Risk factors via First Street. Map © Google.
Why this score? — see what drove the B grade
The composite is a weighted blend of 9 inputs, each scored 0–100. Each bar is that input's sub-score; the figure is the points it added to the 100-point composite (weight × sub-score).
- Cash flow +30.0/30.0
- ARV discount +12.1/15.0
- 1% rule +10.0/10.0
- DSCR +10.0/10.0
- Livability +3.4/5.0
- Rent growth +3.0/5.0
- Condition / age +2.5/5.0
- Schools +0.9/10.0
- Appreciation +0.0/10.0
$60,000
🖨 Deal sheet (PDF) 📄 Offer letter ✓ Due diligence
Listing remarks
Attention investors: This 3-bedroom, 1-bath single-family home, located in an established Birmingham neighborhood, offers an excellent opportunity to expand your rental portfolio. The property is currently tenant-occupied on a month-to-month lease, providing immediate income potential with added flexibility for future plans. Ideally situated with close proximity to shopping, dining, and key commuter routes, this property presents strong potential for consistent returns and long-term value.
Key facts
- 0.34 acre lot
- Built 1950
- Listed 44 days
Tags
Property features AI
Finance
- Other: Lot size approximately 0.34 acres; Subdivision: WAHOUMA PARK
- Financial info: No investor or income/expense details provided
- HOA & community: No association fee
Exterior
- Parking: Driveway and off-street parking
- Security: No security features listed
- Utilities: Public water; Connected sewer; Electric water heater; Internet service available
- Home design: Existing construction; Siding (other) exterior
- Construction: Crawl space foundation
- Exterior features: No pool; No patio or garden/patio; No decks; Not waterfront; Flood plain: no
Interior
- Kitchen: Electric stove; Laminate countertops
- Bedrooms: Multiple bedrooms on the main level
- Flooring: Carpet
- Bathrooms: One full bathroom with tub/shower combination
- Heating & cooling: Central heating; Central cooling
- Interior features: Carpet floors; Ceilings noted as 'Other (see remarks)'; No additional interior features listed
- Laundry & utility: Main-level laundry room; Washer hookup provided; Electric dryer hookup
Neighborhood map
What this means for you Summary
Snapshot
- This is a 3-bed/1.0-bath single-family listed at $60k.
Deal economics
- At list price, monthly cash flow is $486 ($6k/yr) — positive.
- The deal already cash-flows at list — no discount required.
- Meets the 1% rule at list price ($1k rent vs $60k).
- Recommended offer: $58k (3.0% below list) — sets the bar for market timing.
- Cap rate 16.0% vs local median 6.2% in Birmingham — top-decile yield for the area; either an underpriced asset or a hidden risk that comps aren't pricing in. Stress-test before assuming the spread holds.
Location & tenants
- Location reads 67/100 on livability (#78 in AL) — a middle-class / working-renter tenant base. Strengths: commute A+, cost of living A+, housing A+; Watch: amenities C-, crime F, employment F.
- Birmingham City (urban): math 4% / reading 20% proficiency, ranked #116 of 129 in AL (top 90%) — low school quality limits family demand, transient renter base, plan for 1-2y turnover; 82% free/reduced lunch — lower-income household profile, screen leases tightly.
- Zoned schools: Hayes K8 (math 0% / reading 12%, grade F, #616 of 627 statewide, top 98%, 658 students, 91% FRL); Woodlawn High Schoolmagnet (math 2% / reading 2%, grade F, #291 of 305 statewide, top 100%, 738 students, 91% FRL).
- Market conditions: Rents rising (+1.8%/yr); 130 active listings in the ZIP; 40 comparable units currently listed for rent nearby; rentals lingering (median 46d on market — plan ~5-8 weeks vacancy on turnover, expect pricing pressure); 60% of comp listings sitting > 30 days — soft ceiling on asking rent; lower-income renter base — watch delinquency; 2,114 units permitted in Jefferson County in 2024 (556 in 5+ unit buildings).
- This rent runs 32% of the median local income ($43k/yr) — at the standard rent-burdened threshold; future hikes will face affordability resistance.
Forward outlook
- Local home prices are declining (-3.0%/yr); year-one equity from $415 of loan paydown is wiped out by about $2k of value loss. Plan a longer hold.
- Jefferson County population projected to shrink 4% by 2050 — rents likely to lag national; underwrite the cash flow, not the appreciation.
- At projected returns (-3.0% appreciation + 1.8% rent growth), your $17k cash investment doubles in ~4 years — after that, you're playing with house money.
Negotiation context
- It's been on market 44 days — a 3% lower offer ($58k) is reasonable based on typical stale-listing flexibility.
- Current owner paid $9k; list at $60k implies a 586% gain — meaningful room to come down on a strong offer.
Risks & watch-outs
- Watch-outs: built in 1950 — expect roof / HVAC / electrical / plumbing capex.
- Climate carrying-cost: major wind risk, 27% chance of damaging wind over 30y; extreme-heat days projected 7→19/yr by 2055 (HVAC capex compounding) — expect insurance premiums to compound above CPI over the hold.
Questions for the listing agent
- It's been on market 44 days. Have you received any prior offers? Is the seller open to a 3% concession, seller financing, or rate buy-down credit?
- Built in 1950 — when were the roof, HVAC, electrical panel, plumbing, and water heater last replaced?
- Is there a deadline driving the sale (1031 exchange, divorce, estate, relocation)? That informs how much negotiation room exists.
- Schools are F-rated, which usually means shorter tenancies and higher turnover. Who's the typical renter profile here, and what's been the actual vacancy rate?
- Crime grade is F in this area — have there been break-ins, vandalism, or insurance claims at this property in the last 3 years? What carrier currently insures it and at what premium?
- What's the average days-on-market for RENTAL listings here right now (not sales)? A rising rental-DOM trend means longer vacancies and softer asking-rent achievability than the comps imply.
- What's the recent tenant-quality profile in this submarket — average credit score on applications, eviction rate, late-payment / NSF rate, and stable-employment percentage? A property-management company in the area should have these aggregated.
- How much new for-sale + rental construction is in the pipeline within 1–3 miles? Heavy new supply typically softens prices + rents 12–24 months out; constrained supply supports both.
Investment metrics
- 1% rule
- 1.87% ✓
- Cap rate
- 16.02%
- Cash-on-cash
- 34.74%
- DSCR
- 2.55
- GRM
- 4.5
CMA / ARV
- ARV (median comp)
- $66,784
- List price
- $60,000
- Delta
- -10.16%
- Verdict
- UNDERPRICED
- Comps
- 20 within 1.0 mi
Show comp detail 12 sales within ~0.75 mi
| Address | Dist | Beds/Ba | Sqft | Sold | Price | $/sf | Match |
|---|---|---|---|---|---|---|---|
| 7105 3rd Ave N | 0.28mi | 3/2.0 | 1,231 (+6%) | 11mo | $169,900 | $138 | 64 |
| 6817 Division Ave | 0.57mi | 3/1.0 | 1,104 (-5%) | 3mo | $93,000 | $84 | 62 |
| 7113 3rd Ave N | 0.28mi | 3/2.0 | 1,231 (+6%) | 15mo | $169,900 | $138 | 60 |
| 128 N 68th St | 0.45mi | 3/1.0 | 1,120 (-4%) | 17mo | $68,000 | $61 | 59 |
| 316 72nd St N | 0.23mi | 2/1.0 (-1) | 1,048 (-10%) | 14mo | $54,499 | $52 | 57 |
| 7405 4th Ave N | 0.38mi | 3/1.0 | 1,287 (+11%) | 12mo | $20,000 | $16 | 54 |
| 7209 1st Ave S | 0.63mi | 3/1.0 | 1,202 (+3%) | 14mo | $123,000 | $102 | 53 |
| 220 69th Pl N | 0.32mi | 3/1.0 | 1,000 (-14%) | 13mo | $45,500 | $46 | 51 |
| 6724 S 2nd Ave | 0.73mi | 4/2.0 (+1) | 1,188 (+2%) | 3mo | $113,000 | $95 | 51 |
| 6712 2nd Ave S | 0.74mi | 4/2.5 (+1) | 1,132 (-3%) | 2mo | $149,900 | $132 | 49 |
| 221 72nd St S | 0.74mi | 3/1.0 | 1,015 (-13%) | 2mo | $75,000 | $74 | 43 |
| 7506 1st Ave S | 0.73mi | 4/1.0 (+1) | 1,324 (+14%) | 1mo | $60,000 | $45 | 37 |
Match score weights: distance 35% · size 25% · config 20% · recency 20%. Top-matched comps best support the ARV.
Projected returns pro-forma
-3.0% appreciation · 1.82% rent growth · sell at horizon
- IRR
- 28.9%
- Equity multiple
- 2.19×
- Total profit
- $19,946
- Equity at exit
- $8,946
- IRR
- 35.6%
- Equity multiple
- 4.10×
- Total profit
- $52,013
- Equity at exit
- $5,188
Cash invested: $16,800 (down + closing). Projections, not guarantees.
Landlord ↔ Tenant lean methodology
- Overall (STATE)
- 90 Strongly Landlord-Friendly
- State Alabama
- 90 Strongly Landlord-Friendly · R+15
- County
- — inherits STATE
- City
- — inherits STATE
ZIP-level market 35206
- Home prices YoY
- -32.0%
- Rents YoY
- 1.8%
- Active inventory
- 130
- Price-to-rent
- 4.5×
Monthly cashflow live
- Estimated rent
- $1,122 high interval (Pro) →
- Mortgage (P&I)
- −$315
- Tax from tax record
- −$61 /mo · $726/yr
- Insurance
- −$25
- HOA
- −$0
- Vacancy / Maint / Mgmt
- −$236
- Net cashflow
- $486
Break-even live
Sensitivity live
| Price | -10% $520 | -5% $503 | +0% $486 | +5% $469 | +10% $452 |
|---|---|---|---|---|---|
| Rent | -10% $398 | -5% $442 | +0% $486 | +5% $531 | +10% $575 |
| Rate | -1.0pp $517 | -0.5pp $502 | base $486 | +0.5pp $471 | +1.0pp $455 |
UW: 25.0% down · 7.5% · 30yr · 1.5% tax · 5.0% vac · 8.0% maint · 8.0% mgmt
Financing live
Cash to close
- Down payment
- $15,000
- Closing costs
- $1,800
- Reserves months
- —
- Total cash needed
- —
Loan-product check · same deal, 3 products live
Conventional
25% down · 7.5% · 30yr
- Down + closing
- —
- Monthly P&I
- —
- Monthly cashflow
- —
- DSCR
- —
- Eligible?
- —
Personal DTI + credit; lowest rate.
DSCR
20% down · 8.5% · 30yr
- Down + closing
- —
- Monthly P&I
- —
- Monthly cashflow
- —
- DSCR
- —
- Eligible?
- —
No personal income docs; deal must DSCR.
Hard money
10% down · 12.0% · 12mo
- Down + closing
- —
- Monthly P&I
- —
- Monthly cashflow
- —
- DSCR
- —
- Eligible?
- —
Short-term bridge; refi at stabilization.
Rent comps 40 comps
| Address | Beds | Baths | Sqft | Rent | $/sqft | DOM | Units | Dist |
|---|---|---|---|---|---|---|---|---|
| 224 69th Pl N Birmingham, AL | 3.0 | 1.0 | 894 | $975 | $1.09 | 45d | 1 | 0.33mi |
| 117 67th Pl N Birmingham, AL | 3.0 | 1.0 | 1202 | $800 | $0.67 | 17d | 1 | 0.51mi |
| 7017 Division Ave Birmingham, AL | 3.0 | 1.0 | 1100 | $1,050 | $0.95 | 45d | 1 | 0.53mi |
| 6820 Division Ave Birmingham, AL | 3.0 | 2.0 | 1122 | $1,050 | $0.94 | 25d | 1 | 0.56mi |
| 126 66th Pl N Birmingham, AL | 2.0 | 1.0 | 1038 | $1,200 | $1.16 | 16d | 1 | 0.57mi |
| 7119 1st Ave S Birmingham, AL | 2.0 | 1.0 | 720 | $1,000 | $1.39 | 45d | 1 | 0.61mi |
| 7330 1st Ave S Birmingham, AL | 3.0 | 1.0 | 1299 | $1,000 | $0.77 | 3d | 1 | 0.64mi |
| 201 70th St S Birmingham, AL | 2.0 | 1.0 | 989 | $950 | $0.96 | 45d | 1 | 0.68mi |
| 7005 2nd Ave S Birmingham, AL | 2.0 | 1.0 | 939 | $950 | $1.01 | 45d | 1 | 0.69mi |
| 7129 3rd Ave S Birmingham, AL | 3.0 | 2.0 | 1264 | $1,095 | $0.87 | 5d | 1 | 0.76mi |
| 7025 4th Ave S Birmingham, AL | 3.0 | 1.0 | 1090 | $845 | $0.78 | 45d | 1 | 0.85mi |
| 7728 1st Ave S Apt C Birmingham, AL | 2.0 | 1.0 | 950 | $950 | $1.00 | 45d | 1 | 0.85mi |
| 7721 1st Ave S Birmingham, AL | 3.0 | 1.0 | 956 | $949 | $0.99 | 25d | 1 | 0.88mi |
| 8020 4th Ave N Birmingham, AL | 3.0 | 1.0 | 1200 | $1,200 | $1.00 | 45d | 1 | 0.93mi |
| 7620 4th Ave S Birmingham, AL | 3.0 | 1.0 | 1144 | $1,025 | $0.90 | 45d | 1 | 0.97mi |
| 605 71st St S Birmingham, AL | 3.0 | 1.5 | 1024 | $1,303 | $1.27 | 3d | 1 | 1.00mi |
| 6309 3rd Ave S Birmingham, AL | 4.0 | 2.0 | 1228 | $1,495 | $1.22 | 3d | 1 | 1.07mi |
| 7801 3rd Ave S Unit B Birmingham, AL | 2.0 | 1.5 | 1100 | $1,000 | $0.91 | 45d | 1 | 1.07mi |
| 137 59th St N Unit 3 Birmingham, AL | 2.0 | 1.0 | 800 | $725 | $0.91 | 25d | 1 | 1.08mi |
| 137 59th St N Apt 6 Birmingham, AL | 2.0 | 1.0 | 800 | $725 | $0.91 | 45d | 1 | 1.08mi |
| 6732 Frankfort Ave Birmingham, AL | 3.0 | 1.0 | 924 | $995 | $1.08 | 45d | 1 | 1.08mi |
| 417 Athens Ave Birmingham, AL | 3.0 | 1.5 | 978 | $1,250 | $1.28 | 25d | 1 | 1.08mi |
| 7829 3rd Ave S Birmingham, AL | 3.0 | 1.5 | 1005 | $1,025 | $1.02 | 45d | 1 | 1.11mi |
| 5811 2nd Ave N Birmingham, AL | 2.0 | 1.0 | 1000 | $1,200 | $1.20 | 5d | 1 | 1.13mi |
| 1705 52nd St N Birmingham, AL | 3.0 | 1.5 | 1214 | $1,100 | $0.91 | 45d | 1 | 1.13mi |
| 8021 1st Ave S Unit A Birmingham, AL | 3.0 | 1.0 | 980 | $950 | $0.97 | 25d | 1 | 1.14mi |
| 7815 4th Ave S Birmingham, AL | 3.0 | 2.0 | 1496 | $1,650 | $1.10 | 3d | 1 | 1.15mi |
| 7701 7th Ave S Birmingham, AL | 2.0 | 1.0 | 800 | $850 | $1.06 | 25d | 1 | 1.18mi |
| 7728 Rugby Ave Birmingham, AL | 2.0 | 1.0 | 700 | $850 | $1.21 | 45d | 1 | 1.19mi |
| 6936 66th St S Birmingham, AL | 3.0 | 1.0 | 880 | $1,050 | $1.19 | 45d | 1 | 1.22mi |
| 630 77th St S Birmingham, AL | 2.0 | 2.0 | 1100 | $983 | $0.89 | 4d | 1 | 1.24mi |
| 7740 Rugby Ave Unit 2 Birmingham, AL | 2.0 | 1.0 | 800 | $1,000 | $1.25 | 45d | 1 | 1.25mi |
| 7740 Rugby Ave Unit b Birmingham, AL | 2.0 | 1.0 | 800 | $1,100 | $1.38 | 45d | 1 | 1.25mi |
| 8300 4th Ave N Birmingham, AL | 4.0 | 2.0 | 1455 | $1,300 | $0.89 | 45d | 1 | 1.28mi |
| 8128 2nd Ave S Birmingham, AL | 4.0 | 1.0 | 1390 | $1,150 | $0.83 | 25d | 1 | 1.29mi |
| 8149 1st Ave S Birmingham, AL | 3.0 | 2.0 | 1300 | $1,200 | $0.92 | 45d | 1 | 1.30mi |
| 8129 2nd Ave S Unit B Birmingham, AL | 2.0 | 1.0 | 900 | $800 | $0.89 | 45d | 1 | 1.30mi |
| 8035 4th Ave S Birmingham, AL | 3.0 | 2.0 | 1096 | $1,050 | $0.96 | 45d | 1 | 1.32mi |
| 8333 4th Ave N Birmingham, AL | 4.0 | 2.0 | 1384 | $1,300 | $0.94 | 45d | 1 | 1.36mi |
| 8108 4th Ave S Birmingham, AL | 3.0 | 2.0 | 1384 | $1,200 | $0.87 | 45d | 1 | 1.36mi |
Listing history 15 events
-
2026-06-15status $60,000 Pending 44 DOM
-
2026-06-15days on market $60,000 Active 44 DOM
-
2026-06-13days on market $60,000 Active 42 DOM
-
2026-06-10days on market $60,000 Active 39 DOM
-
2026-06-09days on market $60,000 Active 38 DOM
-
2026-06-08days on market $60,000 Active 37 DOM
-
2026-06-07days on market $60,000 Active 36 DOM
-
2026-06-03days on market $60,000 Active 32 DOM
-
2026-06-02days on market $60,000 Active 31 DOM
-
2026-06-01days on market $60,000 Active 30 DOM
-
2026-05-31days on market $60,000 Active 29 DOM
-
2026-05-02$60,000 Active 494-char remark
-
2007-12-17soldstatus $8,750
-
2002-03-14soldstatus $51,230
-
1992-04-15soldstatus $9,000
ⓘ Source: listings_history table (triggers on properties + properties_extension) + one-shot
backfill from property_details.listing_events for pre-trigger history.
Tax reassessment forecast AL · Resets to sale price
- Current annual tax
- $726 · $61/mo
- Projected year-2 tax
- $726 · $61/mo
- Expected delta
- $0/yr ($0/mo · 0.0%)
ⓘ Screening estimate from a state-policy table — verify with the county assessor before closing.
Climate risk First Street
- Flood 1/10 Low FEMA zone X (unshaded) · 0% chance over 30 yrs
- Wildfire 1/10 Low
- Heat 6/10 Major 7 d/yr ≥106°F today · 19 d/yr by 30 yrs out
- Wind 6/10 Major 27% chance of damaging wind over 30 yrs
- Air quality 5/10 Major 7 unhealthy d/yr today · 9 by 30 yrs out
Nearby sold comps map
Loading sold comps map…
Walkable amenities ~0.75 mi
Loading nearby amenities…
Taxation est. · year 1
- Rental income
- $13,467
- − Mortgage interest
- −$3,361
- − Property taxes
- −$726
- − Insurance
- −$300
- − Repairs & maintenance
- −$1,077
- − Management
- −$1,077
- − Depreciation
- −$1,745
- Taxable income
- $5,179
- Est. tax owed @ 24.0%
- −$1,243
- After-tax cash flow
- $4,594/yr
For passive investors: Depreciation is non-cash, so a rental often shows a tax loss while cash-flowing — sheltering income. Rental losses are passive: they offset passive income freely, and up to $25,000/yr can offset ordinary (W-2) income if you actively participate and your MAGI is under $100k (phasing out to $0 by $150k); unused losses carry forward. On sale, claimed depreciation is recaptured at up to 25%, and gains may owe capital-gains tax (a 1031 exchange can defer both). Figures are a year-1 estimate at your 24.0% rate — not tax advice; consult a CPA.
Schools (NCES district)
- District
- Birmingham City
- NCES district ID
- 0100390
- Math proficiency
- 4% ▼ -17.00%
- Reading proficiency
- 20% ▼ -4.00%
- Median HH income
- $31,988
- Composite
- 9.49/100
- National rank
- #9850
- State rank
- #116 of 129 in AL
Livability — Birmingham
- Score
- 67/100
- State rank
- #78
- US rank
- #10412
Category grades
Schools grade is shown separately in the Schools card above.
Census & demographics
- Census place
- Birmingham, AL
- County
- Jefferson County · 527,445 people
- City population
- 210,422
- Metro
- Birmingham-Hoover, AL
- Population (ZIP)
- 15,621
- Household income
- $42,549
- Rent vs Own
- Severe rent burden
- 1169.0
Population outlook (Jefferson County) Hauer SSP2
- Today (2025)
- 669,185 people
- By 2030
- 669,694 · +0.1%
- By 2040
- 661,388 · -1.2%
- By 2050
- 643,086 · -3.9%
- By 2075
- 577,267 · -13.7%
- By 2100
- 474,758 · -29.1%
Race, ethnicity, and origin ACS 2023
- Neighborhood character
- Predominantly Black (73%)
- Race & ethnicity
- Black 73% White 22% Two or more races 3% Hispanic / Latino 2%
- Common ancestry
- Slovak 1%
- Foreign-born
- 3% · Canada
- Languages at home
- 97% English-only · Spanish 2% Other Indo-European 0%
Political lean MEDSL · Jefferson
- 2024 margin
- D (+10.4) · D 54.6% · R 44.2% · Other 1.2%
- 2008→2024 swing
- +5.4pp toward D · 2008: 5.1pp · 2024: 10.4pp
- All cycles
- 2024: D+10.4 2020: D+13.2 2016: D+7.2 2012: D+6.0 2008: D+5.1
Not yet ingested
- Civics
- —
Market trends
- HPI YoY
- ▼ -68.70%
- Current HPI
- 146.2168
- Rent YoY
- ▲ 1.82%
- Metro
- Birmingham-Hoover, AL
- State GDP YoY
- ▲ 2.94%
- F500 in state
- 4
Industry mix (Fortune 500 HQ in AL)
| Industry | F500 HQs | Revenue |
|---|---|---|
| Financial Services | 1 | $8B |
|
||
| Healthcare | 1 | $5B |
|
||
Price history
+566.7% since first listed5 events — show timeline
- 2026-06-15 Pending — Greater Alabama MLS
- 2026-05-02 Listed $60,000 Greater Alabama MLS
- 2007-12-17 Sold (Public Records) $8,750 Public Records
- 2002-03-14 Sold (Public Records) $51,230 Public Records
- 1992-04-15 Sold (Public Records) $9,000 Public Records
Property tax history
+1.6%/yrLatest (2025): $726 · +0.0% YoY. Source: county tax records.
Cash-flow waterfall
monthlySold comps — $/sqft
last 12 mo · ≤1 miLoading sold comps…