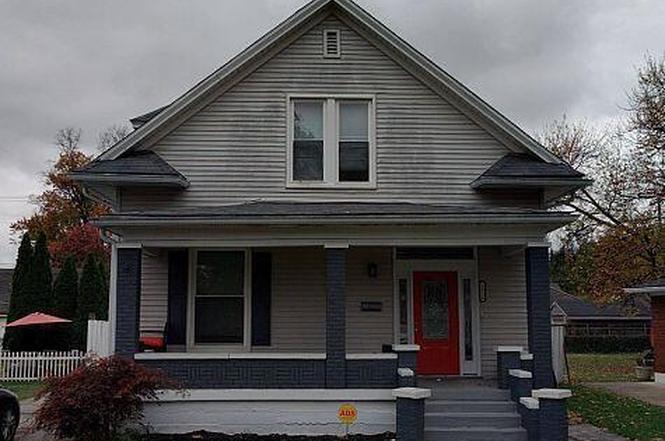
2026 S 16th St · Louisville, KY
Flood risk 6/10 · Moderate
- FEMA flood zone
- X (unshaded)
- Chance of flooding over 30 yrs
- 0.7%
- Est. flood insurance / yr
- $473 – $860
Fire risk 1/10 · Minimal
- Est. fire insurance / yr
- $839 – $1,559
Heat risk 5/10 · Moderate
- Hot days now (above 104°F)
- 7 days/yr
- Hot days in 30 yrs
- 19 days/yr
Wind risk 2/10 · Minimal
- Chance of severe wind over 30 yrs
- 1.0%
Air-quality risk 2/10 · Minimal
- Unhealthy air days now
- 1 days/yr
- Unhealthy air days in 30 yrs
- 3 days/yr
Risk factors via First Street. Map © Google.
Why this score? — see what drove the B grade
The composite is a weighted blend of 9 inputs, each scored 0–100. Each bar is that input's sub-score; the figure is the points it added to the 100-point composite (weight × sub-score).
- Cash flow +22.9/30.0
- ARV discount +15.0/15.0
- Appreciation +10.0/10.0
- DSCR +7.3/10.0
- 1% rule +5.5/10.0
- Rent growth +4.5/5.0
- Livability +3.2/5.0
- Condition / age +2.5/5.0
- Schools +2.3/10.0
$150,000
🖨 Deal sheet (PDF) 📄 Offer letter ✓ Due diligence
Listing remarks
Welcome home to this 3-bedroom, 2 full bath home featuring a first-floor primary suite and a partially finished basement offering additional living or flex space. Sold as-is but priced to sell! The home includes a two-car garage and a functional layout with great potential for customization. This property is a fantastic opportunity for buyers looking to add value. The home qualifies for City, REVERT, and Metro programs, making it an excellent option for owner-occupants, if you qualify for the program. Don't miss the chance to make this home your own—schedule your showing today!
Key facts
- Functional layout
- 6,761 sq ft lot
- 2 garage spots
Tags
Property features AI
Finance
- Other: Subdivision: CONTINENTAL COURT
- HOA & community: No association fee reported
Exterior
- Parking: Detached 2-car garage
- Utilities: Electricity connected; Natural gas available
- Home design: Single-family residence; Cape Cod style; 1 story (listing indicates 1 story); Built in 1920
- Construction: Vinyl siding; Shingle roof; Poured concrete foundation; Above-grade finished area reported as 1,428; Below-grade finished area reported as 550; Below-grade unfinished area reported as 290
- Exterior features: No fencing; Lot dimensions approximately 50 x 135.3
Interior
- Kitchen: Kitchen on the first floor; Dining area adjacent to the kitchen
- Bedrooms: 3 bedrooms total; Primary bedroom on the first floor; Two additional bedrooms on the second floor
- Bathrooms: 2 full bathrooms total; Primary bathroom on the first floor; Full bathroom on the second floor
- Heating & cooling: Forced air heating
- Interior features: Basement (unfinished); 7 total main rooms; 10 total rooms; No fireplaces; Dining area on the first floor; Family room in the basement; Game room in the basement; Living room on the first floor
- Laundry & utility: No first-floor laundry
Neighborhood map
What this means for you Summary
Snapshot
- This is a 3-bed/2.0-bath single-family listed at $150k.
Deal economics
- At list price, monthly cash flow is $263 ($3k/yr) — positive.
- The deal already cash-flows at list — no discount required.
- Meets the 1% rule at list price ($2k rent vs $150k).
- Recommended offer: $141k (6.0% below list) — sets the bar for market timing.
Location & tenants
- Location reads 63/100 on livability (#333 in KY) — a middle-class / working-renter tenant base. Strengths: cost of living A+, housing A+; Watch: employment C-, health & safety D+, crime F.
- Jefferson County (urban): math 19% / reading 35% proficiency, ranked #121 of 165 in KY (top 73%) — low school quality limits family demand, transient renter base, plan for 1-2y turnover.
- Zoned schools: Mcferran Preparatory Academy (math 2% / reading 8%, grade F, #670 of 676 statewide, top 100%, 691 students, 83% FRL); Noe Middle (math 49% / reading 62%, grade B-, #7 of 217 statewide, top 3%, 1,347 students, 46% FRL); Iroquois High (math 12% / reading 8%, grade F, #245 of 254 statewide, top 97%, 1,090 students, 74% FRL).
- Market conditions: Rents rising fast (+8.1%/yr); 93 active listings in the ZIP; 20 comparable units currently listed for rent nearby; rentals at typical pace (median 14d on market — plan ~3-4 weeks tenant-placement turnaround); lower-income renter base — watch delinquency; 2,836 units permitted in Jefferson County in 2024 (1,558 in 5+ unit buildings).
Forward outlook
- In year one you build about $16k of equity ($1k loan paydown + $15k appreciation (10.0% local appreciation)).
- Jefferson County population projected at +13% by 2050 — modest demand growth; plan on rents tracking national, not racing it.
- At projected returns (10.0% appreciation + 8.0% rent growth), your $42k cash investment doubles in ~3 years — after that, you're playing with house money.
- By year 3, paydown + projected appreciation supports a ~$41k cash-out refi (75% LTV) — recoverable capital for the next deal without selling this one.
Negotiation context
- It's been on market 82 days — a 6% lower offer ($141k) is reasonable based on typical stale-listing flexibility.
- 10 sale attempts since 27y ago with the ask held roughly flat each time — persistent listings suggest the price (not the market) is what's stuck; bring a comps-based counter.
- Current owner paid $125k; 20% above their basis — modest negotiation headroom, anchor on the comps not their cost.
Risks & watch-outs
- Watch-outs: built in 1920 — expect roof / HVAC / electrical / plumbing capex.
- Climate carrying-cost: major flood risk; extreme-heat days projected 7→19/yr by 2055 (HVAC capex compounding) — expect insurance premiums to compound above CPI over the hold.
Questions for the listing agent
- It's been on market 82 days. Have you received any prior offers? Is the seller open to a 6% concession, seller financing, or rate buy-down credit?
- Built in 1920 — when were the roof, HVAC, electrical panel, plumbing, and water heater last replaced?
- Why hasn't it sold? Are there any deal-killer items the seller is aware of (foundation, flood, title, zoning, code violations)?
- Is there a deadline driving the sale (1031 exchange, divorce, estate, relocation)? That informs how much negotiation room exists.
- Schools are D-rated, which usually means shorter tenancies and higher turnover. Who's the typical renter profile here, and what's been the actual vacancy rate?
- Crime grade is F in this area — have there been break-ins, vandalism, or insurance claims at this property in the last 3 years? What carrier currently insures it and at what premium?
- What's the average days-on-market for RENTAL listings here right now (not sales)? A rising rental-DOM trend means longer vacancies and softer asking-rent achievability than the comps imply.
- What's the recent tenant-quality profile in this submarket — average credit score on applications, eviction rate, late-payment / NSF rate, and stable-employment percentage? A property-management company in the area should have these aggregated.
- How much new for-sale + rental construction is in the pipeline within 1–3 miles? Heavy new supply typically softens prices + rents 12–24 months out; constrained supply supports both.
Investment metrics
- 1% rule
- 1.05% ✓
- Cap rate
- 8.40%
- Cash-on-cash
- 7.52%
- DSCR
- 1.33
- GRM
- 7.9
CMA / ARV
- ARV (on-the-fly)
- $229,448
- Comps found
- 8
Show comp detail 8 sales within ~0.75 mi
| Address | Dist | Beds/Ba | Sqft | Sold | Price | $/sf | Match |
|---|---|---|---|---|---|---|---|
| 1532 Algonquin Pkwy | 0.06mi | 3/2.5 | 2,135 (+8%) | 12mo | $167,000 | $78 | 72 |
| 1505 Homeview Dr | 0.62mi | 3/2.0 | 1,949 (-2%) | 6mo | $189,000 | $97 | 64 |
| 1840 Algonquin Pkwy | 0.63mi | 2/1.5 (-1) | 1,932 (-2%) | 23mo | $155,000 | $80 | 41 |
| 1210 Lincoln Ave | 0.42mi | 4/2.0 (+1) | 1,700 (-14%) | 14mo | $207,000 | $122 | 40 |
| 2107 Ratcliffe Ave | 0.72mi | 3/2.0 | 1,706 (-14%) | 5mo | $198,000 | $116 | 40 |
| 1844 Bolling Ave | 0.75mi | 3/1.5 | 1,726 (-13%) | 6mo | $155,000 | $90 | 37 |
| 1801 S 22nd St | 0.63mi | 3/1.5 | 1,683 (-15%) | 12mo | $200,000 | $119 | 33 |
| 1731 Kennedy Rd | 0.73mi | 4/1.0 (+1) | 1,774 (-10%) | 8mo | $215,000 | $121 | 33 |
Match score weights: distance 35% · size 25% · config 20% · recency 20%. Top-matched comps best support the ARV.
Projected returns pro-forma
10.0% appreciation · 8.0% rent growth · sell at horizon
- IRR
- 31.8%
- Equity multiple
- 3.54×
- Total profit
- $106,758
- Equity at exit
- $135,132
- IRR
- 29.1%
- Equity multiple
- 8.66×
- Total profit
- $321,796
- Equity at exit
- $291,417
Cash invested: $42,000 (down + closing). Projections, not guarantees.
Landlord ↔ Tenant lean methodology
- Overall (STATE)
- 83 Strongly Landlord-Friendly
- State Kentucky
- 83 Strongly Landlord-Friendly · R+16
- County
- — inherits STATE
- City
- — inherits STATE
ZIP-level market 40210
- Home prices YoY
- 12.1%
- Rents YoY
- 8.1%
- Active inventory
- 93
- Price-to-rent
- 7.9×
Monthly cashflow live
- Estimated rent
- $1,574 high interval (Pro) →
- Mortgage (P&I)
- −$787
- Tax from tax record
- −$131 /mo · $1,577/yr
- Insurance
- −$62
- HOA
- −$0
- Vacancy / Maint / Mgmt
- −$331
- Net cashflow
- $263
Break-even live
Sensitivity live
| Price | -10% $348 | -5% $306 | +0% $263 | +5% $221 | +10% $178 |
|---|---|---|---|---|---|
| Rent | -10% $139 | -5% $201 | +0% $263 | +5% $325 | +10% $387 |
| Rate | -1.0pp $339 | -0.5pp $301 | base $263 | +0.5pp $224 | +1.0pp $185 |
UW: 25.0% down · 7.5% · 30yr · 1.5% tax · 5.0% vac · 8.0% maint · 8.0% mgmt
Financing live
Cash to close
- Down payment
- $37,500
- Closing costs
- $4,500
- Reserves months
- —
- Total cash needed
- —
Loan-product check · same deal, 3 products live
Conventional
25% down · 7.5% · 30yr
- Down + closing
- —
- Monthly P&I
- —
- Monthly cashflow
- —
- DSCR
- —
- Eligible?
- —
Personal DTI + credit; lowest rate.
DSCR
20% down · 8.5% · 30yr
- Down + closing
- —
- Monthly P&I
- —
- Monthly cashflow
- —
- DSCR
- —
- Eligible?
- —
No personal income docs; deal must DSCR.
Hard money
10% down · 12.0% · 12mo
- Down + closing
- —
- Monthly P&I
- —
- Monthly cashflow
- —
- DSCR
- —
- Eligible?
- —
Short-term bridge; refi at stabilization.
Rent comps 20 comps
| Address | Beds | Baths | Sqft | Rent | $/sqft | DOM | Units | Dist |
|---|---|---|---|---|---|---|---|---|
| 1161 Lincoln Ave Louisville, KY | 2.0 | 1.5 | 1358 | $1,150 | $0.85 | 18d | 1 | 0.61mi |
| 1774 Bolling Ave Louisville, KY | 3.0 | 2.0 | 1611 | $1,300 | $0.81 | 12d | 1 | 0.62mi |
| 1774 Bolling Ave Louisville, KY | 3.0 | 2.0 | 1611 | $1,300 | $0.81 | 0d | 1 | 0.62mi |
| 1147 Lincoln Ave Louisville, KY | 4.0 | 1.0 | 1323 | $1,295 | $0.98 | 5d | 1 | 0.66mi |
| 1501 Bellamy Pl Louisville, KY | 2.0–4.0 | 2.0–4.0 | 1074 | $2,217 | $2.06 | 5d | 1 | 0.84mi |
| 516 Colorado Ave Louisville, KY | 3.0 | 2.0 | 2000 | $1,800 | $0.90 | 18d | 1 | 1.00mi |
| 510 Colorado Ave Louisville, KY | 3.0 | 2.0 | 1500 | $1,750 | $1.17 | 25d | 1 | 1.02mi |
| 2 Eutropia Ct Louisville, KY | 3.0 | 2.0 | 1367 | $1,950 | $1.43 | 19d | 1 | 1.12mi |
| 2501 S 4th St Louisville, KY | 1.0–3.0 | 1.0–3.0 | 897 | $6,345 | $7.07 | 5d | 1 | 1.15mi |
| 1705 1/2 Hale Ave Louisville, KY | 3.0 | 2.0 | 1257 | $1,400 | $1.11 | 12d | 1 | 1.19mi |
| 1545 Catalpa St Louisville, KY | 4.0 | 1.5 | 1760 | $1,545 | $0.88 | 5d | 1 | 1.22mi |
| 1479 S 4th St Unit 2A Louisville, KY | 2.0 | 1.0 | 2400 | $2,200 | $0.92 | 18d | 1 | 1.23mi |
| 2117 Osage Ave Louisville, KY | 3.0 | 1.0 | 1924 | $1,460 | $0.76 | 0d | 1 | 1.32mi |
| 2718 S 3rd St Unit 2 Louisville, KY | 4.0 | 2.0 | 2000 | $2,800 | $1.40 | 14d | 1 | 1.33mi |
| 2711 S 3rd St Unit 1 Louisville, KY | 4.0 | 2.0 | 1800 | $2,400 | $1.33 | 14d | 1 | 1.35mi |
| 1618 S 30th St Louisville, KY | 3.0 | 1.0 | 1896 | $1,235 | $0.65 | 18d | 1 | 1.40mi |
| 1445 S 2nd St Unit 3 Louisville, KY | 3.0 | 1.0 | 1290 | $1,500 | $1.16 | 16d | 1 | 1.42mi |
| 1456 Beech St Louisville, KY | 3.0 | 2.0 | 1498 | $1,650 | $1.10 | 0d | 1 | 1.44mi |
| 1847 W Kentucky St Louisville, KY | 2.0 | 1.0 | 1368 | $895 | $0.65 | 5d | 1 | 1.48mi |
| 1461 S 1st St Unit 2 Louisville, KY | 2.0 | 1.0 | 1300 | $1,300 | $1.00 | 22d | 1 | 1.49mi |
Listing history 29 events
-
2026-06-10status $150,000 Pending 82 DOM
-
2026-06-09days on market $150,000 Active 82 DOM
-
2026-06-08days on market $150,000 Active 81 DOM
-
2026-06-07days on market $150,000 Active 80 DOM
-
2026-06-03days on market $150,000 Active 76 DOM
-
2026-06-02days on market $150,000 Active 75 DOM
-
2026-06-01days on market $150,000 Active 74 DOM
-
2026-05-31days on market $150,000 Active 73 DOM
-
2026-04-14status Active
-
2026-02-18status Pending
-
2026-01-21$150,000 Active
-
2019-12-11soldstatus $125,000
-
2019-11-06soldstatus $125,000 Closed
-
2019-10-06$139,900
-
2019-10-06historical
-
2019-10-06price $139,900
-
2017-04-17historical
-
2017-03-10$94,900 Active
-
2009-03-06$19,900
-
2008-12-29historical
-
2008-07-02$19,900
-
2004-06-18soldstatus $75,000
-
2004-04-02$79,000
-
2001-09-05historical
-
2000-11-26historical
-
2000-11-21soldstatus $89,500
-
2000-09-14$87,500
-
2000-07-26$89,900
-
1999-09-22$89,900
ⓘ Source: listings_history table (triggers on properties + properties_extension) + one-shot
backfill from property_details.listing_events for pre-trigger history.
Tax reassessment forecast KY · Resets to sale price
- Current annual tax
- $1,577 · $131/mo
- Projected year-2 tax
- $1,577 · $131/mo
- Expected delta
- $0/yr ($0/mo · 0.0%)
ⓘ Screening estimate from a state-policy table — verify with the county assessor before closing.
Climate risk First Street
- Flood 6/10 Major FEMA zone X (unshaded) · 70% chance over 30 yrs
- Wildfire 1/10 Low
- Heat 5/10 Major 7 d/yr ≥104°F today · 19 d/yr by 30 yrs out
- Wind 2/10 Low 100% chance of damaging wind over 30 yrs
- Air quality 2/10 Low 1 unhealthy d/yr today · 3 by 30 yrs out
Nearby sold comps map
Loading sold comps map…
Walkable amenities ~0.75 mi
Loading nearby amenities…
Taxation est. · year 1
- Rental income
- $18,890
- − Mortgage interest
- −$8,402
- − Property taxes
- −$1,577
- − Insurance
- −$750
- − Repairs & maintenance
- −$1,511
- − Management
- −$1,511
- − Depreciation
- −$4,364
- Taxable income
- $775
- Est. tax owed @ 24.0%
- −$186
- After-tax cash flow
- $2,971/yr
For passive investors: Depreciation is non-cash, so a rental often shows a tax loss while cash-flowing — sheltering income. Rental losses are passive: they offset passive income freely, and up to $25,000/yr can offset ordinary (W-2) income if you actively participate and your MAGI is under $100k (phasing out to $0 by $150k); unused losses carry forward. On sale, claimed depreciation is recaptured at up to 25%, and gains may owe capital-gains tax (a 1031 exchange can defer both). Figures are a year-1 estimate at your 24.0% rate — not tax advice; consult a CPA.
Schools (NCES district)
- District
- Jefferson County
- NCES district ID
- 2102990
- Math proficiency
- 19% ▼ -17.00%
- Reading proficiency
- 35% ▼ -11.00%
- Median HH income
- $47,885
- Composite
- 23.45/100
- National rank
- #7884
- State rank
- #121 of 165 in KY
Livability — Louisville
- Score
- 63/100
- State rank
- #333
- US rank
- #15887
Category grades
Schools grade is shown separately in the Schools card above.
Census & demographics
- Census place
- Louisville, KY
- County
- Jefferson County · 790,184 people
- City population
- 769,292
- Metro
- Louisville/Jefferson County, KY-IN
- Population (ZIP)
- 13,518
- Household income
- $35,347
- Rent vs Own
- Severe rent burden
- 815.0
Population outlook (Jefferson County) Hauer SSP2
- Today (2025)
- 823,112 people
- By 2030
- 849,343 · +3.2%
- By 2040
- 895,696 · +8.8%
- By 2050
- 933,630 · +13.4%
- By 2075
- 1,028,262 · +24.9%
- By 2100
- 1,072,675 · +30.3%
Race, ethnicity, and origin ACS 2023
- Neighborhood character
- Predominantly Black (84%)
- Race & ethnicity
- Black 84% White 8% Two or more races 5% Hispanic / Latino 3%
- Common ancestry
- Iranian 1%
- Foreign-born
- 4% · Canada
- Languages at home
- 93% English-only · Spanish 3%
Political lean MEDSL · Jefferson
- 2024 margin
- D (+16.6) · D 57.4% · R 40.9% · Other 1.7%
- 2008→2024 swing
- +4.5pp toward D · 2008: 12.0pp · 2024: 16.6pp
- All cycles
- 2024: D+16.6 2020: D+20.1 2016: D+13.3 2012: D+11.1 2008: D+12.0
Not yet ingested
- Civics
- —
Market trends
- HPI YoY
- ▲ 28.45%
- Current HPI
- 264.0146
- Rent YoY
- ▲ 8.05%
- Metro
- Louisville/Jefferson County, KY-IN
- State GDP YoY
- ▲ 1.81%
- F500 in state
- 4
Industry mix (Fortune 500 HQ in KY)
| Industry | F500 HQs | Revenue |
|---|---|---|
| Healthcare | 1 | $118B |
|
||
| Food / Beverage | 1 | $7B |
|
||
Price history
+66.9% since first listed21 events — show timeline
- 2026-04-14 Relisted — Metro Search MLS
- 2026-02-18 Pending — Metro Search MLS
- 2026-01-21 Listed $150,000 Metro Search MLS
- 2019-12-11 Sold (Public Records) $125,000 Public Records
- 2019-11-06 Sold (MLS) $125,000 Metro Search MLS
- 2019-10-06 Price Changed $139,900 Metro Search MLS
- 2019-10-06 Listing Removed — Metro Search MLS
- 2019-10-06 Listed $139,900 Metro Search MLS
- 2017-04-17 Listing Removed — Metro Search MLS
- 2017-03-10 Listed $94,900 Metro Search MLS
- 2009-03-06 Listed $19,900 Metro Search MLS
- 2008-12-29 Listing Removed — Metro Search MLS
- 2008-07-02 Listed $19,900 Metro Search MLS
- 2004-06-18 Sold (MLS) $75,000 Metro Search MLS
- 2004-04-02 Listed $79,000 Metro Search MLS
- 2001-09-05 Listing Removed — Metro Search MLS
- 2000-11-26 Listing Removed — Metro Search MLS
- 2000-11-21 Sold (MLS) $89,500 Metro Search MLS
- 2000-09-14 Listed $87,500 Metro Search MLS
- 2000-07-26 Listed $89,900 Metro Search MLS
- 1999-09-22 Listed $89,900 Metro Search MLS
Property tax history
+7.4%/yrLatest (2025): $1,577 · -1.9% YoY. Source: county tax records.
Cash-flow waterfall
monthlySold comps — $/sqft
last 12 mo · ≤1 miLoading sold comps…