 🏷️ Likely Rental
1315 S Porter Ave · Sedalia, MO
Flood risk 1/10 · Minimal
- FEMA flood zone
- X (unshaded)
- Chance of flooding over 30 yrs
- 0.0%
- Est. flood insurance / yr
- $507 – $1,088
Fire risk 2/10 · Minimal
- Est. fire insurance / yr
- $1,054 – $1,958
Heat risk 4/10 · Minor
- Hot days now (above 106°F)
- 7 days/yr
- Hot days in 30 yrs
- 18 days/yr
Wind risk 2/10 · Minimal
- Chance of severe wind over 30 yrs
- —
Air-quality risk 2/10 · Minimal
- Unhealthy air days now
- 0 days/yr
- Unhealthy air days in 30 yrs
- 1 days/yr
Risk factors via First Street. Map © Google.
Why this score? — see what drove the D- grade
The composite is a weighted blend of 9 inputs, each scored 0–100. Each bar is that input's sub-score; the figure is the points it added to the 100-point composite (weight × sub-score).
- ARV discount +15.0/15.0
- Cash flow +6.9/30.0
- Schools +3.9/10.0
- Livability +3.6/5.0
- Rent growth +2.5/5.0
- Condition / age +2.5/5.0
- 1% rule +1.9/10.0
- DSCR +1.1/10.0
- Appreciation +0.0/10.0
$109,900
🖨 Deal sheet 📄 Offer letter ✓ Due diligence
Listing remarks MLS
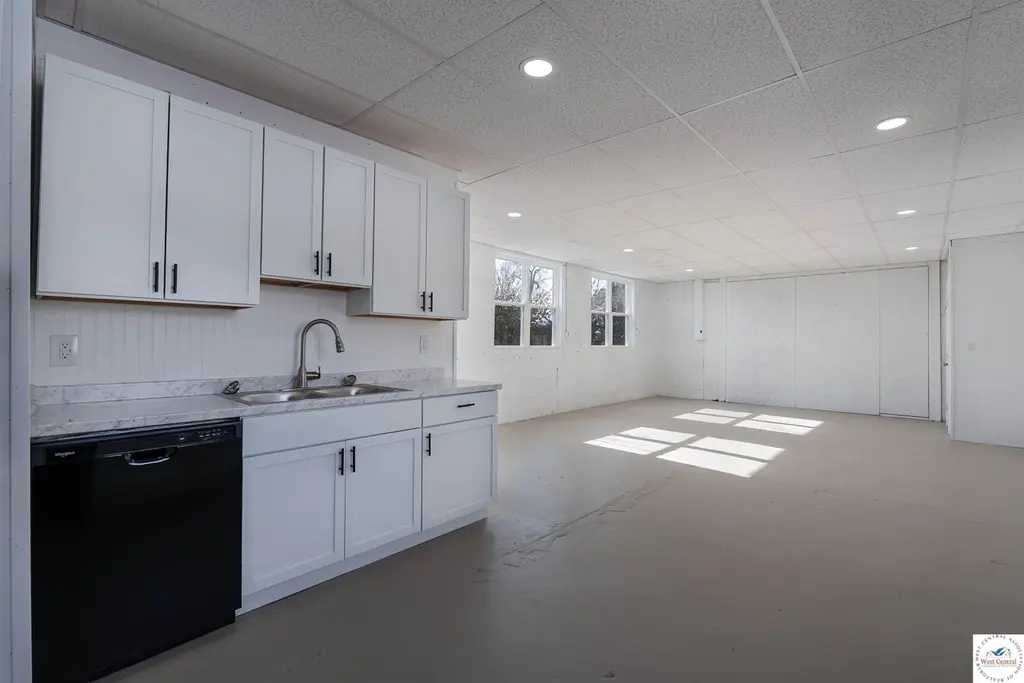
Attention Investors! Don’t miss this remodeled home with strong income potential. A tenant is already secured starting February 15, paying $1,200/month on a one-year lease. A possible 3-bedroom layout makes this a great addition to your portfolio. Turnkey investment—start earning immediately! Close to Centennial park, schools and shopping.
Key facts
- Turnkey investment
- Tenant secured
- Remodeled home
Tags
Neighborhood map
What this means for you Summary
Snapshot
- This is a 1-bed/1.0-bath single-family listed at $110k.
Deal economics
- At list price, monthly cash flow is $-164 ($-2k/yr) — negative.
- To cash-flow at today's rent, offer at most $86k (21.6% below list).
- To meet the 1% rule (rent ≥ 1% of price), the offer needs to be $75k (31.4% below list).
- Recommended offer: $75k (31.4% below list) — sets the bar for 1% rule.
Location & tenants
- Location reads 71/100 on livability (#107 in MO) — a middle-class / working-renter tenant base. Strengths: cost of living A+, housing A+, health & safety A+; Watch: amenities D, crime F, commute F.
- Sedalia 200 (town): math 47% / reading 46% proficiency, ranked #89 of 324 in MO (top 28%) — families likely to look elsewhere, expect single-tenant / working-renter base with shorter leases.
- Market conditions: 213 active listings in the ZIP; 1 comparable units currently listed for rent nearby; 109 units permitted in Pettis County in 2024 (46 in 5+ unit buildings).
- This rent is only 16% of the median local income ($58k/yr) — well below the 30% rent-burden line; pricing power to push rent on renewal without tenant pushback.
Forward outlook
- Local home prices are declining (-3.0%/yr); year-one equity from $760 of loan paydown is wiped out by about $3k of value loss. Plan a longer hold.
- Pettis County population projected to shrink 7% by 2050 — rents likely to lag national; underwrite the cash flow, not the appreciation.
Negotiation context
- It's been on market 134 days — a 12% lower offer ($97k) is reasonable based on typical stale-listing flexibility.
- 6 sale attempts since 4y ago; this cycle's ask has dropped $30k (21%) from the opening price — seller is motivated, your offer sets the floor, not the list.
Risks & watch-outs
- Watch-outs: built in 1935 — expect roof / HVAC / electrical / plumbing capex.
Questions for the listing agent
- What do current leases actually rent for vs. the listed asking? Can we see a recent rent roll and the last 12 months of T-12 income?
- It's been on market 134 days. Have you received any prior offers? Is the seller open to a 31% concession, seller financing, or rate buy-down credit?
- Built in 1935 — when were the roof, HVAC, electrical panel, plumbing, and water heater last replaced?
- Why hasn't it sold? Are there any deal-killer items the seller is aware of (foundation, flood, title, zoning, code violations)?
- Is there a deadline driving the sale (1031 exchange, divorce, estate, relocation)? That informs how much negotiation room exists.
- Crime grade is F in this area — have there been break-ins, vandalism, or insurance claims at this property in the last 3 years? What carrier currently insures it and at what premium?
- The area grade is low — what's the realistic commute time and amenity access for the typical tenant pool here? Any planned neighborhood developments (good or bad) we should know about?
- What's the average days-on-market for RENTAL listings here right now (not sales)? A rising rental-DOM trend means longer vacancies and softer asking-rent achievability than the comps imply.
- What's the recent tenant-quality profile in this submarket — average credit score on applications, eviction rate, late-payment / NSF rate, and stable-employment percentage? A property-management company in the area should have these aggregated.
- How much new for-sale + rental construction is in the pipeline within 1–3 miles? Heavy new supply typically softens prices + rents 12–24 months out; constrained supply supports both.
Investment metrics
- 1% rule
- 0.69% ✗
- Cap rate
- 4.50%
- Cash-on-cash
- -6.41%
- DSCR
- 0.71
- GRM
- 12.2
CMA / ARV
- ARV (median comp)
- $164,999
- List price
- $109,900
- Delta
- -33.39%
- Verdict
- UNDERPRICED
- Comps
- 20 within 1.0 mi
Projected returns pro-forma
-3.0% appreciation · 3.0% rent growth · sell at horizon
- IRR
- -27.3%
- Equity multiple
- 0.08×
- Total profit
- $-28,264
- Equity at exit
- $16,386
- IRR
- -25.4%
- Equity multiple
- -0.24×
- Total profit
- $-38,042
- Equity at exit
- $9,502
Cash invested: $30,772 (down + closing). Projections, not guarantees.
Landlord ↔ Tenant lean methodology
- Overall (STATE)
- 81 Strongly Landlord-Friendly
- State Missouri
- 81 Strongly Landlord-Friendly · R+10
- County
- — inherits STATE
- City
- — inherits STATE
ZIP-level market 65301
- Home prices YoY
- -21.8%
- Active inventory
- 213
- Price-to-rent
- 12.2×
Monthly cashflow live
- Estimated rent
- $753 medium interval (Pro) →
- Mortgage (P&I)
- −$576
- Tax est. 1.5%
- −$137 /mo · $1,648/yr
- Insurance
- −$46
- HOA
- −$0
- Vacancy / Maint / Mgmt
- −$158
- Net cashflow
- $-164
Break-even live
UW: 25.0% down · 7.5% · 30yr · 1.5% tax · 5.0% vac · 8.0% maint · 8.0% mgmt
Financing live
Cash to close
- Down payment
- $27,475
- Closing costs
- $3,297
- Reserves months
- —
- Total cash needed
- —
Loan-product check · same deal, 3 products live
Conventional
25% down · 7.5% · 30yr
- Down + closing
- —
- Monthly P&I
- —
- Monthly cashflow
- —
- DSCR
- —
- Eligible?
- —
Personal DTI + credit; lowest rate.
DSCR
20% down · 8.5% · 30yr
- Down + closing
- —
- Monthly P&I
- —
- Monthly cashflow
- —
- DSCR
- —
- Eligible?
- —
No personal income docs; deal must DSCR.
Hard money
10% down · 12.0% · 12mo
- Down + closing
- —
- Monthly P&I
- —
- Monthly cashflow
- —
- DSCR
- —
- Eligible?
- —
Short-term bridge; refi at stabilization.
Rent comps 1 comps
| Address | Beds | Baths | Sqft | Rent | $/sqft | DOM | Units | Dist |
|---|---|---|---|---|---|---|---|---|
| 420 W 7th St Apt 2 Sedalia, MO | — | 1.0 | 386 | $700 | $1.81 | 44d | 1 | 1.30mi |
Listing history 33 events
-
2026-06-19days on market $109,900 Active 134 DOM
-
2026-06-18days on market $109,900 Active 133 DOM
-
2026-06-17days on market $109,900 Active 132 DOM
-
2026-06-16days on market $109,900 Active 131 DOM
-
2026-06-15days on market $109,900 Active 130 DOM
-
2026-06-14days on market $109,900 Active 128 DOM
-
2026-06-12days on market $109,900 Active 127 DOM
-
2026-06-09days on market $109,900 Active 124 DOM
-
2026-06-08days on market $109,900 Active 123 DOM
-
2026-06-07days on market $109,900 Active 122 DOM
-
2026-06-05days on market $109,900 Active 119 DOM
-
2026-06-03days on market $109,900 Active 118 DOM
-
2026-06-02days on market $109,900 Active 117 DOM
-
2026-06-01days on market $109,900 Active 116 DOM
-
2026-05-31days on market $109,900 Active 115 DOM
-
2026-05-30days on market $109,900 Active 114 DOM
-
2026-05-12price $109,900 353-char remark
Show marketing remark (353 chars)
Attention Investors! Don’t miss this remodeled home with strong income potential. A tenant is already secured starting February 15, paying $1,200/month on a one-year lease. A possible 3-bedroom layout makes this a great addition to your portfolio. Turnkey investment—start earning immediately! Close to Centennial park, schools and shopping.
-
2026-03-24price $115,000 353-char remark
Show marketing remark (353 chars)
Attention Investors! Don’t miss this remodeled home with strong income potential. A tenant is already secured starting February 15, paying $1,200/month on a one-year lease. A possible 3-bedroom layout makes this a great addition to your portfolio. Turnkey investment—start earning immediately! Close to Centennial park, schools and shopping.
-
2026-03-24price $115,900 353-char remark
Show marketing remark (353 chars)
Attention Investors! Don’t miss this remodeled home with strong income potential. A tenant is already secured starting February 15, paying $1,200/month on a one-year lease. A possible 3-bedroom layout makes this a great addition to your portfolio. Turnkey investment—start earning immediately! Close to Centennial park, schools and shopping.
-
2026-03-04price $119,900 353-char remark
Show marketing remark (353 chars)
Attention Investors! Don’t miss this remodeled home with strong income potential. A tenant is already secured starting February 15, paying $1,200/month on a one-year lease. A possible 3-bedroom layout makes this a great addition to your portfolio. Turnkey investment—start earning immediately! Close to Centennial park, schools and shopping.
-
2026-02-17price $129,900 353-char remark
Show marketing remark (353 chars)
Attention Investors! Don’t miss this remodeled home with strong income potential. A tenant is already secured starting February 15, paying $1,200/month on a one-year lease. A possible 3-bedroom layout makes this a great addition to your portfolio. Turnkey investment—start earning immediately! Close to Centennial park, schools and shopping.
-
2026-02-05$139,900 Active 353-char remark
Show marketing remark (353 chars)
Attention Investors! Don’t miss this remodeled home with strong income potential. A tenant is already secured starting February 15, paying $1,200/month on a one-year lease. A possible 3-bedroom layout makes this a great addition to your portfolio. Turnkey investment—start earning immediately! Close to Centennial park, schools and shopping.
-
2024-05-14status Active
-
2024-04-17status Pending
-
2023-12-28status Active
-
2023-11-16price $50,000
-
2023-09-11status Active
-
2023-08-09$65,000 Active
-
2022-09-26soldstatus Closed
-
2022-08-12$20,000 Active
-
2005-07-01soldstatus
-
1990-05-09soldstatus
-
1985-05-02soldstatus
ⓘ Source: listings_history table (triggers on properties + properties_extension) + one-shot
backfill from property_details.listing_events for pre-trigger history.
Climate risk First Street
- Flood 1/10 Low FEMA zone X (unshaded) · 0% chance over 30 yrs
- Wildfire 2/10 Low
- Heat 4/10 Moderate 7 d/yr ≥106°F today · 18 d/yr by 30 yrs out
- Wind 2/10 Low
- Air quality 2/10 Low 0 unhealthy d/yr today · 1 by 30 yrs out
Nearby sold comps map
Loading sold comps map…
Walkable amenities ~0.75 mi
Loading nearby amenities…
Taxation est. · year 1
- Rental income
- $9,040
- − Mortgage interest
- −$6,156
- − Property taxes
- −$1,648
- − Insurance
- −$550
- − Repairs & maintenance
- −$723
- − Management
- −$723
- − Depreciation
- −$3,197
- Taxable loss
- −$3,957
- Est. tax savings @ 24.0%
- +$950
- After-tax cash flow
- $-1,022/yr
For passive investors: Depreciation is non-cash, so a rental often shows a tax loss while cash-flowing — sheltering income. Rental losses are passive: they offset passive income freely, and up to $25,000/yr can offset ordinary (W-2) income if you actively participate and your MAGI is under $100k (phasing out to $0 by $150k); unused losses carry forward. On sale, claimed depreciation is recaptured at up to 25%, and gains may owe capital-gains tax (a 1031 exchange can defer both). Figures are a year-1 estimate at your 24.0% rate — not tax advice; consult a CPA.
Schools (NCES district)
- District
- Sedalia 200
- NCES district ID
- 2927830
- Math proficiency
- 47% ▼ -1.00%
- Reading proficiency
- 46% ▼ -3.00%
- Median HH income
- $37,452
- Composite
- 38.7/100
- National rank
- #4141
- State rank
- #89 of 324 in MO
Livability — Sedalia
- Score
- 71/100
- State rank
- #107
- US rank
- #6990
Category grades
Schools grade is shown separately in the Schools card above.
Census & demographics
- Census place
- Sedalia, MO
- County
- Pettis County · 35,091 people
- City population
- 35,091
- Metro
- Sedalia, MO
- Population (ZIP)
- 35,091
- Household income
- $58,064
- Rent vs Own
- Severe rent burden
- 1021.0
Population outlook (Pettis County) Hauer SSP2
- Today (2025)
- 41,992 people
- By 2030
- 41,584 · -1.0%
- By 2040
- 40,483 · -3.6%
- By 2050
- 39,049 · -7.0%
- By 2075
- 35,413 · -15.7%
- By 2100
- 30,870 · -26.5%
Race, ethnicity, and origin ACS 2023
- Neighborhood character
- Predominantly White (81%)
- Race & ethnicity
- White 81% Hispanic / Latino 10% Two or more races 7% Black 3%
- Hispanic origin (detail)
- Mexican 8%
- Common ancestry
- Subsaharan African 3% Lithuanian 2% Italian 1%
- Foreign-born
- 7% · Canada
- Languages at home
- 87% English-only · Spanish 7% Russian/Polish/Slavic 4% German/W. Germanic 1%
Political lean MEDSL · Pettis
- 2024 margin
- Solid R (+48.8) · D 24.9% · R 73.7% · Other 1.4%
- 2008→2024 swing
- -26.3pp toward R · 2008: -22.4pp · 2024: -48.8pp
- All cycles
- 2024: R+48.8 2020: R+47.5 2016: R+46.9 2012: R+28.8 2008: R+22.4
Not yet ingested
- Civics
- —
Market trends
- HPI YoY
- ▼ -81.80%
- Current HPI
- 292.8224
- Rent YoY
- —
- Metro
- Sedalia, MO
- State GDP YoY
- ▲ 1.84%
- F500 in state
- 20
Industry mix (Fortune 500 HQ in MO)
| Industry | F500 HQs | Revenue |
|---|---|---|
| Healthcare | 1 | $163B |
|
||
| Insurance | 1 | $21B |
|
||
| Industrial Technology | 1 | $17B |
|
||
| Retail | 1 | $16B |
|
||
| Industrial Distribution | 1 | $10B |
|
||
| Utilities | 1 | $9B |
|
||
Price history
+449.5% since first listed17 events — show timeline
- 2026-05-12 Price Changed $109,900 WCAR
- 2026-03-24 Price Changed $115,000 WCAR
- 2026-03-24 Price Changed $115,900 WCAR
- 2026-03-04 Price Changed $119,900 WCAR
- 2026-02-17 Price Changed $129,900 WCAR
- 2026-02-05 Listed $139,900 WCAR
- 2024-05-14 Relisted — WCAR
- 2024-04-17 Pending — WCAR
- 2023-12-28 Relisted — WCAR
- 2023-11-16 Price Changed $50,000 WCAR
- 2023-09-11 Relisted — WCAR
- 2023-08-09 Listed $65,000 WCAR
- 2022-09-26 Sold (MLS) — WCAR
- 2022-08-12 Listed $20,000 WCAR
- 2005-07-01 Sold (Public Records) — Public Records
- 1990-05-09 Sold (Public Records) — Public Records
- 1985-05-02 Sold (Public Records) — Public Records
Property tax history
-0.3%/yrLatest (2025): $131 · +3.8% YoY. Source: county tax records.
Cash-flow waterfall
monthlySold comps — $/sqft
last 12 mo · ≤1 miLoading sold comps…