819 Broadway St · Slater, MO
Flood risk 1/10 · Minimal
- FEMA flood zone
- X (unshaded)
- Chance of flooding over 30 yrs
- 0.0%
- Est. flood insurance / yr
- $507 – $1,088
Fire risk 1/10 · Minimal
- Est. fire insurance / yr
- $1,054 – $1,958
Heat risk 4/10 · Minor
- Hot days now (above 107°F)
- 7 days/yr
- Hot days in 30 yrs
- 17 days/yr
Wind risk 2/10 · Minimal
- Chance of severe wind over 30 yrs
- —
Air-quality risk 2/10 · Minimal
- Unhealthy air days now
- 1 days/yr
- Unhealthy air days in 30 yrs
- 1 days/yr
Risk factors via First Street. Map © Google.
Why this score? — see what drove the C- grade
The composite is a weighted blend of 9 inputs, each scored 0–100. Each bar is that input's sub-score; the figure is the points it added to the 100-point composite (weight × sub-score).
- Cash flow +16.0/30.0
- Appreciation +8.3/10.0
- ARV discount +7.5/15.0
- DSCR +5.0/10.0
- 1% rule +3.6/10.0
- Livability +3.3/5.0
- Rent growth +2.5/5.0
- Condition / age +2.5/5.0
- Schools +2.4/10.0
$120,000
🖨 Deal sheet (PDF) 📄 Offer letter ✓ Due diligence
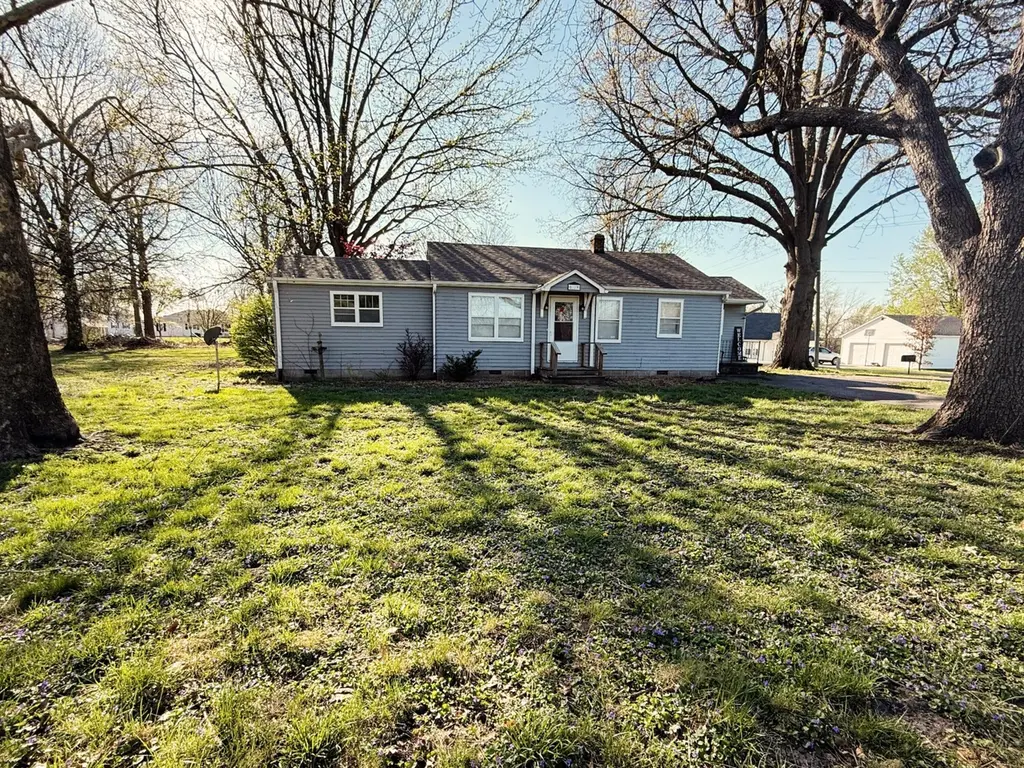
Listing remarks MLS
This is a nice 2 bedroom home sitting on a large corner lot in Slater. New carpet and paint through out. Includes a 2 car detached garage with extra storage.
Key facts
- Large yard
- Large living room
- Bonus den
Tags
Property features AI
Exterior
- Parking: 2-car garage
- Home design: Single-family residence; One story; Residential property
- Construction: Above-grade finished area: 1,276
- Exterior features: Lot roughly 120 x 140; Residential zoning
Interior
- Kitchen: Range; Oven; Refrigerator
- Heating & cooling: Has heating
- Interior features: Fireplace; 7 total rooms
- Laundry & utility: Washer; Dryer
Neighborhood map
What this means for you Summary
Snapshot
- This is a 2-bed/1.0-bath other listed at $120k.
Deal economics
- At list price, monthly cash flow is $60 ($724/yr) — positive.
- The deal already cash-flows at list — no discount required.
- To meet the 1% rule (rent ≥ 1% of price), the offer needs to be $103k (14.2% below list).
- Recommended offer: $103k (14.2% below list) — sets the bar for 1% rule.
Location & tenants
- Location reads 66/100 on livability (#241 in MO) — a middle-class / working-renter tenant base. Strengths: cost of living A+, housing A+, crime B; Watch: schools F, amenities F, commute F.
- Slater (rural): math 15% / reading 35% proficiency, ranked #492 of 535 in MO (top 92%) — low school quality limits family demand, transient renter base, plan for 1-2y turnover.
- Market conditions: 14 active listings in the ZIP; 11 units permitted in Saline County in 2024 (0 in 5+ unit buildings).
Forward outlook
- In year one you build about $9k of equity ($830 loan paydown + $8k appreciation (6.6% local appreciation)).
- Saline County population projected to shrink 7% by 2050 — rents likely to lag national; underwrite the cash flow, not the appreciation.
- At projected returns (6.6% appreciation + 3.0% rent growth), your $34k cash investment doubles in ~4 years — after that, you're playing with house money.
- By year 5, paydown + projected appreciation supports a ~$39k cash-out refi (75% LTV) — recoverable capital for the next deal without selling this one.
Negotiation context
- Only 4 days on market — expect competitive offers; lowballing is unlikely to land.
- 3 sale attempts since 4y ago with the ask held roughly flat each time — persistent listings suggest the price (not the market) is what's stuck; bring a comps-based counter.
Risks & watch-outs
- Watch-outs: built in 1949 — expect roof / HVAC / electrical / plumbing capex.
Questions for the listing agent
- Built in 1949 — when were the roof, HVAC, electrical panel, plumbing, and water heater last replaced?
- Is there a deadline driving the sale (1031 exchange, divorce, estate, relocation)? That informs how much negotiation room exists.
- Schools are F-rated, which usually means shorter tenancies and higher turnover. Who's the typical renter profile here, and what's been the actual vacancy rate?
- What's the average days-on-market for RENTAL listings here right now (not sales)? A rising rental-DOM trend means longer vacancies and softer asking-rent achievability than the comps imply.
- What's the recent tenant-quality profile in this submarket — average credit score on applications, eviction rate, late-payment / NSF rate, and stable-employment percentage? A property-management company in the area should have these aggregated.
- How much new for-sale + rental construction is in the pipeline within 1–3 miles? Heavy new supply typically softens prices + rents 12–24 months out; constrained supply supports both.
Investment metrics
- 1% rule
- 0.86% ✗
- Cap rate
- 6.90%
- Cash-on-cash
- 2.15%
- DSCR
- 1.10
- GRM
- 9.7
CMA / ARV
No comps found within radius.
Projected returns pro-forma
6.58% appreciation · 3.0% rent growth · sell at horizon
- IRR
- 18.4%
- Equity multiple
- 2.27×
- Total profit
- $42,606
- Equity at exit
- $79,851
- IRR
- 17.8%
- Equity multiple
- 4.61×
- Total profit
- $121,304
- Equity at exit
- $148,777
Cash invested: $33,600 (down + closing). Projections, not guarantees.
Landlord ↔ Tenant lean methodology
- Overall (STATE)
- 81 Strongly Landlord-Friendly
- State Missouri
- 81 Strongly Landlord-Friendly · R+10
- County
- — inherits STATE
- City
- — inherits STATE
ZIP-level market 65349
- Home prices YoY
- 5.3%
- Active inventory
- 14
- Price-to-rent
- 9.7×
Monthly cashflow live
- Estimated rent
- $1,030 medium interval (Pro) →
- Mortgage (P&I)
- −$629
- Tax from tax record
- −$74 /mo · $891/yr
- Insurance
- −$50
- HOA
- −$0
- Vacancy / Maint / Mgmt
- −$216
- Net cashflow
- $60
Break-even live
Sensitivity live
| Price | -10% $128 | -5% $94 | +0% $60 | +5% $26 | +10% $-8 |
|---|---|---|---|---|---|
| Rent | -10% $-21 | -5% $20 | +0% $60 | +5% $101 | +10% $142 |
| Rate | -1.0pp $121 | -0.5pp $91 | base $60 | +0.5pp $29 | +1.0pp $-2 |
UW: 25.0% down · 7.5% · 30yr · 1.5% tax · 5.0% vac · 8.0% maint · 8.0% mgmt
Financing live
Cash to close
- Down payment
- $30,000
- Closing costs
- $3,600
- Reserves months
- —
- Total cash needed
- —
Loan-product check · same deal, 3 products live
Conventional
25% down · 7.5% · 30yr
- Down + closing
- —
- Monthly P&I
- —
- Monthly cashflow
- —
- DSCR
- —
- Eligible?
- —
Personal DTI + credit; lowest rate.
DSCR
20% down · 8.5% · 30yr
- Down + closing
- —
- Monthly P&I
- —
- Monthly cashflow
- —
- DSCR
- —
- Eligible?
- —
No personal income docs; deal must DSCR.
Hard money
10% down · 12.0% · 12mo
- Down + closing
- —
- Monthly P&I
- —
- Monthly cashflow
- —
- DSCR
- —
- Eligible?
- —
Short-term bridge; refi at stabilization.
Listing history 7 events
-
2026-04-28status Pending
-
2026-04-28status Active
-
2026-04-13status Pending
-
2026-04-09$120,000 Active
-
2022-10-24soldstatus
-
2022-10-21soldstatus Closed 158-char remark
Show marketing remark (158 chars)
This is a nice 2 bedroom home sitting on a large corner lot in Slater. New carpet and paint through out. Includes a 2 car detached garage with extra storage.
-
2022-08-15$84,500 158-char remark
Show marketing remark (158 chars)
This is a nice 2 bedroom home sitting on a large corner lot in Slater. New carpet and paint through out. Includes a 2 car detached garage with extra storage.
ⓘ Source: listings_history table (triggers on properties + properties_extension) + one-shot
backfill from property_details.listing_events for pre-trigger history.
Tax reassessment forecast MO · Resets to sale price
- Current annual tax
- $891 · $74/mo
- Projected year-2 tax
- $1,164 · $97/mo
- Expected delta
- +$273/yr (+$23/mo · 30.7%)
ⓘ Screening estimate from a state-policy table — verify with the county assessor before closing.
Climate risk First Street
- Flood 1/10 Low FEMA zone X (unshaded) · 0% chance over 30 yrs
- Wildfire 1/10 Low
- Heat 4/10 Moderate 7 d/yr ≥107°F today · 17 d/yr by 30 yrs out
- Wind 2/10 Low
- Air quality 2/10 Low 1 unhealthy d/yr today · 1 by 30 yrs out
Nearby sold comps map
Loading sold comps map…
Walkable amenities ~0.75 mi
Loading nearby amenities…
Taxation est. · year 1
- Rental income
- $12,362
- − Mortgage interest
- −$6,722
- − Property taxes
- −$891
- − Insurance
- −$600
- − Repairs & maintenance
- −$989
- − Management
- −$989
- − Depreciation
- −$3,491
- Taxable loss
- −$1,319
- Est. tax savings @ 24.0%
- +$317
- After-tax cash flow
- $1,040/yr
For passive investors: Depreciation is non-cash, so a rental often shows a tax loss while cash-flowing — sheltering income. Rental losses are passive: they offset passive income freely, and up to $25,000/yr can offset ordinary (W-2) income if you actively participate and your MAGI is under $100k (phasing out to $0 by $150k); unused losses carry forward. On sale, claimed depreciation is recaptured at up to 25%, and gains may owe capital-gains tax (a 1031 exchange can defer both). Figures are a year-1 estimate at your 24.0% rate — not tax advice; consult a CPA.
Schools (NCES district)
- District
- Slater
- NCES district ID
- 2928360
- Math proficiency
- 15% ▬ 0.00%
- Reading proficiency
- 35% ▬ 0.00%
- Median HH income
- $36,330
- Composite
- 23.75/100
- National rank
- #13230
- State rank
- #492 of 535 in MO
Livability — Slater
- Score
- 66/100
- State rank
- #241
- US rank
- #11842
Category grades
Schools grade is shown separately in the Schools card above.
Census & demographics
- Census place
- Slater, MO
- Population (ZIP)
- 2,562
Population outlook (Saline County) Hauer SSP2
- Today (2025)
- 22,716 people
- By 2030
- 22,343 · -1.6%
- By 2040
- 21,596 · -4.9%
- By 2050
- 21,171 · -6.8%
- By 2075
- 20,680 · -9.0%
- By 2100
- 20,147 · -11.3%
Race, ethnicity, and origin ACS 2023
- Neighborhood character
- Predominantly White (78%)
- Race & ethnicity
- White 78% Black 11% Hispanic / Latino 8% Two or more races 3% Asian 2%
- Hispanic origin (detail)
- Mexican 8%
- Common ancestry
- Iranian 1% Slovak 1% Serbian 1%
- Foreign-born
- 4% · Canada, China, Dominican Republic
- Languages at home
- 95% English-only · Spanish 4% Chinese 1%
Political lean MEDSL · Saline
- 2024 margin
- Solid R (+40.4) · D 29.2% · R 69.7% · Other 1.1%
- 2008→2024 swing
- -37.9pp toward R · 2008: -2.5pp · 2024: -40.4pp
- All cycles
- 2024: R+40.4 2020: R+37.3 2016: R+34.5 2012: R+14.4 2008: R+2.5
Not yet ingested
- Civics
- —
Market trends
- HPI YoY
- ▲ 6.58%
- Current HPI
- 130.9992
- Rent YoY
- —
- Metro
- —
- State GDP YoY
- ▲ 1.84%
- F500 in state
- 20
Industry mix (Fortune 500 HQ in MO)
| Industry | F500 HQs | Revenue |
|---|---|---|
| Healthcare | 1 | $163B |
|
||
| Insurance | 1 | $21B |
|
||
| Industrial Technology | 1 | $17B |
|
||
| Retail | 1 | $16B |
|
||
| Industrial Distribution | 1 | $10B |
|
||
| Utilities | 1 | $9B |
|
||
Price history
+42.0% since first listed7 events — show timeline
- 2026-04-28 Pending — CMBR
- 2026-04-28 Relisted — CMBR
- 2026-04-13 Pending — CMBR
- 2026-04-09 Listed $120,000 CMBR
- 2022-10-24 Sold (Public Records) — Public Records
- 2022-10-21 Sold (MLS) — CMBR
- 2022-08-15 Listed $84,500 CMBR
Property tax history
+4.7%/yrLatest (2025): $891 · +14.4% YoY. Source: county tax records.
Cash-flow waterfall
monthlySold comps — $/sqft
last 12 mo · ≤1 miLoading sold comps…