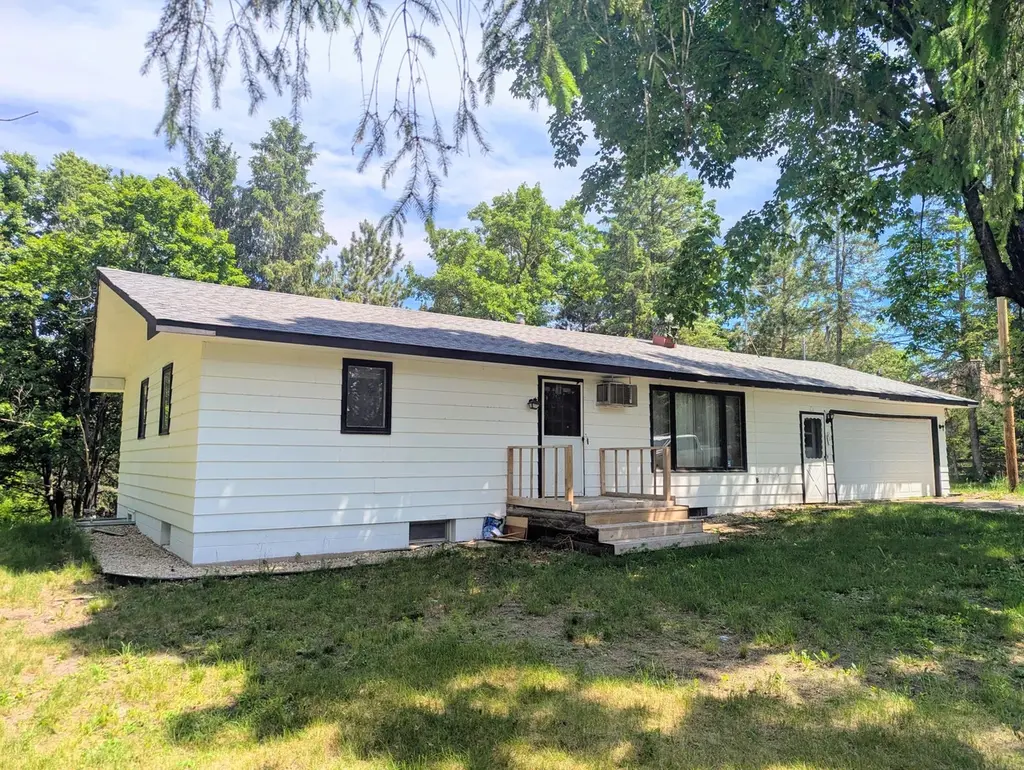
14410 261st Ave NW · Zimmerman, MN
Flood risk 1/10 · Minimal
- FEMA flood zone
- X (unshaded)
- Chance of flooding over 30 yrs
- 0.0%
- Est. flood insurance / yr
- $473 – $860
Fire risk 5/10 · Moderate
- Est. fire insurance / yr
- $888 – $1,650
Heat risk 2/10 · Minimal
- Hot days now (above 98°F)
- 7 days/yr
- Hot days in 30 yrs
- 13 days/yr
Wind risk 2/10 · Minimal
- Chance of severe wind over 30 yrs
- —
Air-quality risk 3/10 · Minor
- Unhealthy air days now
- 3 days/yr
- Unhealthy air days in 30 yrs
- 3 days/yr
Risk factors via First Street. Map © Google.
Why this score? — see what drove the D- grade
The composite is a weighted blend of 9 inputs, each scored 0–100. Each bar is that input's sub-score; the figure is the points it added to the 100-point composite (weight × sub-score).
- Cash flow +11.1/30.0
- ARV discount +7.5/15.0
- Schools +5.2/10.0
- Livability +3.9/5.0
- DSCR +3.2/10.0
- 1% rule +2.8/10.0
- Rent growth +2.5/5.0
- Condition / age +2.5/5.0
- Appreciation +0.0/10.0
$225,000
🖨 Deal sheet (PDF) 📄 Offer letter ✓ Due diligence
Listing remarks
Fantastic Equity-Builder Opportunity in the Heart of Zimmerman! Situated on 2.16-acres with two separate Parcel ID's, this 1966-built one-story home offers acreage privacy right outside of town. Perfect for investors or handy buyers looking to build sweat equity, the property features a functional floor plan with great bones and several updates already completed, including a newer roof, flooring, bathroom tile, and a lower-level bedroom egress window. Totaling 1,824 square feet, the layout includes 3 conforming bedrooms and an additional non-conforming 4th bedroom downstairs, all waiting for your finishing touches. The home is being sold AS-IS by an owner who has never occupied the propert
Key facts
- Newer roof
- Acreage privacy
- Bathroom tile
Tags
Property features AI
Finance
- Financial info: Taxes listed separately
Exterior
- Parking: Attached garage with automatic door opener; 2-car garage (approximately 25 x 22, 7' door height, 16' door width)
- Utilities: Well water; Propane fuel; 100 amp electrical service; Septic system (not compliant)
- Home design: Residential property; One level; Total building area approximately 1,824 square feet
- Construction: Block foundation; Roof age 8 years or less
- Exterior features: Property on a 2.16-acre lot; County road frontage with public road maintenance; Directions: Hwy 169 N to County Road 4 (261st) west; home is on the right
Interior
- Kitchen: Range; Refrigerator; Dishwasher not listed
- Bedrooms: 3 bedrooms
- Bathrooms: One full bathroom on the main floor; One three-quarter bathroom in the basement
- Heating & cooling: Baseboard heat; Window units for cooling
- Interior features: Dryer, Range, Refrigerator, Washer; Baseboard heating; Window air conditioning units; Full basement with block foundation
- Laundry & utility: Laundry in basement; Washer and Dryer included
Neighborhood map
What this means for you Summary
Snapshot
- This is a 2-bed/1.0-bath single-family listed at $225k.
Deal economics
- At list price, monthly cash flow is $-91 ($-1k/yr) — negative.
- To cash-flow at today's rent, offer at most $209k (7.1% below list).
- To meet the 1% rule (rent ≥ 1% of price), the offer needs to be $175k (22.3% below list).
- Recommended offer: $175k (22.3% below list) — sets the bar for 1% rule.
- Cap rate 5.8% vs local median 3.1% in Zimmerman — top-decile yield for the area; either an underpriced asset or a hidden risk that comps aren't pricing in. Stress-test before assuming the spread holds.
Location & tenants
- Location reads 77/100 on livability (#134 in MN, #3,004 nationally) — a middle-class / working-renter tenant base. Strengths: employment A+, housing A+, health & safety A+; Watch: amenities F, commute F.
- Independent School District 728 (suburban): math 56% / reading 60% proficiency, ranked #37 of 301 in MN (top 12%) — acceptable for families but not a draw, mixed tenant base, ~2y average lease; only 14% free/reduced lunch — higher-income household profile.
- Zoned schools: Westwood Elementary (math 55% / reading 54%, grade C, #320 of 857 statewide, top 41%, 543 students, 36% FRL); Zimmerman Middle (math 47% / reading 53%, grade C, #77 of 258 statewide, top 31%, 531 students, 31% FRL); Zimmerman High School (math 47% / reading 62%, grade C-, #87 of 471 statewide, top 22%, 707 students, 28% FRL) — zoned schools average 32% FRL vs 14% district-wide (17 pts higher); higher-poverty schools than district average — tighter screening recommended.
- Market conditions: 181 active listings in the ZIP; solid renter incomes; 334 units permitted in Sherburne County in 2024 (58 in 5+ unit buildings).
Forward outlook
- Local home prices are declining (-3.0%/yr); year-one equity from $2k of loan paydown is wiped out by about $7k of value loss. Plan a longer hold.
Negotiation context
- It's been on market 18 days — a 2% lower offer ($222k) is reasonable based on typical stale-listing flexibility.
- 5 sale attempts since 3y ago with the ask held roughly flat each time — persistent listings suggest the price (not the market) is what's stuck; bring a comps-based counter.
- Current owner paid $142k; list at $225k implies a 58% gain — meaningful room to come down on a strong offer.
Risks & watch-outs
- Climate carrying-cost: moderate wildfire risk — expect insurance premiums to compound above CPI over the hold.
Questions for the listing agent
- What do current leases actually rent for vs. the listed asking? Can we see a recent rent roll and the last 12 months of T-12 income?
- Built in 1966 — when were the roof, HVAC, electrical panel, plumbing, and water heater last replaced?
- Is there a deadline driving the sale (1031 exchange, divorce, estate, relocation)? That informs how much negotiation room exists.
- Schools are A-rated — typically a magnet for longer-tenancy family renters. What's the average tenant stay here, and is there a school-zone premium baked into asking?
- The area grade is low — what's the realistic commute time and amenity access for the typical tenant pool here? Any planned neighborhood developments (good or bad) we should know about?
- What's the average days-on-market for RENTAL listings here right now (not sales)? A rising rental-DOM trend means longer vacancies and softer asking-rent achievability than the comps imply.
- What's the recent tenant-quality profile in this submarket — average credit score on applications, eviction rate, late-payment / NSF rate, and stable-employment percentage? A property-management company in the area should have these aggregated.
- How much new for-sale + rental construction is in the pipeline within 1–3 miles? Heavy new supply typically softens prices + rents 12–24 months out; constrained supply supports both.
Investment metrics
- 1% rule
- 0.78% ✗
- Cap rate
- 5.81%
- Cash-on-cash
- -1.73%
- DSCR
- 0.92
- GRM
- 10.7
CMA / ARV
No comps found within radius.
Projected returns pro-forma
-3.0% appreciation · 3.0% rent growth · sell at horizon
- IRR
- -19.2%
- Equity multiple
- 0.33×
- Total profit
- $-42,270
- Equity at exit
- $33,548
- IRR
- -11.8%
- Equity multiple
- 0.30×
- Total profit
- $-44,357
- Equity at exit
- $19,454
Cash invested: $63,000 (down + closing). Projections, not guarantees.
Landlord ↔ Tenant lean methodology
- Overall (STATE)
- 46 Balanced
- State Minnesota
- 46 Balanced · D+2
- County
- — inherits STATE
- City
- — inherits STATE
ZIP-level market 55398
- Home prices YoY
- -20.7%
- Active inventory
- 181
- Price-to-rent
- 10.7×
Monthly cashflow live
- Estimated rent
- $1,749 medium interval (Pro) →
- Mortgage (P&I)
- −$1,180
- Tax from tax record
- −$199 /mo · $2,388/yr
- Insurance
- −$94
- HOA
- −$0
- Vacancy / Maint / Mgmt
- −$367
- Net cashflow
- $-91
Break-even live
Sensitivity live
| Price | -10% $37 | -5% $-27 | +0% $-91 | +5% $-155 | +10% $-218 |
|---|---|---|---|---|---|
| Rent | -10% $-229 | -5% $-160 | +0% $-91 | +5% $-22 | +10% $47 |
| Rate | -1.0pp $22 | -0.5pp $-34 | base $-91 | +0.5pp $-149 | +1.0pp $-208 |
UW: 25.0% down · 7.5% · 30yr · 1.5% tax · 5.0% vac · 8.0% maint · 8.0% mgmt
Financing live
Cash to close
- Down payment
- $56,250
- Closing costs
- $6,750
- Reserves months
- —
- Total cash needed
- —
Loan-product check · same deal, 3 products live
Conventional
25% down · 7.5% · 30yr
- Down + closing
- —
- Monthly P&I
- —
- Monthly cashflow
- —
- DSCR
- —
- Eligible?
- —
Personal DTI + credit; lowest rate.
DSCR
20% down · 8.5% · 30yr
- Down + closing
- —
- Monthly P&I
- —
- Monthly cashflow
- —
- DSCR
- —
- Eligible?
- —
No personal income docs; deal must DSCR.
Hard money
10% down · 12.0% · 12mo
- Down + closing
- —
- Monthly P&I
- —
- Monthly cashflow
- —
- DSCR
- —
- Eligible?
- —
Short-term bridge; refi at stabilization.
Listing history 12 events
-
2026-06-21days on market $225,000 Active 18 DOM
-
2026-06-18days on market $225,000 Active 15 DOM
-
2026-06-17days on market $225,000 Active 14 DOM
-
2026-06-16days on market $225,000 Active 13 DOM
-
2026-06-15days on market $225,000 Active 12 DOM
-
2026-06-13days on market $225,000 Active 10 DOM
-
2026-06-13days on market $225,000 Active 9 DOM
-
2026-06-09days on market $225,000 Active 6 DOM
-
2026-06-08days on market $225,000 Active 5 DOM
-
2026-06-07days on market $225,000 Active 4 DOM
-
2026-06-04remarks 699-char remark
-
2026-06-04$225,000 Active 1 DOM
ⓘ Source: listings_history table (triggers on properties + properties_extension) + one-shot
backfill from property_details.listing_events for pre-trigger history.
Tax reassessment forecast MN · Partial reset (capped growth)
- Current annual tax
- $2,388 · $199/mo
- Projected year-2 tax
- $2,454 · $204/mo
- Expected delta
- +$66/yr (+$6/mo · 2.8%)
ⓘ Screening estimate from a state-policy table — verify with the county assessor before closing.
Climate risk First Street
- Flood 1/10 Low FEMA zone X (unshaded) · 0% chance over 30 yrs
- Wildfire 5/10 Major
- Heat 2/10 Low 7 d/yr ≥98°F today · 13 d/yr by 30 yrs out
- Wind 2/10 Low
- Air quality 3/10 Moderate 3 unhealthy d/yr today · 3 by 30 yrs out
Nearby sold comps map
Loading sold comps map…
Walkable amenities ~0.75 mi
Loading nearby amenities…
Taxation est. · year 1
- Rental income
- $20,990
- − Mortgage interest
- −$12,603
- − Property taxes
- −$2,388
- − Insurance
- −$1,125
- − Repairs & maintenance
- −$1,679
- − Management
- −$1,679
- − Depreciation
- −$6,545
- Taxable loss
- −$5,031
- Est. tax savings @ 24.0%
- +$1,207
- After-tax cash flow
- $117/yr
For passive investors: Depreciation is non-cash, so a rental often shows a tax loss while cash-flowing — sheltering income. Rental losses are passive: they offset passive income freely, and up to $25,000/yr can offset ordinary (W-2) income if you actively participate and your MAGI is under $100k (phasing out to $0 by $150k); unused losses carry forward. On sale, claimed depreciation is recaptured at up to 25%, and gains may owe capital-gains tax (a 1031 exchange can defer both). Figures are a year-1 estimate at your 24.0% rate — not tax advice; consult a CPA.
Schools (NCES district)
- District
- Independent School District 728
- NCES district ID
- 2711370
- Math proficiency
- 56% ▼ -15.00%
- Reading proficiency
- 60% ▼ -10.00%
- Median HH income
- $82,336
- Composite
- 52.5/100
- National rank
- #1567
- State rank
- #37 of 301 in MN
Livability — Zimmerman
- Score
- 77/100
- State rank
- #134
- US rank
- #3004
Category grades
Schools grade is shown separately in the Schools card above.
Census & demographics
- County
- Sherburne County · 120,363 people
- City population
- 17,688
- Metro
- Minneapolis-St. Paul-Bloomington, MN-WI
- Population (ZIP)
- 17,688
- Household income
- $103,419
- Rent vs Own
- Severe rent burden
- 176.0
Population outlook (Sherburne County) Hauer SSP2
- Today (2025)
- 97,402 people
- By 2030
- 99,341 · +2.0%
- By 2040
- 101,188 · +3.9%
- By 2050
- 99,214 · +1.9%
- By 2075
- 88,700 · -8.9%
- By 2100
- 72,241 · -25.8%
Race, ethnicity, and origin ACS 2023
- Neighborhood character
- Predominantly White (90%)
- Race & ethnicity
- White 90% Two or more races 5% Hispanic / Latino 3% Asian 2%
- Common ancestry
- Portuguese 18% Romanian 5% Lithuanian 2%
- Foreign-born
- 2% · Canada
- Languages at home
- 97% English-only · Spanish 2%
Political lean MEDSL · Sherburne
- 2024 margin
- Solid R (+34.9) · D 31.7% · R 66.6% · Other 1.7%
- 2008→2024 swing
- -16.7pp toward R · 2008: -18.2pp · 2024: -34.9pp
- All cycles
- 2024: R+34.9 2020: R+32.6 2016: R+37.0 2012: R+22.1 2008: R+18.2
Not yet ingested
- Civics
- —
Market trends
- HPI YoY
- ▼ -68.73%
- Current HPI
- 263.741
- Rent YoY
- —
- Metro
- Minneapolis-St. Paul-Bloomington, MN-WI
- State GDP YoY
- ▲ 2.41%
- F500 in state
- 34
Industry mix (Fortune 500 HQ in MN)
| Industry | F500 HQs | Revenue |
|---|---|---|
| Healthcare | 2 | $407B |
|
||
| Retail | 2 | $150B |
|
||
| Consumer Goods | 2 | $32B |
|
||
| Industrial Machinery | 2 | $6B |
|
||
| Agriculture | 1 | $40B |
|
||
| Healthcare / Medical Devices | 1 | $32B |
|
||
Price history
+51.0% since first listed15 events — show timeline
- 2026-06-01 Listed $225,000 NORTHSTARMLS as Distributed by MLS Grid
- 2024-10-19 Price Changed $265,000 NORTHSTARMLS as Distributed by MLS Grid
- 2024-10-10 Relisted — NORTHSTARMLS as Distributed by MLS Grid
- 2024-10-06 Contingent — NORTHSTARMLS as Distributed by MLS Grid
- 2024-09-21 Price Changed $274,880 NORTHSTARMLS as Distributed by MLS Grid
- 2024-08-15 Listed $284,988 NORTHSTARMLS as Distributed by MLS Grid
- 2024-08-09 Price Changed $284,988 NORTHSTARMLS as Distributed by MLS Grid
- 2024-08-08 Coming Soon — NORTHSTARMLS as Distributed by MLS Grid
- 2024-04-07 Listing Removed — NORTHSTARMLS as Distributed by MLS Grid
- 2024-03-15 Price Changed $275,000 NORTHSTARMLS as Distributed by MLS Grid
- 2024-02-21 Listed $285,000 NORTHSTARMLS as Distributed by MLS Grid
- 2023-06-12 Sold (Public Records) $142,000 Public Records
- 2023-06-09 Sold (MLS) $142,000 NORTHSTARMLS as Distributed by MLS Grid
- 2023-05-29 Contingent — NORTHSTARMLS as Distributed by MLS Grid
- 2023-05-26 Listed $149,000 NORTHSTARMLS as Distributed by MLS Grid
Property tax history
+3.3%/yrLatest (2025): $2,388 · +3.9% YoY. Source: county tax records.
Cash-flow waterfall
monthlySold comps — $/sqft
last 12 mo · ≤1 miLoading sold comps…