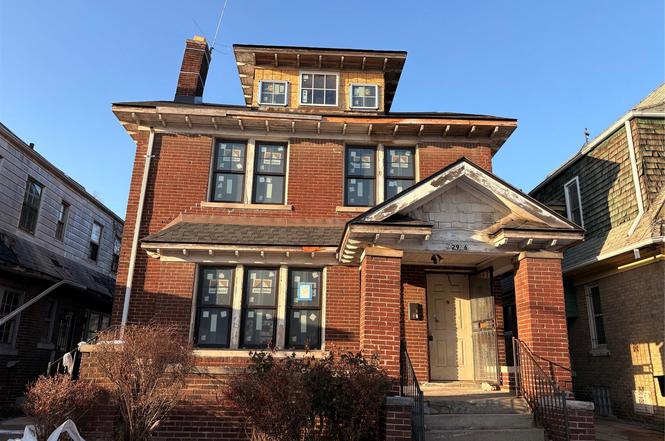
2966 Collingwood St · Detroit, MI
Flood risk 1/10 · Minimal
- FEMA flood zone
- X (unshaded)
- Chance of flooding over 30 yrs
- 0.0%
- Est. flood insurance / yr
- $473 – $860
Fire risk 1/10 · Minimal
- Est. fire insurance / yr
- $784 – $1,456
Heat risk 3/10 · Minor
- Hot days now (above 97°F)
- 7 days/yr
- Hot days in 30 yrs
- 15 days/yr
Wind risk 2/10 · Minimal
- Chance of severe wind over 30 yrs
- —
Air-quality risk 4/10 · Minor
- Unhealthy air days now
- 4 days/yr
- Unhealthy air days in 30 yrs
- 6 days/yr
Risk factors via First Street. Map © Google.
Why this score? — see what drove the B- grade
The composite is a weighted blend of 9 inputs, each scored 0–100. Each bar is that input's sub-score; the figure is the points it added to the 100-point composite (weight × sub-score).
- Cash flow +30.0/30.0
- 1% rule +10.0/10.0
- DSCR +10.0/10.0
- ARV discount +5.0/15.0
- Rent growth +3.8/5.0
- Livability +3.7/5.0
- Condition / age +2.5/5.0
- Schools +1.3/10.0
- Appreciation +0.0/10.0
$100,000
🖨 Deal sheet 📄 Offer letter ✓ Due diligence
Listing remarks MLS
This property is in need of restoration and your vision. Some big ticket items have already been done with a brand new roof and all new, upgraded Andersen windows. The backyard has a new shed and an egress window has been prepared to add conforming space to the basement. The third floor has ample space to build out an additional play room and is accessed by a brand new staircase. The neighborhood boasts ARVs upwards of $275,000.0, which makes this an attractive project for both investors and home-owners who want to design their dream home.
Key facts
- Brand new roof
- Egress window
- New staircase
Tags
Neighborhood map
What this means for you Summary
Snapshot
- This is a 4-bed/2.0-bath single-family listed at $100k.
Deal economics
- At list price, monthly cash flow is $600 ($7k/yr) — positive.
- The deal already cash-flows at list — no discount required.
- Meets the 1% rule at list price ($2k rent vs $100k).
- Recommended offer: $88k (12.0% below list) — sets the bar for market timing.
- Cap rate 13.5% vs local median 10.2% in Detroit — top-decile yield for the area; either an underpriced asset or a hidden risk that comps aren't pricing in. Stress-test before assuming the spread holds.
Location & tenants
- Location reads 73/100 on livability (#218 in MI) — a middle-class / working-renter tenant base. Strengths: amenities A+, commute A+, cost of living A+; Watch: schools F, crime F, employment F.
- Detroit Public Schools Community District (urban): math 10% / reading 24% proficiency, ranked #499 of 540 in MI (top 92%) — low school quality limits family demand, transient renter base, plan for 1-2y turnover; 90% free/reduced lunch — lower-income household profile, screen leases tightly.
- Market conditions: Rents rising fast (+5.2%/yr); 271 active listings in the ZIP; 40 comparable units currently listed for rent nearby; rentals at typical pace (median 22d on market — plan ~3-4 weeks tenant-placement turnaround); 2,639 units permitted in Wayne County in 2024 (1,216 in 5+ unit buildings).
- This rent runs 44% of the median local income ($45k/yr) — at the standard rent-burdened threshold; future hikes will face affordability resistance.
Forward outlook
- Local home prices are declining (-3.0%/yr); year-one equity from $691 of loan paydown is wiped out by about $3k of value loss. Plan a longer hold.
- Wayne County population projected at -17% by 2050 — secular population decline; favor cash flow + early exit over multi-decade hold.
- At projected returns (-3.0% appreciation + 5.2% rent growth), your $28k cash investment doubles in ~5 years — after that, you're playing with house money.
Negotiation context
- It's been on market 182 days — a 12% lower offer ($88k) is reasonable based on typical stale-listing flexibility.
- 6 sale attempts since 2y ago with the ask held roughly flat each time — persistent listings suggest the price (not the market) is what's stuck; bring a comps-based counter.
- Current owner paid $40k; list at $100k implies a 150% gain — meaningful room to come down on a strong offer.
Risks & watch-outs
- Watch-outs: built in 1922 — expect roof / HVAC / electrical / plumbing capex.
Questions for the listing agent
- It's been on market 182 days. Have you received any prior offers? Is the seller open to a 12% concession, seller financing, or rate buy-down credit?
- Built in 1922 — when were the roof, HVAC, electrical panel, plumbing, and water heater last replaced?
- Why hasn't it sold? Are there any deal-killer items the seller is aware of (foundation, flood, title, zoning, code violations)?
- Is there a deadline driving the sale (1031 exchange, divorce, estate, relocation)? That informs how much negotiation room exists.
- Schools are F-rated, which usually means shorter tenancies and higher turnover. Who's the typical renter profile here, and what's been the actual vacancy rate?
- Crime grade is F in this area — have there been break-ins, vandalism, or insurance claims at this property in the last 3 years? What carrier currently insures it and at what premium?
- What's the average days-on-market for RENTAL listings here right now (not sales)? A rising rental-DOM trend means longer vacancies and softer asking-rent achievability than the comps imply.
- What's the recent tenant-quality profile in this submarket — average credit score on applications, eviction rate, late-payment / NSF rate, and stable-employment percentage? A property-management company in the area should have these aggregated.
- How much new for-sale + rental construction is in the pipeline within 1–3 miles? Heavy new supply typically softens prices + rents 12–24 months out; constrained supply supports both.
Investment metrics
- 1% rule
- 1.65% ✓
- Cap rate
- 13.50%
- Cash-on-cash
- 25.73%
- DSCR
- 2.14
- GRM
- 5.0
CMA / ARV
- ARV (median comp)
- $94,814
- List price
- $100,000
- Delta
- 5.47%
- Verdict
- FAIR
- Comps
- 20 within 1.0 mi
Show comp detail 12 sales within ~0.75 mi
| Address | Dist | Beds/Ba | Sqft | Sold | Price | $/sf | Match |
|---|---|---|---|---|---|---|---|
| 2660 Webb St | 0.25mi | 4/1.5 | 1,956 (+3%) | 2mo | $61,000 | $31 | 80 |
| 2910 Lawrence St | 0.08mi | 3/1.0 (-1) | 1,986 (+5%) | 6mo | $111,500 | $56 | 74 |
| 2437 Longfellow St | 0.53mi | 4/1.5 | 1,841 (-3%) | 2mo | $135,000 | $73 | 67 |
| 2677 Collingwood St | 0.16mi | 3/2.0 (-1) | 2,136 (+13%) | 6mo | $199,900 | $94 | 62 |
| 3010 Fullerton St | 0.63mi | 4/2.0 | 1,993 (+5%) | 2mo | $123,000 | $62 | 60 |
| 9400 Wildemere St | 0.37mi | 3/1.5 (-1) | 2,080 (+10%) | 4mo | $42,000 | $20 | 56 |
| 2704 Burlingame St | 0.18mi | 3/1.5 (-1) | 1,618 (-15%) | 6mo | $119,000 | $74 | 55 |
| 4069 Sturtevant St | 0.73mi | 3/3.5 (-1) | 1,921 (+1%) | 2mo | $320,000 | $167 | 51 |
| 9390 Quincy St | 0.60mi | 3/2.0 (-1) | 1,686 (-11%) | 0mo | $145,000 | $86 | 48 |
| 2281 Atkinson St | 0.71mi | 4/1.5 | 2,103 (+11%) | 4mo | $325,000 | $155 | 44 |
| 2064 Glynn Ct | 0.59mi | 4/1.5 | 1,624 (-14%) | 4mo | $118,556 | $73 | 43 |
| 2405 Sturtevant St | 0.69mi | 3/1.5 (-1) | 1,636 (-14%) | 3mo | $45,000 | $28 | 36 |
Match score weights: distance 35% · size 25% · config 20% · recency 20%. Top-matched comps best support the ARV.
Projected returns pro-forma
-3.0% appreciation · 5.2% rent growth · sell at horizon
- IRR
- 21.9%
- Equity multiple
- 1.92×
- Total profit
- $25,800
- Equity at exit
- $14,910
- IRR
- 31.4%
- Equity multiple
- 4.14×
- Total profit
- $87,869
- Equity at exit
- $8,646
Cash invested: $28,000 (down + closing). Projections, not guarantees.
Landlord ↔ Tenant lean methodology
- Overall (STATE)
- 62 Landlord-Friendly
- State Michigan
- 62 Landlord-Friendly · EVEN
- County
- — inherits STATE
- City
- — inherits STATE
ZIP-level market 48206
- Rents YoY
- 5.2%
- Active inventory
- 271
- Price-to-rent
- 5.0×
Monthly cashflow live
- Estimated rent
- $1,651 high interval (Pro) →
- Mortgage (P&I)
- −$524
- Tax from tax record
- −$138 /mo · $1,658/yr
- Insurance
- −$42
- HOA
- −$0
- Vacancy / Maint / Mgmt
- −$347
- Net cashflow
- $600
Break-even live
UW: 25.0% down · 7.5% · 30yr · 1.5% tax · 5.0% vac · 8.0% maint · 8.0% mgmt
Financing live
Cash to close
- Down payment
- $25,000
- Closing costs
- $3,000
- Reserves months
- —
- Total cash needed
- —
Loan-product check · same deal, 3 products live
Conventional
25% down · 7.5% · 30yr
- Down + closing
- —
- Monthly P&I
- —
- Monthly cashflow
- —
- DSCR
- —
- Eligible?
- —
Personal DTI + credit; lowest rate.
DSCR
20% down · 8.5% · 30yr
- Down + closing
- —
- Monthly P&I
- —
- Monthly cashflow
- —
- DSCR
- —
- Eligible?
- —
No personal income docs; deal must DSCR.
Hard money
10% down · 12.0% · 12mo
- Down + closing
- —
- Monthly P&I
- —
- Monthly cashflow
- —
- DSCR
- —
- Eligible?
- —
Short-term bridge; refi at stabilization.
Rent comps 40 comps
| Address | Beds | Baths | Sqft | Rent | $/sqft | DOM | Units | Dist |
|---|---|---|---|---|---|---|---|---|
| 3031 Lawrence St Detroit, MI | 4.0 | 1.0 | 1700 | $1,600 | $0.94 | 17d | 1 | 0.04mi |
| 2925 Calvert St Detroit, MI | 3.0 | 1.0 | 1400 | $1,300 | $0.93 | 17d | 1 | 0.12mi |
| 3266 Calvert Ave Fl 2 Detroit, MI | 3.0 | 1.0 | 1279 | $1,300 | $1.02 | 24d | 1 | 0.14mi |
| 2727 Calvert Ave Unit 1 Detroit, MI | 3.0 | 1.5 | 1350 | $1,200 | $0.89 | 44d | 1 | 0.17mi |
| 2655 Collingwood St Detroit, MI | 4.0 | 1.5 | 1881 | $2,700 | $1.44 | 2d | 1 | 0.20mi |
| 2653 Calvert Ave Unit 1 Detroit, MI | 3.0 | 1.0 | 1305 | $1,200 | $0.92 | 44d | 1 | 0.22mi |
| 2634 Lawrence St Detroit, MI | 3.0 | 1.5 | 1388 | $1,600 | $1.15 | 2d | 1 | 0.23mi |
| 3322 Webb St Unit 2 Detroit, MI | 3.0 | 1.0 | 1656 | $1,350 | $0.82 | 44d | 1 | 0.26mi |
| 3322 Webb St Unit 1 Detroit, MI | 3.0 | 1.0 | 1656 | $1,350 | $0.82 | 44d | 1 | 0.26mi |
| 3322 Webb St Detroit, MI | 3.0 | 1.0 | 1600 | $1,250 | $0.78 | 17d | 1 | 0.26mi |
| 3422 Edison St Detroit, MI | 3.0 | 1.0 | 1300 | $1,295 | $1.00 | 17d | 1 | 0.43mi |
| 2986 Richton St Detroit, MI | 3.0 | 1.0 | 2600 | $1,200 | $0.46 | 17d | 1 | 0.44mi |
| 2474 Fullerton St Detroit, MI | 3.0 | 1.0 | 1400 | $1,300 | $0.93 | 15d | 1 | 0.74mi |
| 1929 Calvert Ave Unit 2 Detroit, MI | 3.0 | 1.0 | 1414 | $1,199 | $0.85 | 15d | 1 | 0.74mi |
| 2463 Taylor St Detroit, MI | 3.0 | 1.0 | 1350 | $1,100 | $0.81 | 44d | 1 | 0.75mi |
| 3220 Gladstone St Detroit, MI | 3.0 | 1.0 | 1248 | $1,200 | $0.96 | 44d | 1 | 0.75mi |
| 8951 La Salle Blvd Detroit, MI | 4.0 | 2.5 | 2440 | $2,500 | $1.02 | 2d | 1 | 0.77mi |
| 8951 La Salle Blvd Detroit, MI | 5.0 | 2.5 | 2440 | $2,500 | $1.02 | 15d | 1 | 0.77mi |
| 8951 La Salle Blvd Unit NA Detroit, MI | 4.0 | 2.5 | 2440 | $2,500 | $1.02 | 10d | 1 | 0.77mi |
| 2254 Taylor St Unit Taylor St unit Detroit, MI | 3.0 | 1.0 | 1307 | $1,550 | $1.19 | 3d | 1 | 0.81mi |
| 2302 Hazelwood St Unit 1 Detroit, MI | 3.0 | 1.0 | 1550 | $1,273 | $0.82 | 24d | 1 | 0.83mi |
| 1699 Glynn Ct Detroit, MI | 5.0 | 3.5 | 2542 | $2,500 | $0.98 | 22d | 1 | 0.85mi |
| 3786 Carter St Unit 2 Detroit, MI | 3.0 | 1.0 | 1400 | $1,100 | $0.79 | 24d | 1 | 0.87mi |
| 3747 Tyler St Detroit, MI | 3.0 | 1.0 | 2600 | $1,700 | $0.65 | 24d | 1 | 0.90mi |
| 12546 Broadstreet Ave Detroit, MI | 3.0 | 1.5 | 1899 | $1,250 | $0.66 | 44d | 1 | 0.92mi |
| 3740 Tyler St Unit 1 Detroit, MI | 3.0 | 1.0 | 1300 | $1,300 | $1.00 | 5d | 1 | 0.92mi |
| 2080 Gladstone St #1 Detroit, MI | 4.0 | 2.0 | 2426 | $3,000 | $1.24 | 2d | 1 | 0.95mi |
| 4341 Glendale St Detroit, MI | 4.0 | 2.5 | 1832 | $1,680 | $0.92 | 5d | 1 | 0.97mi |
| 2028 Gladstone St Unit 1 Detroit, MI | 5.0 | 2.0 | 2500 | $2,850 | $1.14 | 3d | 1 | 0.99mi |
| 3259 W Philadelphia St Detroit, MI | 3.0 | 1.0 | 1293 | $1,400 | $1.08 | 17d | 1 | 1.00mi |
| 4336 Buena Vista St Detroit, MI | 3.0 | 1.0 | 1300 | $1,100 | $0.85 | 44d | 1 | 1.04mi |
| 3799 W Philadelphia St Detroit, MI | 5.0 | 2.0 | 2200 | $1,650 | $0.75 | 17d | 1 | 1.06mi |
| 2506 W Euclid St Detroit, MI | 3.0 | 1.0 | 1475 | $1,675 | $1.14 | 44d | 1 | 1.06mi |
| 2504 W Euclid St Unit 2506 Detroit, MI | 3.0 | 1.0 | 1475 | $1,675 | $1.14 | 44d | 1 | 1.06mi |
| 2504 W Euclid St Unit 2504 Detroit, MI | 3.0 | 1.0 | 1475 | $1,650 | $1.12 | 44d | 1 | 1.06mi |
| 3209 W Grand St Detroit, MI | 3.0 | 1.0 | 1550 | $1,103 | $0.71 | 44d | 1 | 1.07mi |
| 4345 W Euclid St Unit 1 Detroit, MI | 3.0 | 1.0 | 1300 | $1,400 | $1.08 | 24d | 1 | 1.19mi |
| 4345 W Euclid St Unit 2 Detroit, MI | 3.0 | 1.0 | 1300 | $1,450 | $1.12 | 24d | 1 | 1.19mi |
| 4287 W Grand St Unit 4289 Detroit, MI | 3.0 | 1.0 | 1250 | $1,000 | $0.80 | 44d | 1 | 1.22mi |
| 4915 Maplewood St Detroit, MI | 3.0 | 1.0 | 1324 | $1,100 | $0.83 | 17d | 1 | 1.30mi |
Listing history 24 events
-
2026-06-18days on market $100,000 Active 182 DOM
-
2026-06-17days on market $100,000 Active 181 DOM
-
2026-06-15days on market $100,000 Active 179 DOM
-
2026-06-13days on market $100,000 Active 177 DOM
-
2026-06-13days on market $100,000 Active 176 DOM
-
2026-06-09days on market $100,000 Active 173 DOM
-
2026-06-08days on market $100,000 Active 172 DOM
-
2026-06-07days on market $100,000 Active 171 DOM
-
2026-06-04days on market $100,000 Active 168 DOM
-
2026-06-03days on market $100,000 Active 167 DOM
-
2026-06-01days on market $100,000 Active 165 DOM
-
2026-05-31days on market $100,000 Active 164 DOM
-
2026-02-04status Active 545-char remark
Show marketing remark (545 chars)
This property is in need of restoration and your vision. Some big ticket items have already been done with a brand new roof and all new, upgraded Andersen windows. The backyard has a new shed and an egress window has been prepared to add conforming space to the basement. The third floor has ample space to build out an additional play room and is accessed by a brand new staircase. The neighborhood boasts ARVs upwards of $275,000.0, which makes this an attractive project for both investors and home-owners who want to design their dream home.
-
2026-01-13historical Accepting Backup Offers 545-char remark
Show marketing remark (545 chars)
This property is in need of restoration and your vision. Some big ticket items have already been done with a brand new roof and all new, upgraded Andersen windows. The backyard has a new shed and an egress window has been prepared to add conforming space to the basement. The third floor has ample space to build out an additional play room and is accessed by a brand new staircase. The neighborhood boasts ARVs upwards of $275,000.0, which makes this an attractive project for both investors and home-owners who want to design their dream home.
-
2026-01-13historical Active Under Contract 545-char remark
Show marketing remark (545 chars)
This property is in need of restoration and your vision. Some big ticket items have already been done with a brand new roof and all new, upgraded Andersen windows. The backyard has a new shed and an egress window has been prepared to add conforming space to the basement. The third floor has ample space to build out an additional play room and is accessed by a brand new staircase. The neighborhood boasts ARVs upwards of $275,000.0, which makes this an attractive project for both investors and home-owners who want to design their dream home.
-
2025-12-18$100,000 Active 545-char remark
Show marketing remark (545 chars)
This property is in need of restoration and your vision. Some big ticket items have already been done with a brand new roof and all new, upgraded Andersen windows. The backyard has a new shed and an egress window has been prepared to add conforming space to the basement. The third floor has ample space to build out an additional play room and is accessed by a brand new staircase. The neighborhood boasts ARVs upwards of $275,000.0, which makes this an attractive project for both investors and home-owners who want to design their dream home.
-
2024-04-04soldstatus $40,000 Sold
-
2024-04-04soldstatus $40,000 Closed
-
2024-02-06status Pending
-
2024-02-06status Pending
-
2024-01-15$41,000 Active
-
2024-01-15$41,000 Active
ⓘ Source: listings_history table (triggers on properties + properties_extension) + one-shot
backfill from property_details.listing_events for pre-trigger history.
Tax reassessment forecast MI · Partial reset (capped growth)
- Current annual tax
- $1,658 · $138/mo
- Projected year-2 tax
- $1,658 · $138/mo
- Expected delta
- $0/yr ($0/mo · 0.0%)
ⓘ Screening estimate from a state-policy table — verify with the county assessor before closing.
Climate risk First Street
- Flood 1/10 Low FEMA zone X (unshaded) · 0% chance over 30 yrs
- Wildfire 1/10 Low
- Heat 3/10 Moderate 7 d/yr ≥97°F today · 15 d/yr by 30 yrs out
- Wind 2/10 Low
- Air quality 4/10 Moderate 4 unhealthy d/yr today · 6 by 30 yrs out
Nearby sold comps map
Loading sold comps map…
Walkable amenities ~0.75 mi
Loading nearby amenities…
Taxation est. · year 1
- Rental income
- $19,817
- − Mortgage interest
- −$5,602
- − Property taxes
- −$1,658
- − Insurance
- −$500
- − Repairs & maintenance
- −$1,585
- − Management
- −$1,585
- − Depreciation
- −$2,909
- Taxable income
- $5,977
- Est. tax owed @ 24.0%
- −$1,434
- After-tax cash flow
- $5,769/yr
For passive investors: Depreciation is non-cash, so a rental often shows a tax loss while cash-flowing — sheltering income. Rental losses are passive: they offset passive income freely, and up to $25,000/yr can offset ordinary (W-2) income if you actively participate and your MAGI is under $100k (phasing out to $0 by $150k); unused losses carry forward. On sale, claimed depreciation is recaptured at up to 25%, and gains may owe capital-gains tax (a 1031 exchange can defer both). Figures are a year-1 estimate at your 24.0% rate — not tax advice; consult a CPA.
Schools (NCES district)
- District
- Detroit Public Schools Community District
- NCES district ID
- 2601103
- Math proficiency
- 10% ▼ -2.00%
- Reading proficiency
- 24% ▲ 6.00%
- Median HH income
- $25,815
- Composite
- 13.06/100
- National rank
- #9564
- State rank
- #499 of 540 in MI
Livability — Detroit
- Score
- 73/100
- State rank
- #218
- US rank
- #5427
Category grades
Schools grade is shown separately in the Schools card above.
Census & demographics
- Census place
- Detroit, MI
- County
- Wayne County · 1,562,939 people
- City population
- 572,865
- Metro
- Detroit-Warren-Dearborn, MI
- Population (ZIP)
- 15,227
- Household income
- $45,046
- Rent vs Own
- Severe rent burden
- 646.0
Population outlook (Wayne County) Hauer SSP2
- Today (2025)
- 1,675,273 people
- By 2030
- 1,620,300 · -3.3%
- By 2040
- 1,502,341 · -10.3%
- By 2050
- 1,384,039 · -17.4%
- By 2075
- 1,124,592 · -32.9%
- By 2100
- 881,193 · -47.4%
Race, ethnicity, and origin ACS 2023
- Neighborhood character
- Predominantly Black (81%)
- Race & ethnicity
- Black 81% White 12% Two or more races 5% Hispanic / Latino 3%
- Common ancestry
- Iranian 3% Romanian 1% Slovak 1%
- Foreign-born
- 4% · Canada
- Languages at home
- 94% English-only · Spanish 4% Other Indo-European 1%
Political lean MEDSL · Wayne
- 2024 margin
- Strong D (+29.0) · D 62.7% · R 33.7% · Other 3.6%
- 2008→2024 swing
- -20.5pp toward R · 2008: 49.5pp · 2024: 29.0pp
- All cycles
- 2024: D+29.0 2020: D+38.1 2016: D+37.3 2012: D+46.9 2008: D+49.5
Not yet ingested
- Civics
- —
Market trends
- HPI YoY
- ▼ -139.60%
- Current HPI
- 130.9545
- Rent YoY
- ▲ 5.20%
- Metro
- Detroit-Warren-Dearborn, MI
- State GDP YoY
- ▲ 1.37%
- F500 in state
- 28
Industry mix (Fortune 500 HQ in MI)
| Industry | F500 HQs | Revenue |
|---|---|---|
| Automotive Parts | 3 | $48B |
|
||
| Automotive | 2 | $372B |
|
||
| Chemicals | 1 | $45B |
|
||
| Automotive Retail | 1 | $29B |
|
||
| Healthcare / Medical Devices | 1 | $23B |
|
||
| Automotive Technology | 1 | $20B |
|
||
Price history
+143.9% since first listed12 events — show timeline
- 2026-02-04 Relisted — MiRealSource-MiMLS
- 2026-02-04 Relisted — REALCOMP
- 2026-01-13 Contingent — MiRealSource-MiMLS
- 2026-01-13 Contingent — REALCOMP
- 2025-12-18 Listed $100,000 REALCOMP
- 2025-12-18 Listed $100,000 MiRealSource-MiMLS
- 2024-04-04 Sold (MLS) $40,000 MiRealSource-MiMLS
- 2024-04-04 Sold (MLS) $40,000 REALCOMP
- 2024-02-06 Pending — MiRealSource-MiMLS
- 2024-02-06 Pending — REALCOMP
- 2024-01-15 Listed $41,000 MiRealSource-MiMLS
- 2024-01-15 Listed $41,000 REALCOMP
Property tax history
+1.1%/yrLatest (2025): $1,658 · +25.6% YoY. Source: county tax records.
Cash-flow waterfall
monthlySold comps — $/sqft
last 12 mo · ≤1 miLoading sold comps…