1309 N 9th St · Independence, KS
Flood risk 1/10 · Minimal
- FEMA flood zone
- X (unshaded)
- Chance of flooding over 30 yrs
- 0.0%
- Est. flood insurance / yr
- $507 – $1,088
Fire risk 6/10 · Moderate
- Est. fire insurance / yr
- $1,154 – $2,142
Heat risk 5/10 · Moderate
- Hot days now (above 109°F)
- 7 days/yr
- Hot days in 30 yrs
- 19 days/yr
Wind risk 2/10 · Minimal
- Chance of severe wind over 30 yrs
- 2.0%
Air-quality risk 2/10 · Minimal
- Unhealthy air days now
- 2 days/yr
- Unhealthy air days in 30 yrs
- 2 days/yr
Risk factors via First Street. Map © Google.
Why this score? — see what drove the C+ grade
The composite is a weighted blend of 9 inputs, each scored 0–100. Each bar is that input's sub-score; the figure is the points it added to the 100-point composite (weight × sub-score).
- Cash flow +26.3/30.0
- DSCR +8.9/10.0
- ARV discount +7.5/15.0
- 1% rule +6.3/10.0
- Livability +3.2/5.0
- Schools +2.8/10.0
- Rent growth +2.5/5.0
- Condition / age +2.5/5.0
- Appreciation +0.0/10.0
$96,900
🖨 Deal sheet (PDF) 📄 Offer letter ✓ Due diligence
Key facts
- 0.24 acre lot
- 2 garage spots
- Built 1989
Property features AI
Finance
- HOA & community: No association fees
Exterior
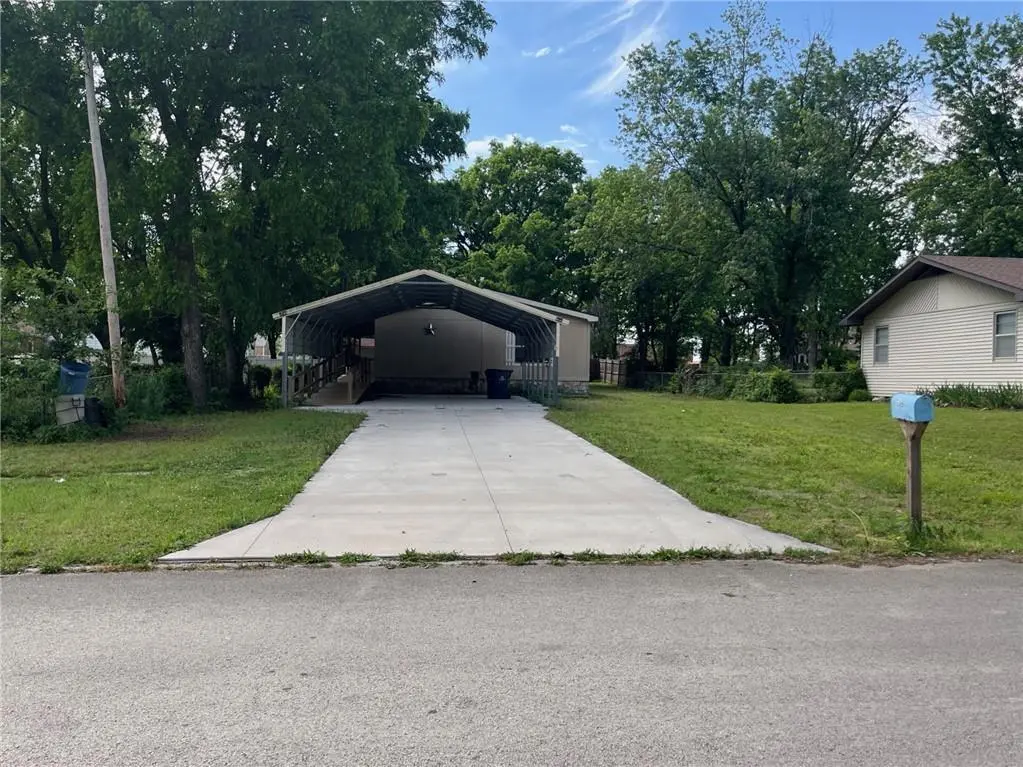
- Parking: Carport; 2-car garage
- Utilities: Public water; Public sewer
- Home design: Residential manufactured single-family residence; Attached property; 1,344 above-grade finished area
- Construction: Metal siding; Metal roof; Manufactured home (31–40 years old)
- Exterior features: Porch; Wood and other fencing; Located within city limits; Lot approximately 60 x 170 feet
Interior
- Bedrooms: 3 bedrooms (primary bedroom on the first floor)
- Flooring: Carpet; Vinyl
- Bathrooms: 2 full bathrooms
- Heating & cooling: Electric heating; Electric cooling (central)
- Interior features: Living/dining combo; Crawl space basement
- Laundry & utility: Laundry area located off the kitchen
Neighborhood map
What this means for you Summary
Snapshot
- This is a 3-bed/2.0-bath manufactured listed at $97k.
Deal economics
- At list price, monthly cash flow is $251 ($3k/yr) — positive.
- The deal already cash-flows at list — no discount required.
- Meets the 1% rule at list price ($1k rent vs $97k).
- Cap rate 9.4% vs local median 4.0% in Independence — top-decile yield for the area; either an underpriced asset or a hidden risk that comps aren't pricing in. Stress-test before assuming the spread holds.
Location & tenants
- Location reads 65/100 on livability (#285 in KS) — a middle-class / working-renter tenant base. Strengths: cost of living A+, housing A+, health & safety A-; Watch: crime F, amenities F, commute F.
- Independence (town): math 31% / reading 36% proficiency, ranked #76 of 169 in KS (top 45%) — families likely to look elsewhere, expect single-tenant / working-renter base with shorter leases.
- Zoned schools: Eisenhower Elem (391 students, 75% FRL); Independence Middle (math 25% / reading 33%, grade F, #85 of 219 statewide, top 40%, 433 students, 72% FRL) — zoned schools average 74% FRL vs 49% district-wide (25 pts higher); higher-poverty schools than district average — tighter screening recommended.
- Market conditions: 69 active listings in the ZIP; 10 units permitted in Montgomery County in 2024 (0 in 5+ unit buildings).
Forward outlook
- Local home prices are declining (-3.0%/yr); year-one equity from $670 of loan paydown is wiped out by about $3k of value loss. Plan a longer hold.
- Montgomery County population projected at -28% by 2050 — secular population decline; favor cash flow + early exit over multi-decade hold.
- At projected returns (-3.0% appreciation + 3.0% rent growth), your $27k cash investment doubles in ~10 years — after that, you're playing with house money.
Negotiation context
- Only 4 days on market — expect competitive offers; lowballing is unlikely to land.
Risks & watch-outs
- Climate carrying-cost: major wildfire risk; extreme-heat days projected 7→19/yr by 2055 (HVAC capex compounding) — expect insurance premiums to compound above CPI over the hold.
Questions for the listing agent
- Is there a deadline driving the sale (1031 exchange, divorce, estate, relocation)? That informs how much negotiation room exists.
- Schools are D-rated, which usually means shorter tenancies and higher turnover. Who's the typical renter profile here, and what's been the actual vacancy rate?
- Crime grade is F in this area — have there been break-ins, vandalism, or insurance claims at this property in the last 3 years? What carrier currently insures it and at what premium?
- What's the average days-on-market for RENTAL listings here right now (not sales)? A rising rental-DOM trend means longer vacancies and softer asking-rent achievability than the comps imply.
- What's the recent tenant-quality profile in this submarket — average credit score on applications, eviction rate, late-payment / NSF rate, and stable-employment percentage? A property-management company in the area should have these aggregated.
- How much new for-sale + rental construction is in the pipeline within 1–3 miles? Heavy new supply typically softens prices + rents 12–24 months out; constrained supply supports both.
Investment metrics
- 1% rule
- 1.13% ✓
- Cap rate
- 9.40%
- Cash-on-cash
- 11.11%
- DSCR
- 1.49
- GRM
- 7.4
CMA / ARV
No comps found within radius.
Projected returns pro-forma
-3.0% appreciation · 3.0% rent growth · sell at horizon
- IRR
- 0.3%
- Equity multiple
- 1.01×
- Total profit
- $279
- Equity at exit
- $14,448
- IRR
- 9.9%
- Equity multiple
- 1.77×
- Total profit
- $20,770
- Equity at exit
- $8,378
Cash invested: $27,132 (down + closing). Projections, not guarantees.
Landlord ↔ Tenant lean methodology
- Overall (STATE)
- 83 Strongly Landlord-Friendly
- State Kansas
- 83 Strongly Landlord-Friendly · R+10
- County
- — inherits STATE
- City
- — inherits STATE
ZIP-level market 67301
- Active inventory
- 69
- Price-to-rent
- 7.4×
Monthly cashflow live
- Estimated rent
- $1,094 medium interval (Pro) →
- Mortgage (P&I)
- −$508
- Tax from tax record
- −$65 /mo · $777/yr
- Insurance
- −$40
- HOA
- −$0
- Vacancy / Maint / Mgmt
- −$230
- Net cashflow
- $251
Break-even live
Sensitivity live
| Price | -10% $306 | -5% $279 | +0% $251 | +5% $224 | +10% $196 |
|---|---|---|---|---|---|
| Rent | -10% $165 | -5% $208 | +0% $251 | +5% $294 | +10% $338 |
| Rate | -1.0pp $300 | -0.5pp $276 | base $251 | +0.5pp $226 | +1.0pp $201 |
UW: 25.0% down · 7.5% · 30yr · 1.5% tax · 5.0% vac · 8.0% maint · 8.0% mgmt
Financing live
Cash to close
- Down payment
- $24,225
- Closing costs
- $2,907
- Reserves months
- —
- Total cash needed
- —
Loan-product check · same deal, 3 products live
Conventional
25% down · 7.5% · 30yr
- Down + closing
- —
- Monthly P&I
- —
- Monthly cashflow
- —
- DSCR
- —
- Eligible?
- —
Personal DTI + credit; lowest rate.
DSCR
20% down · 8.5% · 30yr
- Down + closing
- —
- Monthly P&I
- —
- Monthly cashflow
- —
- DSCR
- —
- Eligible?
- —
No personal income docs; deal must DSCR.
Hard money
10% down · 12.0% · 12mo
- Down + closing
- —
- Monthly P&I
- —
- Monthly cashflow
- —
- DSCR
- —
- Eligible?
- —
Short-term bridge; refi at stabilization.
Listing history 8 events
-
2026-06-22days on market $96,900 Active 4 DOM
-
2026-06-21days on market $96,900 Active 3 DOM
-
2026-06-21pricestatusdays on market $96,900 Active 2 DOM
-
2026-05-07status Pending
-
2026-05-05$94,900 Active
-
2025-04-14soldstatus
-
2022-05-04soldstatus
-
2017-09-26soldstatus
ⓘ Source: listings_history table (triggers on properties + properties_extension) + one-shot
backfill from property_details.listing_events for pre-trigger history.
Tax reassessment forecast KS · Resets to sale price
- Current annual tax
- $777 · $65/mo
- Projected year-2 tax
- $1,366 · $114/mo
- Expected delta
- +$590/yr (+$49/mo · 75.9%)
ⓘ Screening estimate from a state-policy table — verify with the county assessor before closing.
Climate risk First Street
- Flood 1/10 Low FEMA zone X (unshaded) · 0% chance over 30 yrs
- Wildfire 6/10 Major
- Heat 5/10 Major 7 d/yr ≥109°F today · 19 d/yr by 30 yrs out
- Wind 2/10 Low 2% chance of damaging wind over 30 yrs
- Air quality 2/10 Low 2 unhealthy d/yr today · 2 by 30 yrs out
Nearby sold comps map
Loading sold comps map…
Walkable amenities ~0.75 mi
Loading nearby amenities…
Taxation est. · year 1
- Rental income
- $13,131
- − Mortgage interest
- −$5,428
- − Property taxes
- −$777
- − Insurance
- −$484
- − Repairs & maintenance
- −$1,050
- − Management
- −$1,050
- − Depreciation
- −$2,819
- Taxable income
- $1,522
- Est. tax owed @ 24.0%
- −$365
- After-tax cash flow
- $2,649/yr
For passive investors: Depreciation is non-cash, so a rental often shows a tax loss while cash-flowing — sheltering income. Rental losses are passive: they offset passive income freely, and up to $25,000/yr can offset ordinary (W-2) income if you actively participate and your MAGI is under $100k (phasing out to $0 by $150k); unused losses carry forward. On sale, claimed depreciation is recaptured at up to 25%, and gains may owe capital-gains tax (a 1031 exchange can defer both). Figures are a year-1 estimate at your 24.0% rate — not tax advice; consult a CPA.
Schools (NCES district)
- District
- Independence
- NCES district ID
- 2007650
- Math proficiency
- 31% ▼ -4.00%
- Reading proficiency
- 36% ▲ 1.00%
- Median HH income
- $43,327
- Composite
- 28.45/100
- National rank
- #6750
- State rank
- #76 of 169 in KS
Livability — Independence
- Score
- 65/100
- State rank
- #285
- US rank
- #12779
Category grades
Schools grade is shown separately in the Schools card above.
Census & demographics
- Census place
- Independence, KS
- Population (ZIP)
- 12,996
Population outlook (Montgomery County) Hauer SSP2
- Today (2025)
- 29,729 people
- By 2030
- 27,786 · -6.5%
- By 2040
- 24,201 · -18.6%
- By 2050
- 21,280 · -28.4%
- By 2075
- 16,754 · -43.6%
- By 2100
- 14,088 · -52.6%
Race, ethnicity, and origin ACS 2023
- Neighborhood character
- Predominantly White (81%)
- Race & ethnicity
- White 81% Two or more races 10% Hispanic / Latino 6% Black 2% Native American 2%
- Hispanic origin (detail)
- Mexican 5%
- Common ancestry
- Lithuanian 2% Slovak 2% Italian 2%
- Foreign-born
- 2% · Canada
- Languages at home
- 96% English-only · Spanish 3% German/W. Germanic 1%
Political lean MEDSL · Montgomery
- 2024 margin
- Solid R (+51.1) · D 23.6% · R 74.7% · Other 1.8%
- 2008→2024 swing
- -15.3pp toward R · 2008: -35.8pp · 2024: -51.1pp
- All cycles
- 2024: R+51.1 2020: R+50.2 2016: R+50.8 2012: R+41.4 2008: R+35.8
Not yet ingested
- Civics
- —
Market trends
- HPI YoY
- ▼ -77.85%
- Current HPI
- 126.8212
- Rent YoY
- —
- Metro
- —
- State GDP YoY
- —
- F500 in state
- 0
Price history
5 events — show timeline
- 2026-05-07 Pending — Heartland MLS as Distributed by MLS Grid
- 2026-05-05 Listed $94,900 Heartland MLS as Distributed by MLS Grid
- 2025-04-14 Sold (Public Records) — Public Records
- 2022-05-04 Sold (Public Records) — Public Records
- 2017-09-26 Sold (Public Records) — Public Records
Property tax history
-4.1%/yrLatest (2025): $777 · -1.7% YoY. Source: county tax records.
Cash-flow waterfall
monthlySold comps — $/sqft
last 12 mo · ≤1 miLoading sold comps…