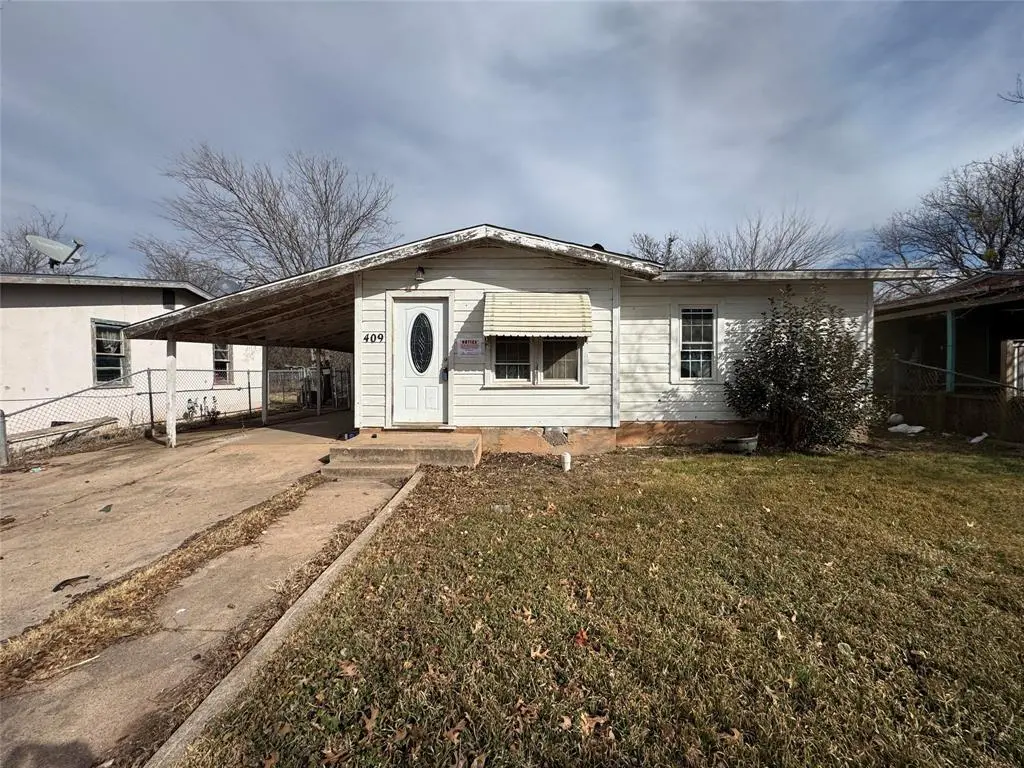
409 Cockerell Dr · Abilene, TX
Flood risk 5/10 · Moderate
- FEMA flood zone
- AE
- Chance of flooding over 30 yrs
- 0.24%
- Est. flood insurance / yr
- $1,737 – $8,500
Fire risk 3/10 · Minor
- Est. fire insurance / yr
- $1,222 – $2,270
Heat risk 6/10 · Moderate
- Hot days now (above 104°F)
- 7 days/yr
- Hot days in 30 yrs
- 22 days/yr
Wind risk 4/10 · Minor
- Chance of severe wind over 30 yrs
- 11.0%
Air-quality risk 1/10 · Minimal
- Unhealthy air days now
- 0 days/yr
- Unhealthy air days in 30 yrs
- 0 days/yr
Risk factors via First Street. Map © Google.
Why this score? — see what drove the B grade
The composite is a weighted blend of 9 inputs, each scored 0–100. Each bar is that input's sub-score; the figure is the points it added to the 100-point composite (weight × sub-score).
- Cash flow +30.0/30.0
- 1% rule +10.0/10.0
- DSCR +10.0/10.0
- ARV discount +7.5/15.0
- Rent growth +5.0/5.0
- Livability +3.8/5.0
- Schools +2.8/10.0
- Condition / age +2.5/5.0
- Appreciation +0.0/10.0
$60,000
🖨 Deal sheet 📄 Offer letter ✓ Due diligence
Listing remarks MLS
INVESTOR'S SPECIAL - we submit this burnt offering, a condemned 3-bedroom, 2-bath home for your consideration. Bring your ideas and cash to renovate.
Key facts
- 6,273 sq ft lot
- Parking
- Built 1954
Neighborhood map
What this means for you Summary
Snapshot
- This is a 3-bed/1.0-bath single-family listed at $60k.
Deal economics
- At list price, monthly cash flow is $979 ($12k/yr) — positive.
- The deal already cash-flows at list — no discount required.
- Meets the 1% rule at list price ($2k rent vs $60k).
- Recommended offer: $53k (12.0% below list) — sets the bar for market timing.
- Cap rate 34.4% vs local median 6.7% in Abilene — top-decile yield for the area; either an underpriced asset or a hidden risk that comps aren't pricing in. Stress-test before assuming the spread holds.
Location & tenants
- Location reads 75/100 on livability (#142 in TX, #4,037 nationally) — a middle-class / working-renter tenant base. Strengths: cost of living A+, housing A+, health & safety A+; Watch: schools D+, crime D, commute F.
- Abilene ISD (urban): math 32% / reading 34% proficiency, ranked #575 of 826 in TX (top 70%) — families likely to look elsewhere, expect single-tenant / working-renter base with shorter leases.
- Market conditions: Rents rising fast (+43.4%/yr); 195 active listings in the ZIP; 5 comparable units currently listed for rent nearby; rentals leasing fast (median 13d on market — plan ~1-2 weeks tenant-placement turnaround); 508 units permitted in Taylor County in 2024 (0 in 5+ unit buildings).
- At $2,308/mo this rent would consume 52% of the median local household income ($54k/yr) (locally 1240% of renters already pay >50% of income on rent) — very limited rent-growth headroom before tenants either downsize or default.
Forward outlook
- Local home prices are declining (-3.0%/yr); year-one equity from $415 of loan paydown is wiped out by about $2k of value loss. Plan a longer hold.
- Taylor County population projected at +16% by 2050 — long-run rental-demand tailwind backs the buy-and-hold thesis.
- At projected returns (-3.0% appreciation + 8.0% rent growth), your $17k cash investment doubles in ~2 years — after that, you're playing with house money.
Negotiation context
- It's been on market 136 days — a 12% lower offer ($53k) is reasonable based on typical stale-listing flexibility.
- 2 sale attempts; this cycle's ask has dropped $10k (14%) from the opening price — seller is motivated, your offer sets the floor, not the list.
Risks & watch-outs
- Watch-outs: flood insurance adds $427/mo; built in 1954 — expect roof / HVAC / electrical / plumbing capex.
- Climate carrying-cost: in FEMA flood zone AE (mandatory federal flood insurance); extreme-heat days projected 7→22/yr by 2055 (HVAC capex compounding) — expect insurance premiums to compound above CPI over the hold.
Questions for the listing agent
- It's been on market 136 days. Have you received any prior offers? Is the seller open to a 12% concession, seller financing, or rate buy-down credit?
- Built in 1954 — when were the roof, HVAC, electrical panel, plumbing, and water heater last replaced?
- What's the actual annual flood-insurance premium (NFIP or private), and is the property in a SFHA with mandatory coverage?
- Why hasn't it sold? Are there any deal-killer items the seller is aware of (foundation, flood, title, zoning, code violations)?
- Is there a deadline driving the sale (1031 exchange, divorce, estate, relocation)? That informs how much negotiation room exists.
- Schools are D-rated, which usually means shorter tenancies and higher turnover. Who's the typical renter profile here, and what's been the actual vacancy rate?
- Crime grade is D in this area — have there been break-ins, vandalism, or insurance claims at this property in the last 3 years? What carrier currently insures it and at what premium?
- What's the average days-on-market for RENTAL listings here right now (not sales)? A rising rental-DOM trend means longer vacancies and softer asking-rent achievability than the comps imply.
- What's the recent tenant-quality profile in this submarket — average credit score on applications, eviction rate, late-payment / NSF rate, and stable-employment percentage? A property-management company in the area should have these aggregated.
- How much new for-sale + rental construction is in the pipeline within 1–3 miles? Heavy new supply typically softens prices + rents 12–24 months out; constrained supply supports both.
Investment metrics
- 1% rule
- 3.85% ✓
- Cap rate
- 34.40%
- Cash-on-cash
- 100.38%
- DSCR
- 5.47
- GRM
- 2.2
CMA / ARV
- ARV (median comp)
- $197,834
- List price
- $60,000
- Delta
- -69.67%
- Verdict
- UNDERPRICED
- Comps
- 20 within 1.0 mi
Show comp detail 12 sales within ~0.75 mi
| Address | Dist | Beds/Ba | Sqft | Sold | Price | $/sf | Match |
|---|---|---|---|---|---|---|---|
| 758 N Carver St | 0.34mi | 3/2.0 | 1,260 (-10%) | 11mo | $159,900 | $127 | 55 |
| 914 Minda St | 0.65mi | 3/2.0 | 1,250 (-10%) | 1mo | $203,000 | $162 | 48 |
| 910 Minda St | 0.65mi | 3/2.0 | 1,250 (-10%) | 1mo | $203,000 | $162 | 48 |
| 906 Minda St | 0.63mi | 3/2.0 | 1,250 (-10%) | 2mo | $203,000 | $162 | 48 |
| 902 Minda St | 0.64mi | 3/2.0 | 1,250 (-10%) | 2mo | $203,000 | $162 | 47 |
| 1034 Piedmont Dr | 0.75mi | 3/2.0 | 1,538 (+10%) | 0mo | $275,000 | $179 | 44 |
| 898 Minda St | 0.64mi | 3/2.0 | 1,250 (-10%) | 8mo | $203,000 | $162 | 42 |
| 894 Minda St | 0.63mi | 3/2.0 | 1,250 (-10%) | 9mo | $203,000 | $162 | 42 |
| 833 E North 10th St | 0.71mi | 3/2.0 | 1,546 (+11%) | 12mo | $219,000 | $142 | 35 |
| 634 Harwell St | 0.55mi | 3/2.0 | 1,577 (+13%) | 20mo | $230,000 | $146 | 32 |
| 1009 Piedmont Dr | 0.69mi | 3/2.0 | 1,570 (+13%) | 13mo | $213,000 | $136 | 32 |
| 742 E North 11th St | 0.71mi | 3/2.0 | 1,222 (-12%) | 19mo | $145,000 | $119 | 26 |
Match score weights: distance 35% · size 25% · config 20% · recency 20%. Top-matched comps best support the ARV.
Projected returns pro-forma
-3.0% appreciation · 8.0% rent growth · sell at horizon
- IRR
- 76.8%
- Equity multiple
- 4.88×
- Total profit
- $65,110
- Equity at exit
- $8,946
- IRR
- 82.2%
- Equity multiple
- 12.53×
- Total profit
- $193,693
- Equity at exit
- $5,188
Cash invested: $16,800 (down + closing). Projections, not guarantees.
Landlord ↔ Tenant lean methodology
- Overall (STATE)
- 87 Strongly Landlord-Friendly
- State Texas
- 87 Strongly Landlord-Friendly · R+5
- County
- — inherits STATE
- City
- — inherits STATE
ZIP-level market 79601
- Home prices YoY
- -22.8%
- Rents YoY
- 43.4%
- Active inventory
- 195
- Price-to-rent
- 2.2×
Monthly cashflow live
- Estimated rent
- $2,308 high interval (Pro) →
- Mortgage (P&I)
- −$315
- Tax from tax record
- −$78 /mo · $941/yr
- Insurance
- −$25
- Flood insurance flood zone
- −$427 /mo · $5,118/yr
- HOA
- −$0
- Vacancy / Maint / Mgmt
- −$485
- Net cashflow
- $979
Break-even live
UW: 25.0% down · 7.5% · 30yr · 1.5% tax · 5.0% vac · 8.0% maint · 8.0% mgmt
Financing live
Cash to close
- Down payment
- $15,000
- Closing costs
- $1,800
- Reserves months
- —
- Total cash needed
- —
Loan-product check · same deal, 3 products live
Conventional
25% down · 7.5% · 30yr
- Down + closing
- —
- Monthly P&I
- —
- Monthly cashflow
- —
- DSCR
- —
- Eligible?
- —
Personal DTI + credit; lowest rate.
DSCR
20% down · 8.5% · 30yr
- Down + closing
- —
- Monthly P&I
- —
- Monthly cashflow
- —
- DSCR
- —
- Eligible?
- —
No personal income docs; deal must DSCR.
Hard money
10% down · 12.0% · 12mo
- Down + closing
- —
- Monthly P&I
- —
- Monthly cashflow
- —
- DSCR
- —
- Eligible?
- —
Short-term bridge; refi at stabilization.
Rent comps 5 comps
| Address | Beds | Baths | Sqft | Rent | $/sqft | DOM | Units | Dist |
|---|---|---|---|---|---|---|---|---|
| 874 N Judge Ely Blvd Abilene, TX | 2.0 | 1.0 | 928 | $1,595 | $1.72 | 20d | 1 | 0.68mi |
| 921 Bruce Way Abilene, TX | 3.0 | 2.0 | 1156 | $3,200 | $2.77 | 13d | 1 | 0.91mi |
| 702 N 13th St Abilene, TX | 3.0 | 2.0 | 1334 | $2,200 | $1.65 | 13d | 1 | 1.06mi |
| 1426 Plum St Abilene, TX | 3.0 | 2.0 | 1090 | $2,014 | $1.85 | 13d | 1 | 1.14mi |
| 619 Poplar St Abilene, TX | 2.0 | 1.0 | 884 | $1,695 | $1.92 | 13d | 1 | 1.47mi |
Listing history 23 events
-
2026-06-19days on market $60,000 Active 136 DOM
-
2026-06-18days on market $60,000 Active 135 DOM
-
2026-06-17days on market $60,000 Active 134 DOM
-
2026-06-16days on market $60,000 Active 133 DOM
-
2026-06-15days on market $60,000 Active 132 DOM
-
2026-06-14days on market $60,000 Active 130 DOM
-
2026-06-13days on market $60,000 Active 129 DOM
-
2026-06-10days on market $60,000 Active 127 DOM
-
2026-06-09days on market $60,000 Active 126 DOM
-
2026-06-08days on market $60,000 Active 125 DOM
-
2026-06-07days on market $60,000 Active 124 DOM
-
2026-06-03days on market $60,000 Active 120 DOM
-
2026-06-02days on market $60,000 Active 119 DOM
-
2026-06-01days on market $60,000 Active 118 DOM
-
2026-05-31days on market $60,000 Active 117 DOM
-
2026-05-30days on market $60,000 Active 116 DOM
-
2026-04-16price $60,000 149-char remark
Show marketing remark (149 chars)
INVESTOR'S SPECIAL - we submit this burnt offering, a condemned 3-bedroom, 2-bath home for your consideration. Bring your ideas and cash to renovate.
-
2026-04-15status Active 149-char remark
Show marketing remark (149 chars)
INVESTOR'S SPECIAL - we submit this burnt offering, a condemned 3-bedroom, 2-bath home for your consideration. Bring your ideas and cash to renovate.
-
2026-04-10historical Active Option Contract 149-char remark
Show marketing remark (149 chars)
INVESTOR'S SPECIAL - we submit this burnt offering, a condemned 3-bedroom, 2-bath home for your consideration. Bring your ideas and cash to renovate.
-
2026-03-05price $65,000 149-char remark
Show marketing remark (149 chars)
INVESTOR'S SPECIAL - we submit this burnt offering, a condemned 3-bedroom, 2-bath home for your consideration. Bring your ideas and cash to renovate.
-
2026-02-03$70,000 Active 149-char remark
Show marketing remark (149 chars)
INVESTOR'S SPECIAL - we submit this burnt offering, a condemned 3-bedroom, 2-bath home for your consideration. Bring your ideas and cash to renovate.
-
2013-03-20soldstatus
-
1994-07-06soldstatus
ⓘ Source: listings_history table (triggers on properties + properties_extension) + one-shot
backfill from property_details.listing_events for pre-trigger history.
Tax reassessment forecast TX · Resets to sale price
- Current annual tax
- $941 · $78/mo
- Projected year-2 tax
- $1,098 · $92/mo
- Expected delta
- +$157/yr (+$13/mo · 16.7%)
ⓘ Screening estimate from a state-policy table — verify with the county assessor before closing.
Climate risk First Street
- Flood 5/10 Major FEMA zone AE · 24% chance over 30 yrs
- Wildfire 3/10 Moderate
- Heat 6/10 Major 7 d/yr ≥104°F today · 22 d/yr by 30 yrs out
- Wind 4/10 Moderate 11% chance of damaging wind over 30 yrs
- Air quality 1/10 Low 0 unhealthy d/yr today · 0 by 30 yrs out
Nearby sold comps map
Loading sold comps map…
Walkable amenities ~0.75 mi
Loading nearby amenities…
Taxation est. · year 1
- Rental income
- $27,696
- − Mortgage interest
- −$3,361
- − Property taxes
- −$941
- − Insurance
- −$5,418
- − Repairs & maintenance
- −$2,216
- − Management
- −$2,216
- − Depreciation
- −$1,745
- Taxable income
- $11,799
- Est. tax owed @ 24.0%
- −$2,832
- After-tax cash flow
- $8,913/yr
For passive investors: Depreciation is non-cash, so a rental often shows a tax loss while cash-flowing — sheltering income. Rental losses are passive: they offset passive income freely, and up to $25,000/yr can offset ordinary (W-2) income if you actively participate and your MAGI is under $100k (phasing out to $0 by $150k); unused losses carry forward. On sale, claimed depreciation is recaptured at up to 25%, and gains may owe capital-gains tax (a 1031 exchange can defer both). Figures are a year-1 estimate at your 24.0% rate — not tax advice; consult a CPA.
Schools (NCES district)
- District
- Abilene ISD
- NCES district ID
- 4807440
- Math proficiency
- 32% ▼ -11.00%
- Reading proficiency
- 34% ▼ -5.00%
- Median HH income
- $39,782
- Composite
- 27.71/100
- National rank
- #6909
- State rank
- #575 of 826 in TX
Livability — Abilene
- Score
- 75/100
- State rank
- #142
- US rank
- #4037
Category grades
Schools grade is shown separately in the Schools card above.
Census & demographics
- Census place
- Abilene, TX
- County
- Taylor County · 136,672 people
- City population
- 136,672
- Metro
- Abilene, TX
- Population (ZIP)
- 28,050
- Household income
- $53,631
- Rent vs Own
- Severe rent burden
- 1240.0
Population outlook (Taylor County) Hauer SSP2
- Today (2025)
- 145,270 people
- By 2030
- 150,050 · +3.3%
- By 2040
- 159,417 · +9.7%
- By 2050
- 168,883 · +16.3%
- By 2075
- 194,436 · +33.8%
- By 2100
- 203,163 · +39.9%
Race, ethnicity, and origin ACS 2023
- Neighborhood character
- Diverse neighborhood (Simpson 0.61)
- Race & ethnicity
- White 55% Hispanic / Latino 25% Black 13% Two or more races 13% Asian 3%
- Hispanic origin (detail)
- Mexican 21%
- Common ancestry
- Italian 2% Lithuanian 2% Serbian 1%
- Foreign-born
- 7% · Canada, Vietnam
- Languages at home
- 81% English-only · Spanish 15% French/Haitian/Cajun 1% Vietnamese 1%
Political lean MEDSL · Taylor
- 2024 margin
- Solid R (+49.8) · D 24.6% · R 74.4% · Other 1.0%
- 2008→2024 swing
- -4.2pp toward R · 2008: -45.6pp · 2024: -49.8pp
- All cycles
- 2024: R+49.8 2020: R+45.3 2016: R+51.1 2012: R+53.6 2008: R+45.6
Not yet ingested
- Civics
- —
Market trends
- HPI YoY
- ▼ -63.17%
- Current HPI
- 214.4372
- Rent YoY
- ▲ 43.38%
- Metro
- Abilene, TX
- State GDP YoY
- ▲ 3.95%
- F500 in state
- 110
Industry mix (Fortune 500 HQ in TX)
| Industry | F500 HQs | Revenue |
|---|---|---|
| Energy | 16 | $1,198B |
|
||
| Technology | 5 | $198B |
|
||
| Engineering / Construction | 4 | $72B |
|
||
| Energy Services | 3 | $60B |
|
||
| Utilities | 3 | $41B |
|
||
| Healthcare | 2 | $330B |
|
||
Price history
-14.3% since first listed7 events — show timeline
- 2026-04-16 Price Changed $60,000 NTREIS
- 2026-04-15 Relisted — NTREIS
- 2026-04-10 Contingent — NTREIS
- 2026-03-05 Price Changed $65,000 NTREIS
- 2026-02-03 Listed $70,000 NTREIS
- 2013-03-20 Sold (Public Records) — Public Records
- 1994-07-06 Sold (Public Records) — Public Records
Property tax history
+38.6%/yrLatest (2025): $941 · +18.2% YoY. Source: county tax records.
Cash-flow waterfall
monthlySold comps — $/sqft
last 12 mo · ≤1 miLoading sold comps…