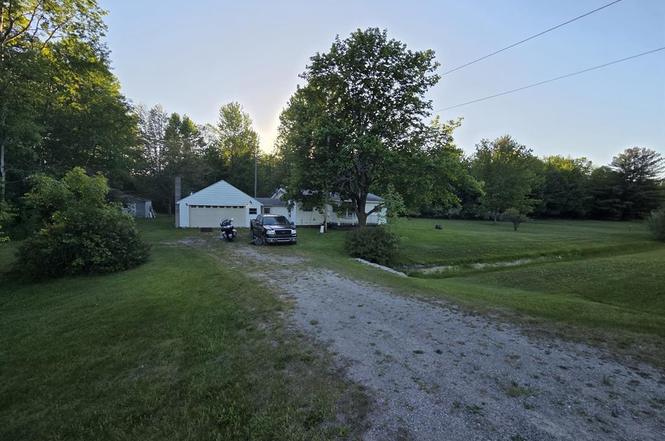
730 S M 65 · Arenac, MI
Flood risk 3/10 · Minor
- FEMA flood zone
- X (unshaded)
- Chance of flooding over 30 yrs
- 0.2%
- Est. flood insurance / yr
- $507 – $1,088
Fire risk 3/10 · Minor
- Est. fire insurance / yr
- $784 – $1,456
Heat risk 2/10 · Minimal
- Hot days now (above 94°F)
- 7 days/yr
- Hot days in 30 yrs
- 13 days/yr
Wind risk 1/10 · Minimal
- Chance of severe wind over 30 yrs
- —
Air-quality risk 2/10 · Minimal
- Unhealthy air days now
- 1 days/yr
- Unhealthy air days in 30 yrs
- 1 days/yr
Risk factors via First Street. Map © Google.
Why this score? — see what drove the B- grade
The composite is a weighted blend of 9 inputs, each scored 0–100. Each bar is that input's sub-score; the figure is the points it added to the 100-point composite (weight × sub-score).
- Cash flow +27.0/30.0
- DSCR +9.3/10.0
- Appreciation +8.3/10.0
- ARV discount +7.5/15.0
- 1% rule +6.2/10.0
- Schools +3.7/10.0
- Rent growth +2.5/5.0
- Livability +2.5/5.0
- Condition / age +2.5/5.0
$99,900
🖨 Deal sheet (PDF) 📄 Offer letter ✓ Due diligence
Listing remarks MLS
A golden opportunity in this 3 bedroom ranch home with attached garage in Twining. Fully updated in 2024. Backyard is overlooking 800 acres of state and DNR lands. Fully furnished. All appliances and goodies present at showing time might be included in the sale. Priced below market for a quick sale, Selling agent and purchaser to verify data.
Key facts
- Attached garage
- Fully furnished
- 1 acre lot
Tags
Property features AI
Exterior
- Parking: Attached garage with 2 parking spaces
- Utilities: Private well water; Septic tank sewer
- Home design: Single-family residence; One level; Ground-level entry
- Construction: Aluminum siding; Asphalt roof
- Exterior features: Paved road access; Lot approximately 1 acre (150 x 130)
Interior
- Bathrooms: 1 full bathroom
- Heating & cooling: Forced air heating; Propane heating; No central cooling
- Interior features: Crawl space basement; Total of 4 rooms
Neighborhood map
What this means for you Summary
Snapshot
- This is a 3-bed/1.0-bath single-family listed at $100k.
Deal economics
- At list price, monthly cash flow is $280 ($3k/yr) — positive.
- The deal already cash-flows at list — no discount required.
- Meets the 1% rule at list price ($1k rent vs $100k).
- Recommended offer: $98k (1.5% below list) — sets the bar for market timing.
Location & tenants
- Location reads: area grade B — affects rentability + tenant quality, not the cash-flow math above.
- Standish-Sterling Community Schools (rural): math 37% / reading 51% proficiency, ranked #168 of 540 in MI (top 31%) — families likely to look elsewhere, expect single-tenant / working-renter base with shorter leases.
- Zoned schools: Standishsterling Central Jrsr High School (math 36% / reading 63%, grade D, #154 of 713 statewide, top 25%, 694 students, 58% FRL).
- Market conditions: 12 active listings in the ZIP; 30 units permitted in Arenac County in 2024 (0 in 5+ unit buildings).
Forward outlook
- In year one you build about $7k of equity ($691 loan paydown + $7k appreciation (6.6% local appreciation)).
- Arenac County population projected at -32% by 2050 — secular population decline; favor cash flow + early exit over multi-decade hold.
- At projected returns (6.6% appreciation + 3.0% rent growth), your $28k cash investment doubles in ~3 years — after that, you're playing with house money.
- By year 5, paydown + projected appreciation supports a ~$32k cash-out refi (75% LTV) — recoverable capital for the next deal without selling this one.
Negotiation context
- It's been on market 22 days — a 2% lower offer ($98k) is reasonable based on typical stale-listing flexibility.
- 2 sale attempts; this cycle's ask has dropped $10k (9%) from the opening price — seller is motivated, your offer sets the floor, not the list.
- Current owner paid $58k; list at $100k implies a 72% gain — meaningful room to come down on a strong offer.
Questions for the listing agent
- Built in 1970 — when were the roof, HVAC, electrical panel, plumbing, and water heater last replaced?
- Is there a deadline driving the sale (1031 exchange, divorce, estate, relocation)? That informs how much negotiation room exists.
- What's the average days-on-market for RENTAL listings here right now (not sales)? A rising rental-DOM trend means longer vacancies and softer asking-rent achievability than the comps imply.
- What's the recent tenant-quality profile in this submarket — average credit score on applications, eviction rate, late-payment / NSF rate, and stable-employment percentage? A property-management company in the area should have these aggregated.
- How much new for-sale + rental construction is in the pipeline within 1–3 miles? Heavy new supply typically softens prices + rents 12–24 months out; constrained supply supports both.
Investment metrics
- 1% rule
- 1.12% ✓
- Cap rate
- 9.65%
- Cash-on-cash
- 12.00%
- DSCR
- 1.53
- GRM
- 7.4
CMA / ARV
No comps found within radius.
Projected returns pro-forma
6.64% appreciation · 3.0% rent growth · sell at horizon
- IRR
- 26.6%
- Equity multiple
- 2.80×
- Total profit
- $50,430
- Equity at exit
- $66,850
- IRR
- 24.6%
- Equity multiple
- 5.77×
- Total profit
- $133,459
- Equity at exit
- $124,887
Cash invested: $27,972 (down + closing). Projections, not guarantees.
Landlord ↔ Tenant lean methodology
- Overall (STATE)
- 62 Landlord-Friendly
- State Michigan
- 62 Landlord-Friendly · EVEN
- County
- — inherits STATE
- City
- — inherits STATE
ZIP-level market 48766
- Home prices YoY
- 3.2%
- Active inventory
- 12
- Price-to-rent
- 7.4×
Monthly cashflow live
- Estimated rent
- $1,120 medium interval (Pro) →
- Mortgage (P&I)
- −$524
- Tax from tax record
- −$39 /mo · $470/yr
- Insurance
- −$42
- HOA
- −$0
- Lot rent
- −$0
- Vacancy / Maint / Mgmt
- −$235
- Net cashflow
- $280
Break-even live
Sensitivity live
| Price | -10% $336 | -5% $308 | +0% $280 | +5% $251 | +10% $223 |
|---|---|---|---|---|---|
| Rent | -10% $191 | -5% $236 | +0% $280 | +5% $324 | +10% $368 |
| Rate | -1.0pp $330 | -0.5pp $305 | base $280 | +0.5pp $254 | +1.0pp $228 |
UW: 25.0% down · 7.5% · 30yr · 1.5% tax · 5.0% vac · 8.0% maint · 8.0% mgmt
Financing live
Cash to close
- Down payment
- $24,975
- Closing costs
- $2,997
- Reserves months
- —
- Total cash needed
- —
Loan-product check · same deal, 3 products live
Conventional
25% down · 7.5% · 30yr
- Down + closing
- —
- Monthly P&I
- —
- Monthly cashflow
- —
- DSCR
- —
- Eligible?
- —
Personal DTI + credit; lowest rate.
DSCR
20% down · 8.5% · 30yr
- Down + closing
- —
- Monthly P&I
- —
- Monthly cashflow
- —
- DSCR
- —
- Eligible?
- —
No personal income docs; deal must DSCR.
Hard money
10% down · 12.0% · 12mo
- Down + closing
- —
- Monthly P&I
- —
- Monthly cashflow
- —
- DSCR
- —
- Eligible?
- —
Short-term bridge; refi at stabilization.
Listing history 18 events
-
2026-06-22days on market $99,900 Active 22 DOM
-
2026-06-21days on market $99,900 Active 21 DOM
-
2026-06-21days on market $99,900 Active 20 DOM
-
2026-06-18days on market $99,900 Active 18 DOM
-
2026-06-17days on market $99,900 Active 17 DOM
-
2026-06-16days on market $99,900 Active 16 DOM
-
2026-06-15days on market $99,900 Active 15 DOM
-
2026-06-13days on market $99,900 Active 13 DOM
-
2026-06-12days on market $99,900 Active 12 DOM
-
2026-06-09days on market $99,900 Active 9 DOM
-
2026-06-08pricedays on market $99,900 Active 8 DOM
-
2026-06-07days on market $109,900 Active 7 DOM
-
2026-06-07days on market $109,900 Active 6 DOM
-
2026-06-04days on market $109,900 Active 3 DOM
-
2026-06-02remarks 412-char remark
-
2026-06-02days on market $109,900 Active 2 DOM
-
2026-06-01remarks 344-char remark
-
2026-06-01$109,900 Active 1 DOM
ⓘ Source: listings_history table (triggers on properties + properties_extension) + one-shot
backfill from property_details.listing_events for pre-trigger history.
Tax reassessment forecast MI · Partial reset (capped growth)
- Current annual tax
- $470 · $39/mo
- Projected year-2 tax
- $1,004 · $84/mo
- Expected delta
- +$534/yr (+$45/mo · 113.7%)
ⓘ Screening estimate from a state-policy table — verify with the county assessor before closing.
Climate risk First Street
- Flood 3/10 Moderate FEMA zone X (unshaded) · 20% chance over 30 yrs
- Wildfire 3/10 Moderate
- Heat 2/10 Low 7 d/yr ≥94°F today · 13 d/yr by 30 yrs out
- Wind 1/10 Low
- Air quality 2/10 Low 1 unhealthy d/yr today · 1 by 30 yrs out
Nearby sold comps map
Loading sold comps map…
Walkable amenities ~0.75 mi
Loading nearby amenities…
Taxation est. · year 1
- Rental income
- $13,434
- − Mortgage interest
- −$5,596
- − Property taxes
- −$470
- − Insurance
- −$500
- − Repairs & maintenance
- −$1,075
- − Management
- −$1,075
- − Depreciation
- −$2,906
- Taxable income
- $1,813
- Est. tax owed @ 24.0%
- −$435
- After-tax cash flow
- $2,922/yr
For passive investors: Depreciation is non-cash, so a rental often shows a tax loss while cash-flowing — sheltering income. Rental losses are passive: they offset passive income freely, and up to $25,000/yr can offset ordinary (W-2) income if you actively participate and your MAGI is under $100k (phasing out to $0 by $150k); unused losses carry forward. On sale, claimed depreciation is recaptured at up to 25%, and gains may owe capital-gains tax (a 1031 exchange can defer both). Figures are a year-1 estimate at your 24.0% rate — not tax advice; consult a CPA.
Schools (NCES district)
- District
- Standish-Sterling Community Schools
- NCES district ID
- 2632940
- Math proficiency
- 37% ▼ -6.00%
- Reading proficiency
- 51% ▼ -3.00%
- Median HH income
- $39,526
- Composite
- 36.76/100
- National rank
- #4573
- State rank
- #168 of 540 in MI
Livability — Arenac
No livability data for this city. (Only ~50 U.S. cities are tracked.)
Census & demographics
- Population (ZIP)
- 1,372
Population outlook (Arenac County) Hauer SSP2
- Today (2025)
- 14,036 people
- By 2030
- 13,189 · -6.0%
- By 2040
- 11,309 · -19.4%
- By 2050
- 9,616 · -31.5%
- By 2075
- 6,776 · -51.7%
- By 2100
- 4,997 · -64.4%
Race, ethnicity, and origin ACS 2023
- Neighborhood character
- Predominantly White (94%)
- Race & ethnicity
- White 94% Hispanic / Latino 3% Two or more races 3% Native American 2%
- Common ancestry
- Romanian 8% Lithuanian 5% Iranian 1%
- Foreign-born
- 0%
- Languages at home
- 96% English-only · Spanish 3% German/W. Germanic 1%
Political lean MEDSL · Arenac
- 2024 margin
- Solid R (+40.6) · D 29.1% · R 69.7% · Other 1.3%
- 2008→2024 swing
- -44.9pp toward R · 2008: 4.3pp · 2024: -40.6pp
- All cycles
- 2024: R+40.6 2020: R+35.7 2016: R+33.1 2012: R+4.9 2008: D+4.3
Not yet ingested
- Civics
- —
Market trends
- HPI YoY
- ▲ 6.64%
- Current HPI
- 212.4649
- Rent YoY
- —
- Metro
- —
- State GDP YoY
- ▲ 1.37%
- F500 in state
- 28
Industry mix (Fortune 500 HQ in MI)
| Industry | F500 HQs | Revenue |
|---|---|---|
| Automotive Parts | 3 | $48B |
|
||
| Automotive | 2 | $372B |
|
||
| Chemicals | 1 | $45B |
|
||
| Automotive Retail | 1 | $29B |
|
||
| Healthcare / Medical Devices | 1 | $23B |
|
||
| Automotive Technology | 1 | $20B |
|
||
Price history
+89.5% since first listed3 events — show timeline
- 2026-06-01 Listed $109,900 REALCOMP
- 2026-05-31 Listed $109,900 MiRealSource-MiMLS
- 2021-12-20 Sold (Public Records) $58,000 Public Records
Property tax history
-3.9%/yrLatest (2025): $470 · -77.2% YoY. Source: county tax records.
Cash-flow waterfall
monthlySold comps — $/sqft
last 12 mo · ≤1 miLoading sold comps…