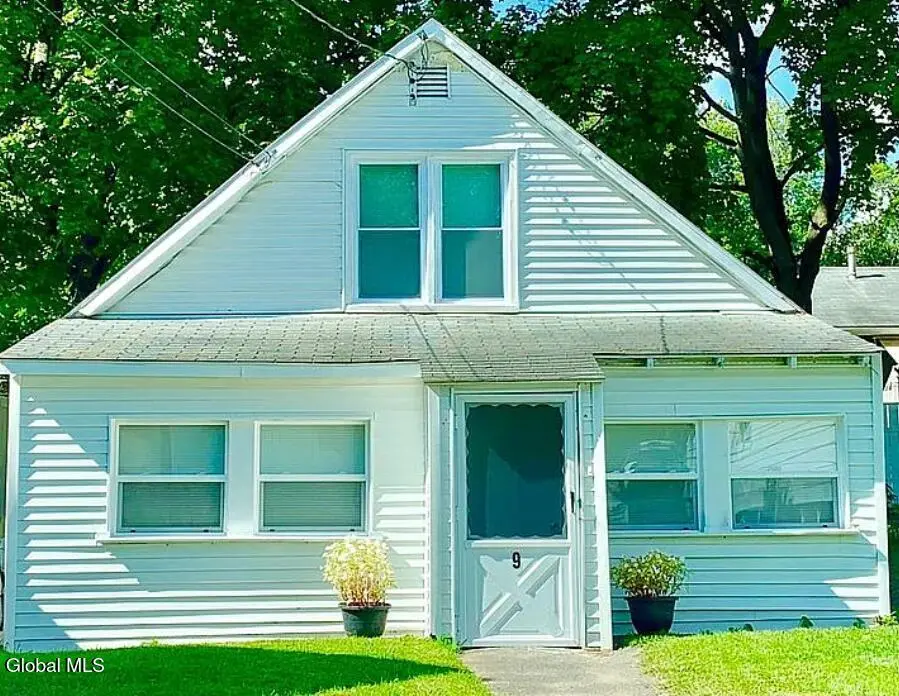
9 Kellogg Ave · Niskayuna, NY
Flood risk 1/10 · Minimal
- FEMA flood zone
- X (unshaded)
- Chance of flooding over 30 yrs
- 0.0%
- Est. flood insurance / yr
- $507 – $1,088
Fire risk 2/10 · Minimal
- Est. fire insurance / yr
- $691 – $1,283
Heat risk 3/10 · Minor
- Hot days now (above 96°F)
- 7 days/yr
- Hot days in 30 yrs
- 16 days/yr
Wind risk 3/10 · Minor
- Chance of severe wind over 30 yrs
- 5.0%
Air-quality risk 1/10 · Minimal
- Unhealthy air days now
- 0 days/yr
- Unhealthy air days in 30 yrs
- 0 days/yr
Risk factors via First Street. Map © Google.
Why this score? — see what drove the C grade
The composite is a weighted blend of 9 inputs, each scored 0–100. Each bar is that input's sub-score; the figure is the points it added to the 100-point composite (weight × sub-score).
- Cash flow +18.6/30.0
- ARV discount +15.0/15.0
- DSCR +5.8/10.0
- Schools +5.3/10.0
- 1% rule +5.1/10.0
- Livability +4.5/5.0
- Rent growth +2.5/5.0
- Condition / age +2.5/5.0
- Appreciation +0.0/10.0
$179,900
🖨 Deal sheet 📄 Offer letter ✓ Due diligence
Listing remarks
* * OPEN HOUSE Sat, June 6 from 12-2 PM * * Why rent when you can own?! For as little as $1400 a month, this starter home could be YOURS! Conveniently situated near Central Ave and Balltown Road in South Colonie Schools, this property offers easy access to shopping, dining, and everyday conveniences while tucked away on a quiet, dead-end street. Step inside to discover an open concept first floor featuring stylish luxury vinyl plank flooring, flowing seamlessly into the kitchen which boasts stainless steel appliances. You'll be pleased to find a fully renovated bathroom, washer/dryer, LOW taxes, and a wide driveway with space to fit 4 cars. A fantastic opportunity in a great location -
Key facts
- Wide driveway
- 3,049 sq ft lot
- 4 parking spots
Tags
Property features AI
Exterior
- Parking: Four parking spaces; Paved driveway
- Security: Carbon monoxide detector(s)
- Utilities: 150 amp electric service; Public water; Public sewer; Cable available
- Home design: Single family residence; Slab foundation
- Construction: Vinyl siding
- Exterior features: Asphalt roof; Level lot
Interior
- Kitchen: Range; Dishwasher; Refrigerator; Gas water heater
- Bedrooms: Primary bedroom on second level; Additional bedroom on first level
- Flooring: Vinyl flooring
- Bathrooms: One full bathroom on the first level; Primary bathroom on the first level
- Heating & cooling: Forced air heating; Natural gas heating
- Interior features: Built-in features; Sliding doors
- Laundry & utility: Washer/dryer included; Laundry on main level
Neighborhood map
What this means for you Summary
Snapshot
- This is a 2-bed/1.0-bath single-family listed at $180k.
Deal economics
- At list price, monthly cash flow is $174 ($2k/yr) — positive.
- The deal already cash-flows at list — no discount required.
- Meets the 1% rule at list price ($2k rent vs $180k).
- Cap rate 7.5% vs local median 2.6% in Niskayuna — top-decile yield for the area; either an underpriced asset or a hidden risk that comps aren't pricing in. Stress-test before assuming the spread holds.
Location & tenants
- Location reads 91/100 on livability (#3 in NY, #51 nationally) — a professional / high-income tenant draw. Strengths: commute A+, employment A+, housing A+; Watch: cost of living F.
- South Colonie Central School District (suburban): math 63% / reading 57% proficiency, ranked #215 of 590 in NY (top 36%) — acceptable for families but not a draw, mixed tenant base, ~2y average lease; only 19% free/reduced lunch — higher-income household profile.
- Zoned schools: Colonie Central High School (math 96% / reading 72%, grade A, #404 of 1,100 statewide, top 37%, 1,538 students, 39% FRL) — zoned schools average 39% FRL vs 19% district-wide (20 pts higher); higher-poverty schools than district average — tighter screening recommended.
- Zoned-school proficiency averages 84% at this address vs 60% district-wide (+24 pts) — the actual schools serving this property are materially stronger than the South Colonie Central School District average implies; a family-tenant draw the district grade alone would hide.
- Market conditions: 106 active listings in the ZIP; 3 comparable units currently listed for rent nearby; rentals at typical pace (median 14d on market — plan ~3-4 weeks tenant-placement turnaround); 675 units permitted in Albany County in 2024 (451 in 5+ unit buildings).
Forward outlook
- Local home prices are declining (-3.0%/yr); year-one equity from $1k of loan paydown is wiped out by about $5k of value loss. Plan a longer hold.
- Albany County population projected at +9% by 2050 — modest demand growth; plan on rents tracking national, not racing it.
Negotiation context
- Only 7 days on market — expect competitive offers; lowballing is unlikely to land.
- 2 sale attempts with the ask held roughly flat each time — persistent listings suggest the price (not the market) is what's stuck; bring a comps-based counter.
- Current owner paid $145k; 24% above their basis — modest negotiation headroom, anchor on the comps not their cost.
Risks & watch-outs
- Watch-outs: built in 1916 — expect roof / HVAC / electrical / plumbing capex.
Questions for the listing agent
- Built in 1916 — when were the roof, HVAC, electrical panel, plumbing, and water heater last replaced?
- Is there a deadline driving the sale (1031 exchange, divorce, estate, relocation)? That informs how much negotiation room exists.
- Schools are A-rated — typically a magnet for longer-tenancy family renters. What's the average tenant stay here, and is there a school-zone premium baked into asking?
- What's the average days-on-market for RENTAL listings here right now (not sales)? A rising rental-DOM trend means longer vacancies and softer asking-rent achievability than the comps imply.
- What's the recent tenant-quality profile in this submarket — average credit score on applications, eviction rate, late-payment / NSF rate, and stable-employment percentage? A property-management company in the area should have these aggregated.
- How much new for-sale + rental construction is in the pipeline within 1–3 miles? Heavy new supply typically softens prices + rents 12–24 months out; constrained supply supports both.
Investment metrics
- 1% rule
- 1.01% ✓
- Cap rate
- 7.46%
- Cash-on-cash
- 4.15%
- DSCR
- 1.18
- GRM
- 8.2
CMA / ARV
- ARV (median comp)
- $249,138
- List price
- $179,900
- Delta
- -13.70%
- Verdict
- UNDERPRICED
- Comps
- 20 within 1.0 mi
Show comp detail 5 sales within ~0.75 mi
| Address | Dist | Beds/Ba | Sqft | Sold | Price | $/sf | Match |
|---|---|---|---|---|---|---|---|
| 1 Kenmore Ave | 0.13mi | 2/1.0 | 840 (-2%) | 12mo | $160,000 | $190 | 80 |
| 107 Fox Ave | 0.51mi | 2/1.0 | 869 (+1%) | 15mo | $170,000 | $196 | 62 |
| 72 Cordell Rd | 0.32mi | 3/1.0 (+1) | 950 (+10%) | 2mo | $185,000 | $195 | 61 |
| 34 Fullerton Ave | 0.37mi | 2/1.0 | 768 (-11%) | 10mo | $195,000 | $254 | 57 |
| 24 Canton St | 0.26mi | 2/1.0 | 929 (+8%) | 22mo | $146,500 | $158 | 56 |
Match score weights: distance 35% · size 25% · config 20% · recency 20%. Top-matched comps best support the ARV.
Projected returns pro-forma
-3.0% appreciation · 3.0% rent growth · sell at horizon
- IRR
- -9.8%
- Equity multiple
- 0.64×
- Total profit
- $-18,004
- Equity at exit
- $26,824
- IRR
- -0.3%
- Equity multiple
- 0.98×
- Total profit
- $-1,205
- Equity at exit
- $15,554
Cash invested: $50,372 (down + closing). Projections, not guarantees.
Landlord ↔ Tenant lean methodology
- Overall (STATE)
- 15 Strongly Tenant-Friendly
- State New York
- 15 Strongly Tenant-Friendly · D+10
- County
- — inherits STATE
- City
- — inherits STATE
ZIP-level market 12304
- Home prices YoY
- -25.5%
- Active inventory
- 106
- Price-to-rent
- 8.2×
Monthly cashflow live
- Estimated rent
- $1,826 medium interval (Pro) →
- Mortgage (P&I)
- −$943
- Tax from tax record
- −$250 /mo · $2,996/yr
- Insurance
- −$75
- HOA
- −$0
- Vacancy / Maint / Mgmt
- −$383
- Net cashflow
- $174
Break-even live
UW: 25.0% down · 7.5% · 30yr · 1.5% tax · 5.0% vac · 8.0% maint · 8.0% mgmt
Financing live
Cash to close
- Down payment
- $44,975
- Closing costs
- $5,397
- Reserves months
- —
- Total cash needed
- —
Loan-product check · same deal, 3 products live
Conventional
25% down · 7.5% · 30yr
- Down + closing
- —
- Monthly P&I
- —
- Monthly cashflow
- —
- DSCR
- —
- Eligible?
- —
Personal DTI + credit; lowest rate.
DSCR
20% down · 8.5% · 30yr
- Down + closing
- —
- Monthly P&I
- —
- Monthly cashflow
- —
- DSCR
- —
- Eligible?
- —
No personal income docs; deal must DSCR.
Hard money
10% down · 12.0% · 12mo
- Down + closing
- —
- Monthly P&I
- —
- Monthly cashflow
- —
- DSCR
- —
- Eligible?
- —
Short-term bridge; refi at stabilization.
Rent comps 3 comps
| Address | Beds | Baths | Sqft | Rent | $/sqft | DOM | Units | Dist |
|---|---|---|---|---|---|---|---|---|
| 66 Cordell Rd Schenectady, NY | 2.0 | 1.0 | 744 | $1,900 | $2.55 | 43d | 1 | 0.31mi |
| 4208 Court Royale Schenectady, NY | 2.0 | 1.0 | 860 | $1,590 | $1.85 | 13d | 1 | 1.37mi |
| 4219 Menga Dr Schenectady, NY | 2.0 | 1.0 | 865 | $1,775 | $2.05 | 14d | 1 | 1.41mi |
Listing history 10 events
-
2026-06-10status $179,900 Pending 7 DOM
-
2026-06-09days on market $179,900 Active 7 DOM
-
2026-06-08days on market $179,900 Active 6 DOM
-
2026-06-07days on market $179,900 Active 5 DOM
-
2026-06-05days on market $179,900 Active 2 DOM
-
2026-06-03remarks 699-char remark
-
2026-06-03pricestatusdays on market $179,900 Active 1 DOM
-
2026-05-18historical
-
2026-04-12$215,000 Active
-
2021-09-16soldstatus $145,000
ⓘ Source: listings_history table (triggers on properties + properties_extension) + one-shot
backfill from property_details.listing_events for pre-trigger history.
Tax reassessment forecast NY · Partial reset (capped growth)
- Current annual tax
- $2,996 · $250/mo
- Projected year-2 tax
- $3,018 · $251/mo
- Expected delta
- +$22/yr (+$2/mo · 0.7%)
ⓘ Screening estimate from a state-policy table — verify with the county assessor before closing.
Climate risk First Street
- Flood 1/10 Low FEMA zone X (unshaded) · 0% chance over 30 yrs
- Wildfire 2/10 Low
- Heat 3/10 Moderate 7 d/yr ≥96°F today · 16 d/yr by 30 yrs out
- Wind 3/10 Moderate 5% chance of damaging wind over 30 yrs
- Air quality 1/10 Low 0 unhealthy d/yr today · 0 by 30 yrs out
Nearby sold comps map
Loading sold comps map…
Walkable amenities ~0.75 mi
Loading nearby amenities…
Taxation est. · year 1
- Rental income
- $21,909
- − Mortgage interest
- −$10,077
- − Property taxes
- −$2,996
- − Insurance
- −$900
- − Repairs & maintenance
- −$1,753
- − Management
- −$1,753
- − Depreciation
- −$5,233
- Taxable loss
- −$802
- Est. tax savings @ 24.0%
- +$192
- After-tax cash flow
- $2,285/yr
For passive investors: Depreciation is non-cash, so a rental often shows a tax loss while cash-flowing — sheltering income. Rental losses are passive: they offset passive income freely, and up to $25,000/yr can offset ordinary (W-2) income if you actively participate and your MAGI is under $100k (phasing out to $0 by $150k); unused losses carry forward. On sale, claimed depreciation is recaptured at up to 25%, and gains may owe capital-gains tax (a 1031 exchange can defer both). Figures are a year-1 estimate at your 24.0% rate — not tax advice; consult a CPA.
Schools (NCES district)
- District
- South Colonie Central School District
- NCES district ID
- 3627210
- Math proficiency
- 63% ▼ -1.00%
- Reading proficiency
- 57% ▲ 4.00%
- Median HH income
- $69,499
- Composite
- 52.97/100
- National rank
- #1527
- State rank
- #215 of 590 in NY
Livability — Niskayuna
- Score
- 91/100
- State rank
- #3
- US rank
- #51
Category grades
Schools grade is shown separately in the Schools card above.
Census & demographics
- City population
- 32,996
- Population (ZIP)
- 22,027
Population outlook (Albany County) Hauer SSP2
- Today (2025)
- 320,794 people
- By 2030
- 327,401 · +2.1%
- By 2040
- 338,218 · +5.4%
- By 2050
- 348,467 · +8.6%
- By 2075
- 381,693 · +19.0%
- By 2100
- 393,809 · +22.8%
Race, ethnicity, and origin ACS 2023
- Neighborhood character
- Diverse neighborhood (Simpson 0.68)
- Race & ethnicity
- White 52% Black 17% Two or more races 13% Asian 10% Hispanic / Latino 9%
- Hispanic origin (detail)
- Mexican 2% Puerto Rican 3% Dominican 2%
- Common ancestry
- Lithuanian 6% Romanian 4% Iranian 1%
- Foreign-born
- 16% · Canada, China, South Korea
- Languages at home
- 89% English-only · Other Indo-European 5% Spanish 4% Other Asian/Pacific 1%
Political lean MEDSL · Albany
- 2024 margin
- Strong D (+25.8) · D 62.9% · R 37.1%
- 2008→2024 swing
- -3.6pp toward R · 2008: 29.4pp · 2024: 25.8pp
- All cycles
- 2024: D+25.8 2020: D+31.4 2016: D+24.3 2012: D+31.0 2008: D+29.4
Not yet ingested
- Civics
- —
Market trends
- HPI YoY
- ▼ -113.18%
- Current HPI
- 331.0288
- Rent YoY
- —
- Metro
- —
- State GDP YoY
- ▲ 2.60%
- F500 in state
- 92
Industry mix (Fortune 500 HQ in NY)
| Industry | F500 HQs | Revenue |
|---|---|---|
| Financial Services | 10 | $950B |
|
||
| Consumer Goods | 9 | $162B |
|
||
| Insurance | 4 | $225B |
|
||
| Telecommunications | 2 | $144B |
|
||
| Pharmaceuticals | 2 | $112B |
|
||
| Media / Entertainment | 2 | $69B |
|
||
Price history
+24.1% since first listed5 events — show timeline
- 2026-06-09 Pending — Global MLS
- 2026-06-02 Listed $179,900 Global MLS
- 2026-05-18 Listing Removed — Global MLS
- 2026-04-12 Listed $215,000 Global MLS
- 2021-09-16 Sold (Public Records) $145,000 Public Records
Property tax history
-2.0%/yrLatest (2025): $2,996 · -5.0% YoY. Source: county tax records.
Cash-flow waterfall
monthlySold comps — $/sqft
last 12 mo · ≤1 miLoading sold comps…