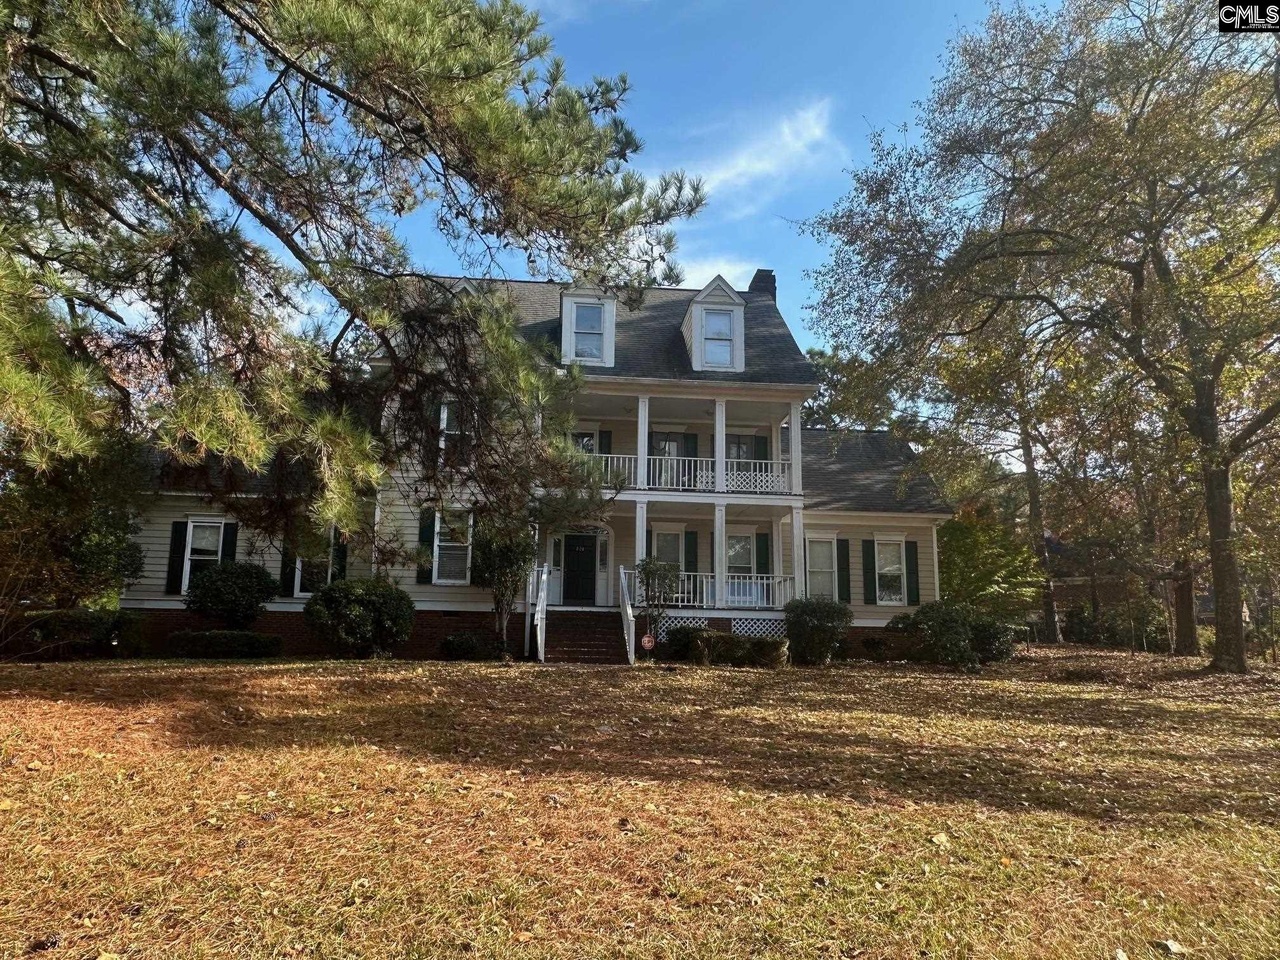
224 N Woodlake Dr · Columbia, SC
Flood risk 1/10 · Minimal
- FEMA flood zone
- X (unshaded)
- Chance of flooding over 30 yrs
- 0.0%
- Est. flood insurance / yr
- $507 – $1,088
Fire risk 4/10 · Minor
- Est. fire insurance / yr
- $783 – $1,453
Heat risk 6/10 · Moderate
- Hot days now (above 107°F)
- 7 days/yr
- Hot days in 30 yrs
- 15 days/yr
Wind risk 6/10 · Moderate
- Chance of severe wind over 30 yrs
- 67.0%
Air-quality risk 3/10 · Minor
- Unhealthy air days now
- 2 days/yr
- Unhealthy air days in 30 yrs
- 3 days/yr
Risk factors via First Street. Map © Google.
Why this score? — see what drove the B- grade
The composite is a weighted blend of 9 inputs, each scored 0–100. Each bar is that input's sub-score; the figure is the points it added to the 100-point composite (weight × sub-score).
- Cash flow +30.0/30.0
- DSCR +10.0/10.0
- 1% rule +8.8/10.0
- ARV discount +7.5/15.0
- Livability +3.9/5.0
- Schools +3.6/10.0
- Rent growth +3.2/5.0
- Condition / age +2.5/5.0
- Appreciation +0.0/10.0
$170,000
🖨 Deal sheet (PDF) 📄 Offer letter ✓ Due diligence
Listing remarks
Short Sale! Schedule a viewing of this beautiful 4-bedroom, 3-bath home and make it yours! Disclaimer: CMLS has not reviewed and, therefore, does not endorse vendors who may appear in listings.
Key facts
- 0.63 acre lot
- 2 garage spots
- Built 1992
Neighborhood map
What this means for you Summary
Snapshot
- This is a 4-bed/3.0-bath single-family listed at $170k.
Deal economics
- At list price, monthly cash flow is $792 ($10k/yr) — positive.
- The deal already cash-flows at list — no discount required.
- Meets the 1% rule at list price ($2k rent vs $170k).
- Cap rate 11.9% vs local median 5.0% in Columbia — top-decile yield for the area; either an underpriced asset or a hidden risk that comps aren't pricing in. Stress-test before assuming the spread holds.
Location & tenants
- Location reads 78/100 on livability (#18 in SC, #2,436 nationally) — a middle-class / working-renter tenant base. Strengths: amenities A+, commute A+, cost of living A+; Watch: employment D, crime F.
- Richland 02 (suburban): math 35% / reading 47% proficiency, ranked #29 of 80 in SC (top 36%) — families likely to look elsewhere, expect single-tenant / working-renter base with shorter leases.
- Zoned schools: Bookman Road Elementary (math 47% / reading 52%, grade D, #168 of 597 statewide, top 31%, 499 students, 62% FRL); Ridge View High (math 43% / reading 76%, grade C+, #110 of 196 statewide, top 58%, 1,711 students, 60% FRL) — zoned schools average 61% FRL vs 38% district-wide (23 pts higher); higher-poverty schools than district average — tighter screening recommended.
- Zoned-school proficiency averages 54% at this address vs 41% district-wide (+14 pts) — the actual schools serving this property are materially stronger than the Richland 02 average implies; a family-tenant draw the district grade alone would hide.
- Market conditions: Rents rising (+2.8%/yr); 406 active listings in the ZIP; 13 comparable units currently listed for rent nearby; rentals leasing fast (median 4d on market — plan ~1-2 weeks tenant-placement turnaround); 3,472 units permitted in Richland County in 2024 (1,096 in 5+ unit buildings).
- This rent runs 38% of the median local income ($74k/yr) — at the standard rent-burdened threshold; future hikes will face affordability resistance.
Forward outlook
- Local home prices are declining (-3.0%/yr); year-one equity from $1k of loan paydown is wiped out by about $5k of value loss. Plan a longer hold.
- Richland County population projected at +30% by 2050 — long-run rental-demand tailwind backs the buy-and-hold thesis.
- At projected returns (-3.0% appreciation + 2.8% rent growth), your $48k cash investment doubles in ~7 years — after that, you're playing with house money.
Negotiation context
- Only 1 days on market — expect competitive offers; lowballing is unlikely to land.
- 4 sale attempts since 5y ago with the ask held roughly flat each time — persistent listings suggest the price (not the market) is what's stuck; bring a comps-based counter.
Risks & watch-outs
- Climate carrying-cost: major wind risk, 67% chance of damaging wind over 30y; extreme-heat days projected 7→15/yr by 2055 (HVAC capex compounding) — expect insurance premiums to compound above CPI over the hold.
Questions for the listing agent
- What does the HOA fee cover, when was the last increase, and are there any pending special assessments or reserve-fund shortfalls?
- Is there a deadline driving the sale (1031 exchange, divorce, estate, relocation)? That informs how much negotiation room exists.
- Schools are D-rated, which usually means shorter tenancies and higher turnover. Who's the typical renter profile here, and what's been the actual vacancy rate?
- Crime grade is F in this area — have there been break-ins, vandalism, or insurance claims at this property in the last 3 years? What carrier currently insures it and at what premium?
- What's the average days-on-market for RENTAL listings here right now (not sales)? A rising rental-DOM trend means longer vacancies and softer asking-rent achievability than the comps imply.
- What's the recent tenant-quality profile in this submarket — average credit score on applications, eviction rate, late-payment / NSF rate, and stable-employment percentage? A property-management company in the area should have these aggregated.
- How much new for-sale + rental construction is in the pipeline within 1–3 miles? Heavy new supply typically softens prices + rents 12–24 months out; constrained supply supports both.
Investment metrics
- 1% rule
- 1.38% ✓
- Cap rate
- 11.88%
- Cash-on-cash
- 19.97%
- DSCR
- 1.89
- GRM
- 6.1
CMA / ARV
No comps found within radius.
Projected returns pro-forma
-3.0% appreciation · 2.81% rent growth · sell at horizon
- IRR
- 11.9%
- Equity multiple
- 1.47×
- Total profit
- $22,424
- Equity at exit
- $25,348
- IRR
- 20.7%
- Equity multiple
- 2.73×
- Total profit
- $82,518
- Equity at exit
- $14,698
Cash invested: $47,600 (down + closing). Projections, not guarantees.
Landlord ↔ Tenant lean methodology
- Overall (STATE)
- 90 Strongly Landlord-Friendly
- State South Carolina
- 90 Strongly Landlord-Friendly · R+6
- County
- — inherits STATE
- City
- — inherits STATE
ZIP-level market 29229
- Home prices YoY
- -21.5%
- Rents YoY
- 2.8%
- Active inventory
- 406
- Price-to-rent
- 6.1×
Monthly cashflow live
- Estimated rent
- $2,339 high interval (Pro) →
- Mortgage (P&I)
- −$891
- Tax from tax record
- −$60 /mo · $719/yr
- Insurance
- −$71
- HOA
- −$33
- Vacancy / Maint / Mgmt
- −$491
- Net cashflow
- $792
Break-even live
Sensitivity live
| Price | -10% $888 | -5% $840 | +0% $792 | +5% $744 | +10% $696 |
|---|---|---|---|---|---|
| Rent | -10% $607 | -5% $700 | +0% $792 | +5% $885 | +10% $977 |
| Rate | -1.0pp $878 | -0.5pp $835 | base $792 | +0.5pp $748 | +1.0pp $703 |
UW: 25.0% down · 7.5% · 30yr · 1.5% tax · 5.0% vac · 8.0% maint · 8.0% mgmt
Financing live
Cash to close
- Down payment
- $42,500
- Closing costs
- $5,100
- Reserves months
- —
- Total cash needed
- —
Loan-product check · same deal, 3 products live
Conventional
25% down · 7.5% · 30yr
- Down + closing
- —
- Monthly P&I
- —
- Monthly cashflow
- —
- DSCR
- —
- Eligible?
- —
Personal DTI + credit; lowest rate.
DSCR
20% down · 8.5% · 30yr
- Down + closing
- —
- Monthly P&I
- —
- Monthly cashflow
- —
- DSCR
- —
- Eligible?
- —
No personal income docs; deal must DSCR.
Hard money
10% down · 12.0% · 12mo
- Down + closing
- —
- Monthly P&I
- —
- Monthly cashflow
- —
- DSCR
- —
- Eligible?
- —
Short-term bridge; refi at stabilization.
Rent comps 13 comps
| Address | Beds | Baths | Sqft | Rent | $/sqft | DOM | Units | Dist |
|---|---|---|---|---|---|---|---|---|
| 499 Fox Trot Dr Columbia, SC | 4.0 | 2.5 | 2006 | $2,195 | $1.09 | 4d | 1 | 0.59mi |
| 44 Ginkgo Ct Columbia, SC | 5.0 | 3.0 | 2743 | $2,750 | $1.00 | 4d | 1 | 0.60mi |
| 221 Fox Grove Cir Unit 1 Columbia, SC | 4.0 | 2.0 | 2046 | $1,700 | $0.83 | 3d | 1 | 0.71mi |
| 201 Clearmeadow Dr Columbia, SC | 3.0 | 2.0 | 2423 | $2,379 | $0.98 | 3d | 1 | 0.98mi |
| 1964 Lake Carolina Dr Columbia, SC | 4.0 | 2.5 | 1841 | $1,939 | $1.05 | 22d | 1 | 1.05mi |
| 2000 Lake Carolina Dr Columbia, SC | 4.0 | 2.5 | 1841 | $2,089 | $1.13 | 15d | 1 | 1.08mi |
| 219 Pineclave Cir Columbia, SC | 4.0 | 3.0 | 2300 | $2,000 | $0.87 | 24d | 1 | 1.09mi |
| 252 Bassett Loop Columbia, SC | 4.0 | 3.0 | 2260 | $2,295 | $1.02 | 24d | 1 | 1.14mi |
| 456 Edenhall Dr Columbia, SC | 4.0 | 2.5 | 2158 | $2,600 | $1.20 | 24d | 1 | 1.14mi |
| 304 Longfellows Ln Elgin, SC | 4.0 | 2.5 | 2050 | $2,269 | $1.11 | 4d | 1 | 1.20mi |
| 430 Grand National Ln Elgin, SC | 4.0 | 2.5 | 2060 | $2,049 | $0.99 | 3d | 1 | 1.34mi |
| 500 Castle Ridge Dr Columbia, SC | 3.0 | 2.0 | 1753 | $2,150 | $1.23 | 4d | 1 | 1.40mi |
| 1111 Triple Crown Ct Elgin, SC | 4.0 | 2.5 | 2624 | $2,395 | $0.91 | 24d | 1 | 1.50mi |
HOA detail
- Monthly dues
- $33 · $396/yr
Listing history 15 events
-
2026-04-02status Pending
-
2026-04-01$170,000 Active
-
2025-11-23status Pending
-
2025-11-21$275,000 Active
-
2025-09-17status Pending
-
2025-09-15$275,000 Active
-
2021-06-30soldstatus $340,000
-
2021-05-21historical
-
2021-05-19$324,900 Active
-
2018-03-05soldstatus $257,000
-
2017-01-09soldstatus $257,500
-
2016-08-10price $264,500
-
1996-05-29soldstatus $208,000
-
1992-07-22soldstatus $190,000
-
1991-09-06soldstatus $33,000
ⓘ Source: listings_history table (triggers on properties + properties_extension) + one-shot
backfill from property_details.listing_events for pre-trigger history.
Tax reassessment forecast SC · Resets to sale price
- Current annual tax
- $719 · $60/mo
- Projected year-2 tax
- $969 · $81/mo
- Expected delta
- +$250/yr (+$21/mo · 34.8%)
ⓘ Screening estimate from a state-policy table — verify with the county assessor before closing.
Climate risk First Street
- Flood 1/10 Low FEMA zone X (unshaded) · 0% chance over 30 yrs
- Wildfire 4/10 Moderate
- Heat 6/10 Major 7 d/yr ≥107°F today · 15 d/yr by 30 yrs out
- Wind 6/10 Major 67% chance of damaging wind over 30 yrs
- Air quality 3/10 Moderate 2 unhealthy d/yr today · 3 by 30 yrs out
Nearby sold comps map
Loading sold comps map…
Walkable amenities ~0.75 mi
Loading nearby amenities…
Taxation est. · year 1
- Rental income
- $28,063
- − Mortgage interest
- −$9,523
- − Property taxes
- −$719
- − Insurance
- −$850
- − Repairs & maintenance
- −$2,245
- − Management
- −$2,245
- − HOA
- −$396
- − Depreciation
- −$4,945
- Taxable income
- $7,139
- Est. tax owed @ 24.0%
- −$1,713
- After-tax cash flow
- $7,793/yr
For passive investors: Depreciation is non-cash, so a rental often shows a tax loss while cash-flowing — sheltering income. Rental losses are passive: they offset passive income freely, and up to $25,000/yr can offset ordinary (W-2) income if you actively participate and your MAGI is under $100k (phasing out to $0 by $150k); unused losses carry forward. On sale, claimed depreciation is recaptured at up to 25%, and gains may owe capital-gains tax (a 1031 exchange can defer both). Figures are a year-1 estimate at your 24.0% rate — not tax advice; consult a CPA.
Schools (NCES district)
- District
- Richland 02
- NCES district ID
- 4503390
- Math proficiency
- 35% ▼ -15.00%
- Reading proficiency
- 47% ▼ -5.00%
- Median HH income
- $59,684
- Composite
- 36.2/100
- National rank
- #4730
- State rank
- #29 of 80 in SC
Livability — Columbia
- Score
- 78/100
- State rank
- #18
- US rank
- #2436
Category grades
Schools grade is shown separately in the Schools card above.
Census & demographics
- County
- Richland County · 389,530 people
- City population
- 335,994
- Metro
- Columbia, SC
- Population (ZIP)
- 51,861
- Household income
- $74,043
- Rent vs Own
- Severe rent burden
- 1939.0
Population outlook (Richland County) Hauer SSP2
- Today (2025)
- 459,667 people
- By 2030
- 487,524 · +6.1%
- By 2040
- 542,035 · +17.9%
- By 2050
- 595,371 · +29.5%
- By 2075
- 732,998 · +59.5%
- By 2100
- 820,415 · +78.5%
Race, ethnicity, and origin ACS 2023
- Neighborhood character
- Diverse neighborhood (Simpson 0.56)
- Race & ethnicity
- Black 62% White 24% Hispanic / Latino 8% Two or more races 6% Asian 3%
- Hispanic origin (detail)
- Mexican 2% Puerto Rican 2%
- Common ancestry
- Slovak 1% Lithuanian 1% Romanian 1%
- Foreign-born
- 7% · Canada, South Korea, Jamaica
- Languages at home
- 89% English-only · Spanish 6% Other Indo-European 1% Korean 1%
Political lean MEDSL · Richland
- 2024 margin
- Solid D (+34.6) · D 66.4% · R 31.8% · Other 1.8%
- 2008→2024 swing
- +5.7pp toward D · 2008: 28.9pp · 2024: 34.6pp
- All cycles
- 2024: D+34.6 2020: D+38.3 2016: D+32.9 2012: D+33.3 2008: D+28.9
Not yet ingested
- Civics
- —
Market trends
- HPI YoY
- ▼ -51.11%
- Current HPI
- 186.782
- Rent YoY
- ▲ 2.81%
- Metro
- Columbia, SC
- State GDP YoY
- ▲ 4.51%
- F500 in state
- 2
Industry mix (Fortune 500 HQ in SC)
| Industry | F500 HQs | Revenue |
|---|---|---|
| Packaging | 1 | $7B |
|
||
Price history
+415.2% since first listed15 events — show timeline
- 2026-04-02 Pending — Consolidated MLS
- 2026-04-01 Listed $170,000 Consolidated MLS
- 2025-11-23 Pending — Consolidated MLS
- 2025-11-21 Listed $275,000 Consolidated MLS
- 2025-09-17 Pending — Consolidated MLS
- 2025-09-15 Listed $275,000 Consolidated MLS
- 2021-06-30 Sold (Public Records) $340,000 Public Records
- 2021-05-21 Delisted — Consolidated MLS
- 2021-05-19 Listed $324,900 Consolidated MLS
- 2018-03-05 Sold (Public Records) $257,000 Public Records
- 2017-01-09 Sold (Public Records) $257,500 Public Records
- 2016-08-10 Price Changed $264,500 Consolidated MLS
- 1996-05-29 Sold (Public Records) $208,000 Public Records
- 1992-07-22 Sold (Public Records) $190,000 Public Records
- 1991-09-06 Sold (Public Records) $33,000 Public Records
Property tax history
-10.4%/yrLatest (2025): $719 · +3.6% YoY. Source: county tax records.
Cash-flow waterfall
monthlySold comps — $/sqft
last 12 mo · ≤1 miLoading sold comps…