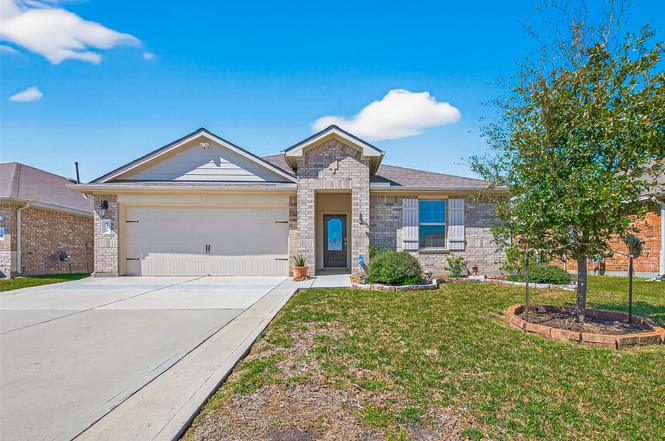
4311 Nervesa Dr · Houston, TX
Flood risk 6/10 · Moderate
- FEMA flood zone
- X (unshaded)
- Chance of flooding over 30 yrs
- 0.68%
- Est. flood insurance / yr
- $507 – $1,088
Fire risk 3/10 · Minor
- Est. fire insurance / yr
- $1,222 – $2,270
Heat risk 8/10 · Major
- Hot days now (above 110°F)
- 7 days/yr
- Hot days in 30 yrs
- 22 days/yr
Wind risk 9/10 · Severe
- Chance of severe wind over 30 yrs
- 99.0%
Air-quality risk 2/10 · Minimal
- Unhealthy air days now
- 1 days/yr
- Unhealthy air days in 30 yrs
- 2 days/yr
Risk factors via First Street. Map © Google.
Why this score? — see what drove the D- grade
The composite is a weighted blend of 9 inputs, each scored 0–100. Each bar is that input's sub-score; the figure is the points it added to the 100-point composite (weight × sub-score).
- ARV discount +8.2/15.0
- Cash flow +7.4/30.0
- Schools +5.7/10.0
- Appreciation +4.4/10.0
- 1% rule +4.0/10.0
- Livability +3.7/5.0
- Condition / age +2.5/5.0
- Rent growth +1.8/5.0
- DSCR +1.6/10.0
$280,000
🖨 Deal sheet 📄 Offer letter ✓ Due diligence
Listing remarks
Fully upgraded and beautifully maintained one-story home featuring 4 bedrooms and 2 full bathrooms. NEW ROOF, NEW VINYL PLANK FLOORING, EPOXY-COATED GARAGE FLOOR, EXTENDED DRIVEWAY, A LARGE CONCRETE BACKYARD PATIO, and A DEDICATED ORGANIC DARDEN SPACE with SPRINKLER SYSTEM. The home also includes a FREE WASHER & DRYER. The open-concept layout seamlessly connects the kitchen, dining area, and family room ----perfect for everyday living and entertaining. The large backyard offers plenty of room for outdoor gatherings, gardening, or future customization. Move-in ready and thoughtfully upgraded — this home is a must-see! Move-in ready and thoughtfully upgraded — this home is
Key facts
- Extended driveway
- New roof
- 6,873 sq ft lot
Tags
Neighborhood map
What this means for you Summary
Snapshot
- This is a 4-bed/2.0-bath single-family listed at $280k.
Deal economics
- At list price, monthly cash flow is $-359 ($-4k/yr) — negative.
- To cash-flow at today's rent, offer at most $217k (22.6% below list).
- To meet the 1% rule (rent ≥ 1% of price), the offer needs to be $253k (9.7% below list).
- Recommended offer: $217k (22.6% below list) — sets the bar for cash-flow.
- Cap rate 4.8% vs local median 3.2% in Houston — top-decile yield for the area; either an underpriced asset or a hidden risk that comps aren't pricing in. Stress-test before assuming the spread holds.
Location & tenants
- Location reads 74/100 on livability (#184 in TX, #4,771 nationally) — a middle-class / working-renter tenant base. Strengths: amenities A+, cost of living A+, housing A+; Watch: crime F.
- Katy ISD (suburban): math 61% / reading 63% proficiency, ranked #29 of 826 in TX (top 4%) — acceptable for families but not a draw, mixed tenant base, ~2y average lease.
- Zoned schools: Stockdick J H (math 41% / reading 51%, grade D+, #462 of 1,662 statewide, top 28%, 1,313 students, 55% FRL); Paetow H S (math 47% / reading 64%, grade C, #364 of 1,632 statewide, top 23%, 3,537 students, 62% FRL) — zoned schools average 58% FRL vs 27% district-wide (31 pts higher); higher-poverty schools than district average — tighter screening recommended.
- Market conditions: Rents soft (-2.9%/yr); 744 active listings in the ZIP; 40 comparable units currently listed for rent nearby; rentals at typical pace (median 17d on market — plan ~3-4 weeks tenant-placement turnaround); solid renter incomes; 29,883 units permitted in Harris County in 2024 (8,621 in 5+ unit buildings).
- This rent runs 35% of the median local income ($88k/yr) — at the standard rent-burdened threshold; future hikes will face affordability resistance.
Forward outlook
- Local home prices are declining (-1.3%/yr); year-one equity from $2k of loan paydown is wiped out by about $4k of value loss. Plan a longer hold.
- Harris County population projected at +47% by 2050 — long-run rental-demand tailwind backs the buy-and-hold thesis.
Negotiation context
- It's been on market 58 days — a 3% lower offer ($272k) is reasonable based on typical stale-listing flexibility.
Risks & watch-outs
- Watch-outs: property tax is 3.0% of price.
- Climate carrying-cost: major flood risk; severe wind risk, 99% chance of damaging wind over 30y; extreme-heat days projected 7→22/yr by 2055 (HVAC capex compounding) — expect insurance premiums to compound above CPI over the hold.
Questions for the listing agent
- What do current leases actually rent for vs. the listed asking? Can we see a recent rent roll and the last 12 months of T-12 income?
- It's been on market 58 days. Have you received any prior offers? Is the seller open to a 23% concession, seller financing, or rate buy-down credit?
- Property tax is high relative to price — has the assessment been appealed recently, and will the sale trigger a re-assessment?
- What does the HOA fee cover, when was the last increase, and are there any pending special assessments or reserve-fund shortfalls?
- Is there a deadline driving the sale (1031 exchange, divorce, estate, relocation)? That informs how much negotiation room exists.
- Schools are D-rated, which usually means shorter tenancies and higher turnover. Who's the typical renter profile here, and what's been the actual vacancy rate?
- Crime grade is F in this area — have there been break-ins, vandalism, or insurance claims at this property in the last 3 years? What carrier currently insures it and at what premium?
- The area grade is low — what's the realistic commute time and amenity access for the typical tenant pool here? Any planned neighborhood developments (good or bad) we should know about?
- What's the average days-on-market for RENTAL listings here right now (not sales)? A rising rental-DOM trend means longer vacancies and softer asking-rent achievability than the comps imply.
- What's the recent tenant-quality profile in this submarket — average credit score on applications, eviction rate, late-payment / NSF rate, and stable-employment percentage? A property-management company in the area should have these aggregated.
- How much new for-sale + rental construction is in the pipeline within 1–3 miles? Heavy new supply typically softens prices + rents 12–24 months out; constrained supply supports both.
Investment metrics
- 1% rule
- 0.90% ✗
- Cap rate
- 4.76%
- Cash-on-cash
- -5.49%
- DSCR
- 0.76
- GRM
- 9.2
CMA / ARV
- ARV (on-the-fly)
- $284,326
- Comps found
- 12
Show comp detail 12 sales within ~0.75 mi
| Address | Dist | Beds/Ba | Sqft | Sold | Price | $/sf | Match |
|---|---|---|---|---|---|---|---|
| 4311 Nervesa Dr | 0.00mi | 4/2.0 | 1,766 (0%) | 1mo | $280,000 | $159 | 99 |
| 22623 Loreto Costa Ln | 0.22mi | 4/2.0 | 1,756 (-1%) | 1mo | $296,000 | $169 | 88 |
| 4214 Fornari Ln | 0.17mi | 4/2.0 | 1,786 (+1%) | 4mo | $305,000 | $171 | 86 |
| 4315 Isoletta Ct | 0.17mi | 4/2.0 | 1,777 (+1%) | 6mo | $280,000 | $158 | 86 |
| 4403 Salerno Gulf Way | 0.25mi | 4/2.0 | 1,780 (+1%) | 6mo | $294,000 | $165 | 82 |
| 4310 Fornari Ln | 0.15mi | 4/2.0 | 1,830 (+4%) | 8mo | $295,000 | $161 | 80 |
| 4314 Verona Hills Ln | 0.14mi | 4/2.0 | 1,831 (+4%) | 9mo | $295,000 | $161 | 80 |
| 4523 Verona Hills Ln | 0.31mi | 4/2.0 | 1,801 (+2%) | 5mo | $305,000 | $169 | 78 |
| 22818 Theodoli Dr | 0.19mi | 4/2.0 | 1,630 (-8%) | 4mo | $309,000 | $190 | 75 |
| 22914 San Giorgio Ct | 0.34mi | 4/2.0 | 1,885 (+7%) | 4mo | $299,999 | $159 | 70 |
| 4318 Fenetre Forest St | 0.55mi | 3/2.0 (-1) | 1,961 (+11%) | 2mo | $310,000 | $158 | 49 |
| 22526 Belmont Cove Ln | 0.68mi | 4/2.0 | 1,930 (+9%) | 9mo | $274,999 | $142 | 45 |
Match score weights: distance 35% · size 25% · config 20% · recency 20%. Top-matched comps best support the ARV.
Projected returns pro-forma
-1.27% appreciation · 0.0% rent growth · sell at horizon
- IRR
- -17.2%
- Equity multiple
- 0.31×
- Total profit
- $-54,452
- Equity at exit
- $63,967
- IRR
- -14.3%
- Equity multiple
- -0.08×
- Total profit
- $-84,934
- Equity at exit
- $64,130
Cash invested: $78,400 (down + closing). Projections, not guarantees.
Landlord ↔ Tenant lean methodology
- Overall (STATE)
- 87 Strongly Landlord-Friendly
- State Texas
- 87 Strongly Landlord-Friendly · R+5
- County
- — inherits STATE
- City
- — inherits STATE
ZIP-level market 77449
- Home prices YoY
- -0.5%
- Rents YoY
- -2.9%
- Active inventory
- 744
- Price-to-rent
- 9.2×
Monthly cashflow live
- Estimated rent
- $2,529 high interval (Pro) →
- Mortgage (P&I)
- −$1,468
- Tax from tax record
- −$696 /mo · $8,347/yr
- Insurance
- −$117
- HOA
- −$76
- Vacancy / Maint / Mgmt
- −$531
- Net cashflow
- $-359
Break-even live
UW: 25.0% down · 7.5% · 30yr · 1.5% tax · 5.0% vac · 8.0% maint · 8.0% mgmt
Financing live
Cash to close
- Down payment
- $70,000
- Closing costs
- $8,400
- Reserves months
- —
- Total cash needed
- —
Loan-product check · same deal, 3 products live
Conventional
25% down · 7.5% · 30yr
- Down + closing
- —
- Monthly P&I
- —
- Monthly cashflow
- —
- DSCR
- —
- Eligible?
- —
Personal DTI + credit; lowest rate.
DSCR
20% down · 8.5% · 30yr
- Down + closing
- —
- Monthly P&I
- —
- Monthly cashflow
- —
- DSCR
- —
- Eligible?
- —
No personal income docs; deal must DSCR.
Hard money
10% down · 12.0% · 12mo
- Down + closing
- —
- Monthly P&I
- —
- Monthly cashflow
- —
- DSCR
- —
- Eligible?
- —
Short-term bridge; refi at stabilization.
Rent comps 40 comps
| Address | Beds | Baths | Sqft | Rent | $/sqft | DOM | Units | Dist |
|---|---|---|---|---|---|---|---|---|
| 22843 Castello Lakes Dr Katy, TX | 4.0 | 2.0 | 2036 | $2,148 | $1.06 | 22d | 1 | 0.21mi |
| 4110 Rapallo Ct Katy, TX | 4.0 | 3.0 | 2300 | $2,600 | $1.13 | 5d | 1 | 0.21mi |
| 4411 Andorno Dr Katy, TX | 4.0 | 2.0 | 2094 | $2,221 | $1.06 | 24d | 1 | 0.29mi |
| 22611 Terrazzo Dr Katy, TX | 4.0 | 3.0 | 1865 | $2,569 | $1.38 | 44d | 1 | 0.57mi |
| 22627 Terrazzo Dr Katy, TX | 3.0 | 2.5 | 1464 | $2,239 | $1.53 | 5d | 1 | 0.57mi |
| 22629 Terrazzo Dr Katy, TX | 3.0 | 2.5 | 1464 | $2,239 | $1.53 | 5d | 1 | 0.57mi |
| 23100 Clay Rd Katy, TX | 1.0–3.0 | 1.0–2.0 | 988 | $2,299 | $2.33 | 3d | 35 | 0.58mi |
| 22613 Terrazzo Dr Katy, TX | 4.0 | 3.0 | 1873 | $2,569 | $1.37 | 44d | 1 | 0.58mi |
| 22615 Terrazzo Dr Katy, TX | 4.0 | 3.0 | 1865 | $2,569 | $1.38 | 44d | 1 | 0.58mi |
| 22713 Terrazzo Dr Katy, TX | 3.0 | 2.5 | 1667 | $2,419 | $1.45 | 13d | 1 | 0.59mi |
| 21919 Clay Rd Katy, TX | 3.0 | 2.5 | 1658 | $3,574 | $2.16 | 1d | 1 | 0.59mi |
| 22617 Terrazzo Dr Katy, TX | 3.0 | 2.5 | 1464 | $2,279 | $1.56 | 44d | 1 | 0.59mi |
| 22717 Terrazzo Dr Katy, TX | 4.0 | 2.5 | 2017 | $2,629 | $1.30 | 5d | 1 | 0.61mi |
| 22737 Terrazzo Dr Katy, TX | 4.0 | 3.0 | 1873 | $2,649 | $1.41 | 44d | 1 | 0.61mi |
| 22719 Terrazzo Dr Katy, TX | 4.0 | 2.5 | 2004 | $2,559 | $1.28 | 18d | 1 | 0.61mi |
| 22628 Terrazzo Dr Katy, TX | 4.0 | 2.5 | 2017 | $2,659 | $1.32 | 15d | 1 | 0.63mi |
| 22720 Terrazzo Dr Katy, TX | 4.0 | 2.5 | 2004 | $2,559 | $1.28 | 18d | 1 | 0.63mi |
| 22626 Terrazzo Dr Katy, TX | 4.0 | 2.5 | 2004 | $2,699 | $1.35 | 44d | 1 | 0.63mi |
| 22722 Terrazzo Dr Katy, TX | 4.0 | 2.5 | 2017 | $2,559 | $1.27 | 17d | 1 | 0.63mi |
| 21919 Clay Rd Unit 21952 Katy, TX | 3.0 | 2.0 | 1608 | $2,192 | $1.36 | 3d | 1 | 0.64mi |
| 22718 Terrazzo Dr Katy, TX | 4.0 | 3.0 | 1873 | $2,439 | $1.30 | 5d | 1 | 0.64mi |
| 22624 Terrazzo Dr Katy, TX | 4.0 | 3.0 | 1865 | $2,569 | $1.38 | 44d | 1 | 0.64mi |
| 22841 Terrazzo Dr Katy, TX | 3.0 | 2.5 | 1464 | $2,249 | $1.54 | 5d | 1 | 0.64mi |
| 22716 Terrazzo Dr Katy, TX | 4.0 | 3.0 | 1865 | $2,439 | $1.31 | 5d | 1 | 0.64mi |
| 22738 Terrazzo Dr Katy, TX | 4.0 | 3.0 | 1873 | $2,539 | $1.36 | 20d | 1 | 0.65mi |
| 22851 Terazzo Dr Katy, TX | 3.0–4.0 | 2.5–3.0 | 1740 | $3,304 | $1.90 | 1d | 1 | 0.65mi |
| 22622 Terrazzo Dr Katy, TX | 4.0 | 3.0 | 1873 | $2,569 | $1.37 | 44d | 1 | 0.65mi |
| 21919 Clay Rd Unit 3047 Katy, TX | 3.0 | 2.0 | 1608 | $2,235 | $1.39 | 11d | 1 | 0.65mi |
| 22728 Terrazzo Dr Katy, TX | 3.0 | 2.5 | 1667 | $2,369 | $1.42 | 24d | 1 | 0.65mi |
| 22712 Terrazzo Dr Katy, TX | 3.0 | 2.5 | 1464 | $2,179 | $1.49 | 24d | 1 | 0.66mi |
| 22614 Terrazzo Dr Katy, TX | 4.0 | 3.0 | 1873 | $2,539 | $1.36 | 13d | 1 | 0.66mi |
| 22855 Terrazzo Dr Katy, TX | 3.0 | 2.5 | 1667 | $2,399 | $1.44 | 13d | 1 | 0.66mi |
| 22616 Terrazzo Dr Katy, TX | 4.0 | 3.0 | 1865 | $2,539 | $1.36 | 15d | 1 | 0.66mi |
| 22808 Terrazzo Dr Katy, TX | 4.0 | 2.5 | 2004 | $2,529 | $1.26 | 17d | 1 | 0.66mi |
| 22865 Terrazzo Dr Katy, TX | 4.0 | 2.5 | 2017 | $2,759 | $1.37 | 15d | 1 | 0.68mi |
| 22824 Frassino Pl Katy, TX | 4.0 | 2.5 | 2017 | $2,629 | $1.30 | 2d | 1 | 0.72mi |
| 3819 Banks Ridge Ln Katy, TX | 3.0 | 2.0 | 1315 | $2,050 | $1.56 | 44d | 1 | 0.75mi |
| 3837 Banks Ridge Ln Katy, TX | 3.0 | 2.0 | 1658 | $2,350 | $1.42 | 44d | 1 | 0.76mi |
| 3200 Peek Rd Katy, TX | 3.0 | 1.0–2.0 | 1069 | $2,351 | $2.20 | 3d | 30 | 0.96mi |
| 3206 Peek Rd Katy, TX | 3.0 | 2.0 | 1535 | $2,279 | $1.48 | 44d | 1 | 1.08mi |
HOA detail
- Monthly dues
- $76 · $912/yr
Listing history 4 events
-
2026-04-28status Pending
-
2026-04-24status Pending
-
2026-04-20price $280,000
-
2026-03-01$310,000 Active
ⓘ Source: listings_history table (triggers on properties + properties_extension) + one-shot
backfill from property_details.listing_events for pre-trigger history.
Tax reassessment forecast TX · Resets to sale price
- Current annual tax
- $8,347 · $696/mo
- Projected year-2 tax
- $8,347 · $696/mo
- Expected delta
- $0/yr ($0/mo · 0.0%)
ⓘ Screening estimate from a state-policy table — verify with the county assessor before closing.
Climate risk First Street
- Flood 6/10 Major FEMA zone X (unshaded) · 68% chance over 30 yrs
- Wildfire 3/10 Moderate
- Heat 8/10 Severe 7 d/yr ≥110°F today · 22 d/yr by 30 yrs out
- Wind 9/10 Extreme 99% chance of damaging wind over 30 yrs
- Air quality 2/10 Low 1 unhealthy d/yr today · 2 by 30 yrs out
Nearby sold comps map
Loading sold comps map…
Walkable amenities ~0.75 mi
Loading nearby amenities…
Taxation est. · year 1
- Rental income
- $30,347
- − Mortgage interest
- −$15,684
- − Property taxes
- −$8,347
- − Insurance
- −$1,400
- − Repairs & maintenance
- −$2,428
- − Management
- −$2,428
- − HOA
- −$912
- − Depreciation
- −$8,145
- Taxable loss
- −$8,998
- Est. tax savings @ 24.0%
- +$2,159
- After-tax cash flow
- $-2,146/yr
For passive investors: Depreciation is non-cash, so a rental often shows a tax loss while cash-flowing — sheltering income. Rental losses are passive: they offset passive income freely, and up to $25,000/yr can offset ordinary (W-2) income if you actively participate and your MAGI is under $100k (phasing out to $0 by $150k); unused losses carry forward. On sale, claimed depreciation is recaptured at up to 25%, and gains may owe capital-gains tax (a 1031 exchange can defer both). Figures are a year-1 estimate at your 24.0% rate — not tax advice; consult a CPA.
Schools (NCES district)
- District
- Katy ISD
- NCES district ID
- 4825170
- Math proficiency
- 61% ▼ -7.00%
- Reading proficiency
- 63% ▼ -3.00%
- Median HH income
- $90,312
- Composite
- 56.59/100
- National rank
- #1146
- State rank
- #29 of 826 in TX
Livability — Houston
- Score
- 74/100
- State rank
- #184
- US rank
- #4771
Category grades
Schools grade is shown separately in the Schools card above.
Census & demographics
- County
- Harris County · 4,702,590 people
- City population
- 3,226,434
- Metro
- Houston-The Woodlands-Sugar Land, TX
- Population (ZIP)
- 130,028
- Household income
- $87,808
- Rent vs Own
- Severe rent burden
- 3088.0
Population outlook (Harris County) Hauer SSP2
- Today (2025)
- 5,571,493 people
- By 2030
- 6,089,821 · +9.3%
- By 2040
- 7,142,806 · +28.2%
- By 2050
- 8,185,864 · +46.9%
- By 2075
- 10,574,329 · +89.8%
- By 2100
- 12,109,958 · +117.4%
Race, ethnicity, and origin ACS 2023
- Neighborhood character
- Diverse neighborhood (Simpson 0.68)
- Race & ethnicity
- Hispanic / Latino 49% Two or more races 22% Black 20% White 19% Asian 6%
- Hispanic origin (detail)
- Mexican 26% Puerto Rican 1% Cuban 4%
- Common ancestry
- Lithuanian 1% Italian 1%
- Foreign-born
- 32% · Canada, Jamaica, Vietnam
- Languages at home
- 48% English-only · Spanish 40% Other Indo-European 3% Vietnamese 1%
Political lean MEDSL · Harris
- 2024 margin
- Lean D (+5.5) · D 52.0% · R 46.4% · Other 1.6%
- 2008→2024 swing
- +3.9pp toward D · 2008: 1.6pp · 2024: 5.5pp
- All cycles
- 2024: D+5.5 2020: D+13.3 2016: D+12.4 2012: D+0.1 2008: D+1.6
Not yet ingested
- Civics
- —
Market trends
- HPI YoY
- ▼ -1.27%
- Current HPI
- 254.6622
- Rent YoY
- ▼ -2.86%
- Metro
- Houston-The Woodlands-Sugar Land, TX
- State GDP YoY
- ▲ 3.95%
- F500 in state
- 110
Industry mix (Fortune 500 HQ in TX)
| Industry | F500 HQs | Revenue |
|---|---|---|
| Energy | 16 | $1,198B |
|
||
| Technology | 5 | $198B |
|
||
| Engineering / Construction | 4 | $72B |
|
||
| Energy Services | 3 | $60B |
|
||
| Utilities | 3 | $41B |
|
||
| Healthcare | 2 | $330B |
|
||
Price history
-9.7% since first listed4 events — show timeline
- 2026-04-28 Pending — HARMLS
- 2026-04-24 Pending — HARMLS
- 2026-04-20 Price Changed $280,000 HARMLS
- 2026-03-01 Listed $310,000 HARMLS
Property tax history
+77.8%/yrLatest (2025): $8,347 · -0.4% YoY. Source: county tax records.
Cash-flow waterfall
monthlySold comps — $/sqft
last 12 mo · ≤1 miLoading sold comps…