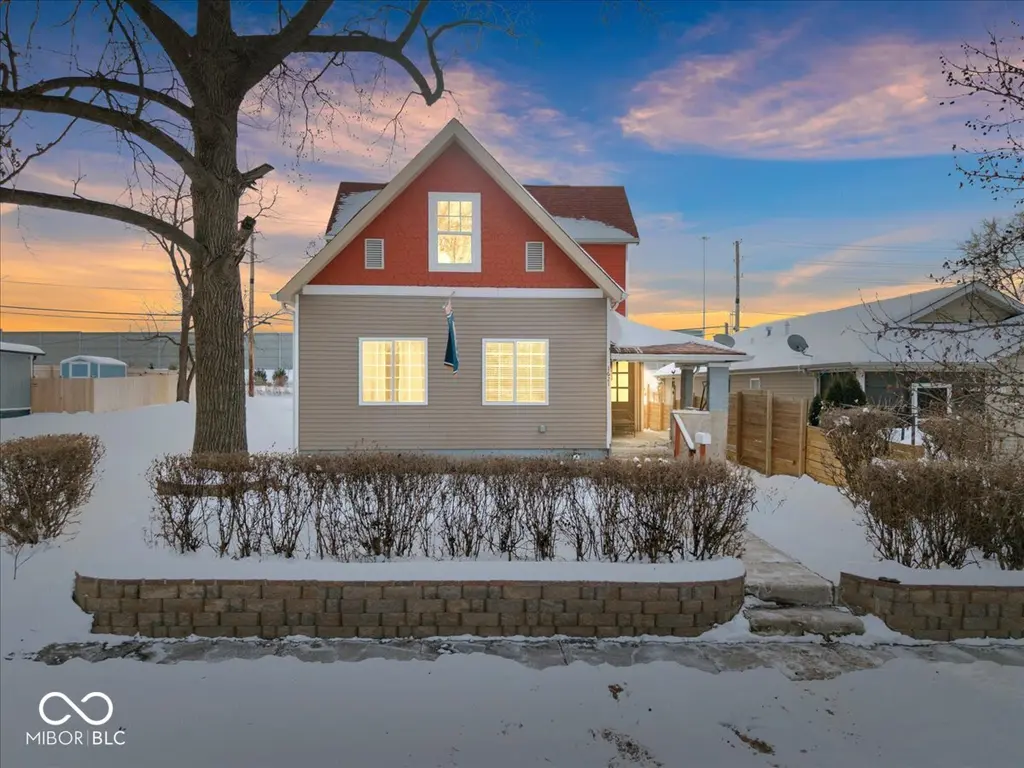
1621 Ingram St · Indianapolis city (balance), IN
Flood risk 1/10 · Minimal
- FEMA flood zone
- X (unshaded)
- Chance of flooding over 30 yrs
- 0.0%
- Est. flood insurance / yr
- $473 – $860
Fire risk 1/10 · Minimal
- Est. fire insurance / yr
- $717 – $1,331
Heat risk 4/10 · Minor
- Hot days now (above 102°F)
- 7 days/yr
- Hot days in 30 yrs
- 19 days/yr
Wind risk 2/10 · Minimal
- Chance of severe wind over 30 yrs
- 0.0%
Air-quality risk 4/10 · Minor
- Unhealthy air days now
- 5 days/yr
- Unhealthy air days in 30 yrs
- 7 days/yr
Risk factors via First Street. Map © Google.
Why this score? — see what drove the D grade
The composite is a weighted blend of 9 inputs, each scored 0–100. Each bar is that input's sub-score; the figure is the points it added to the 100-point composite (weight × sub-score).
- ARV discount +15.0/15.0
- Cash flow +13.0/30.0
- DSCR +3.9/10.0
- Rent growth +2.7/5.0
- 1% rule +2.6/10.0
- Livability +2.5/5.0
- Condition / age +2.5/5.0
- Schools +1.4/10.0
- Appreciation +0.0/10.0
$265,000
🖨 Deal sheet (PDF) 📄 Offer letter ✓ Due diligence
Listing remarks MLS
This charming two-story home, built in the 1900s, offers five bedrooms and two full bathrooms. The kitchen flows nicely into the dining and living areas, creating an open and welcoming space for everyday living and gatherings. Out back, there is a great area for kids to play or for enjoying time outdoors. This home has a warm, comfortable feel that truly stands out the moment you walk in-there's just something special about it that makes it feel like home.
Key facts
- 5,314 sq ft lot
- Built 1900
- Listed 109 days
Neighborhood map
What this means for you Summary
Snapshot
- This is a 3-bed/2.0-bath single-family listed at $265k.
Deal economics
- At list price, monthly cash flow is $-12 ($-146/yr) — negative.
- To cash-flow at today's rent, offer at most $263k (0.8% below list).
- To meet the 1% rule (rent ≥ 1% of price), the offer needs to be $200k (24.4% below list).
- Recommended offer: $200k (24.4% below list) — sets the bar for 1% rule.
- Cap rate 6.2% vs local median 4.4% in Indianapolis city (balance) — top-decile yield for the area; either an underpriced asset or a hidden risk that comps aren't pricing in. Stress-test before assuming the spread holds.
Location & tenants
- Location reads: area grade D — affects rentability + tenant quality, not the cash-flow math above.
- Indianapolis Public Schools (urban): math 14% / reading 20% proficiency, ranked #286 of 301 in IN (top 95%) — low school quality limits family demand, transient renter base, plan for 1-2y turnover; 77% free/reduced lunch — lower-income household profile, screen leases tightly.
- Zoned schools: Center For Inquiry School 27 (math 25% / reading 29%, grade F, #737 of 994 statewide, top 76%, 525 students, 51% FRL); H L Harshman Middle School (math 3% / reading 16%, grade F, #316 of 330 statewide, top 96%, 549 students, 84% FRL); Arsenal Technical High School (math 6% / reading 27%, grade F, #353 of 369 statewide, top 96%, 2,366 students, 74% FRL).
- Market conditions: Rents flat; 338 active listings in the ZIP; 40 comparable units currently listed for rent nearby; rentals at typical pace (median 26d on market — plan ~3-4 weeks tenant-placement turnaround); lower-income renter base — watch delinquency; 1,906 units permitted in Marion County in 2024 (621 in 5+ unit buildings).
- At $2,004/mo this rent would consume 63% of the median local household income ($38k/yr) (locally 2340% of renters already pay >50% of income on rent) — very limited rent-growth headroom before tenants either downsize or default.
Forward outlook
- Local home prices are declining (-3.0%/yr); year-one equity from $2k of loan paydown is wiped out by about $8k of value loss. Plan a longer hold.
- Marion County population projected at +18% by 2050 — long-run rental-demand tailwind backs the buy-and-hold thesis.
Negotiation context
- It's been on market 110 days — a 9% lower offer ($241k) is reasonable based on typical stale-listing flexibility.
- 4 sale attempts since 13y ago; this cycle's ask has dropped $35k (12%) from the opening price — seller is motivated, your offer sets the floor, not the list.
- Current owner paid $8k; list at $265k implies a 3433% gain — meaningful room to come down on a strong offer.
Risks & watch-outs
- Watch-outs: built in 1900 — expect roof / HVAC / electrical / plumbing capex.
Questions for the listing agent
- What do current leases actually rent for vs. the listed asking? Can we see a recent rent roll and the last 12 months of T-12 income?
- It's been on market 110 days. Have you received any prior offers? Is the seller open to a 24% concession, seller financing, or rate buy-down credit?
- Built in 1900 — when were the roof, HVAC, electrical panel, plumbing, and water heater last replaced?
- Why hasn't it sold? Are there any deal-killer items the seller is aware of (foundation, flood, title, zoning, code violations)?
- Is there a deadline driving the sale (1031 exchange, divorce, estate, relocation)? That informs how much negotiation room exists.
- The area grade is low — what's the realistic commute time and amenity access for the typical tenant pool here? Any planned neighborhood developments (good or bad) we should know about?
- What's the average days-on-market for RENTAL listings here right now (not sales)? A rising rental-DOM trend means longer vacancies and softer asking-rent achievability than the comps imply.
- What's the recent tenant-quality profile in this submarket — average credit score on applications, eviction rate, late-payment / NSF rate, and stable-employment percentage? A property-management company in the area should have these aggregated.
- How much new for-sale + rental construction is in the pipeline within 1–3 miles? Heavy new supply typically softens prices + rents 12–24 months out; constrained supply supports both.
Investment metrics
- 1% rule
- 0.76% ✗
- Cap rate
- 6.24%
- Cash-on-cash
- -0.20%
- DSCR
- 0.99
- GRM
- 11.0
CMA / ARV
- ARV (median comp)
- $444,681
- List price
- $265,000
- Delta
- -40.41%
- Verdict
- UNDERPRICED
- Comps
- 20 within 1.0 mi
Show comp detail 12 sales within ~0.75 mi
| Address | Dist | Beds/Ba | Sqft | Sold | Price | $/sf | Match |
|---|---|---|---|---|---|---|---|
| 1118 N Newman St | 0.45mi | 3/1.5 | 2,430 (+3%) | 0mo | $300,000 | $123 | 72 |
| 1520 Columbia Ave | 0.36mi | 3/3.5 | 2,453 (+4%) | 1mo | $585,000 | $238 | 70 |
| 1721 Alvord St | 0.44mi | 3/3.5 | 2,408 (+2%) | 1mo | $658,500 | $273 | 70 |
| 1121 N Newman St | 0.44mi | 4/1.5 (+1) | 2,454 (+4%) | 2mo | $274,000 | $112 | 64 |
| 964 Tecumseh St | 0.61mi | 3/1.5 | 2,268 (-4%) | 1mo | $260,000 | $115 | 62 |
| 719 E 17th St | 0.71mi | 3/2.5 | 2,416 (+2%) | 2mo | $350,000 | $145 | 60 |
| 2051 Columbia Ave | 0.52mi | 3/2.5 | 2,170 (-8%) | 1mo | $359,900 | $166 | 59 |
| 1826 Rosette Way | 0.50mi | 3/2.5 | 2,127 (-10%) | 1mo | $545,000 | $256 | 57 |
| 958 Stillwell St | 0.72mi | 4/3.5 (+1) | 2,412 (+2%) | 2mo | $740,000 | $307 | 50 |
| 1148 N Beville Ave | 0.57mi | 4/2.5 (+1) | 2,064 (-13%) | 2mo | $370,000 | $179 | 44 |
| 1021 N Hamilton Ave | 0.59mi | 4/2.5 (+1) | 2,058 (-13%) | 2mo | $531,000 | $258 | 42 |
| 1123 N Keystone Ave | 0.68mi | 4/3.5 (+1) | 2,627 (+11%) | 1mo | $530,000 | $202 | 38 |
Match score weights: distance 35% · size 25% · config 20% · recency 20%. Top-matched comps best support the ARV.
Projected returns pro-forma
-3.0% appreciation · 0.81% rent growth · sell at horizon
- IRR
- -18.8%
- Equity multiple
- 0.35×
- Total profit
- $-48,150
- Equity at exit
- $39,512
- IRR
- -15.9%
- Equity multiple
- 0.19×
- Total profit
- $-60,358
- Equity at exit
- $22,912
Cash invested: $74,200 (down + closing). Projections, not guarantees.
Landlord ↔ Tenant lean methodology
- Overall (STATE)
- 90 Strongly Landlord-Friendly
- State Indiana
- 90 Strongly Landlord-Friendly · R+11
- County
- — inherits STATE
- City
- — inherits STATE
ZIP-level market 46218
- Home prices YoY
- -17.1%
- Rents YoY
- 0.8%
- Active inventory
- 338
- Price-to-rent
- 11.0×
Monthly cashflow live
- Estimated rent
- $2,004 high interval (Pro) →
- Mortgage (P&I)
- −$1,390
- Tax from tax record
- −$95 /mo · $1,138/yr
- Insurance
- −$110
- HOA
- −$0
- Vacancy / Maint / Mgmt
- −$421
- Net cashflow
- $-12
Break-even live
Sensitivity live
| Price | -10% $138 | -5% $63 | +0% $-12 | +5% $-87 | +10% $-162 |
|---|---|---|---|---|---|
| Rent | -10% $-170 | -5% $-91 | +0% $-12 | +5% $67 | +10% $146 |
| Rate | -1.0pp $121 | -0.5pp $55 | base $-12 | +0.5pp $-81 | +1.0pp $-151 |
UW: 25.0% down · 7.5% · 30yr · 1.5% tax · 5.0% vac · 8.0% maint · 8.0% mgmt
Financing live
Cash to close
- Down payment
- $66,250
- Closing costs
- $7,950
- Reserves months
- —
- Total cash needed
- —
Loan-product check · same deal, 3 products live
Conventional
25% down · 7.5% · 30yr
- Down + closing
- —
- Monthly P&I
- —
- Monthly cashflow
- —
- DSCR
- —
- Eligible?
- —
Personal DTI + credit; lowest rate.
DSCR
20% down · 8.5% · 30yr
- Down + closing
- —
- Monthly P&I
- —
- Monthly cashflow
- —
- DSCR
- —
- Eligible?
- —
No personal income docs; deal must DSCR.
Hard money
10% down · 12.0% · 12mo
- Down + closing
- —
- Monthly P&I
- —
- Monthly cashflow
- —
- DSCR
- —
- Eligible?
- —
Short-term bridge; refi at stabilization.
Rent comps 40 comps
| Address | Beds | Baths | Sqft | Rent | $/sqft | DOM | Units | Dist |
|---|---|---|---|---|---|---|---|---|
| 1706 Ingram St Indianapolis, IN | 3.0 | 2.0 | 2592 | $2,000 | $0.77 | 9d | 1 | 0.08mi |
| 1226 N Beville Ave Indianapolis, IN | 3.0 | 2.5 | 3273 | $4,129 | $1.26 | 25d | 1 | 0.52mi |
| 2418 E 16th St Indianapolis, IN | 2.0 | 1.5 | 1863 | $2,125 | $1.14 | 25d | 1 | 0.55mi |
| 1314 E 10th St Indianapolis, IN | 2.0 | 2.0 | 1701 | $1,650 | $0.97 | 46d | 1 | 0.58mi |
| 2536 E 17th St Indianapolis, IN | 2.0 | 2.0 | 2086 | $1,450 | $0.70 | 6d | 1 | 0.66mi |
| 1949 Carrollton Ave Indianapolis, IN | 4.0 | 3.5 | 2617 | $2,995 | $1.14 | 45d | 1 | 0.73mi |
| 2323 N Arsenal Ave Indianapolis, IN | 4.0 | 2.0 | 1699 | $1,050 | $0.62 | 0d | 1 | 0.79mi |
| 2221 Bellefontaine St Indianapolis, IN | 3.0 | 2.5 | 1712 | $2,349 | $1.37 | 25d | 1 | 0.85mi |
| 890 Massachusetts Ave Unit 1014223P Indianapolis, IN | 3.0 | 3.0 | 1991 | $5,540 | $2.78 | 3d | 1 | 0.88mi |
| 635 Jefferson Ave Indianapolis, IN | 3.0 | 1.5 | 1744 | $1,700 | $0.97 | 45d | 1 | 0.89mi |
| 960 Eastern Ave Indianapolis, IN | 3.0 | 1.5 | 1616 | $1,500 | $0.93 | 25d | 1 | 0.89mi |
| 656 N Beville Ave Indianapolis, IN | 3.0 | 2.5 | 2121 | $3,500 | $1.65 | 25d | 1 | 0.89mi |
| 960 Eastern Ave Indianapolis, IN | 3.0 | 1.5 | 1616 | $1,500 | $0.93 | 45d | 1 | 0.89mi |
| 2246 Bellefontaine St Indianapolis, IN | 4.0 | 2.5 | 2587 | $2,300 | $0.89 | 25d | 1 | 0.90mi |
| 1813 Livery Way Indianapolis, IN | 2.0 | 2.5 | 1715 | $2,490 | $1.45 | 4d | 1 | 1.04mi |
| 1228 Central Ave Indianapolis, IN | 2.0 | 1.5 | 1599 | $1,950 | $1.22 | 13d | 1 | 1.06mi |
| 1927 N Dearborn St Indianapolis, IN | 3.0 | 1.0 | 2182 | $1,495 | $0.69 | 45d | 1 | 1.07mi |
| 1430 N New Jersey St Indianapolis, IN | 3.0 | 3.5 | 2180 | $3,000 | $1.38 | 45d | 1 | 1.08mi |
| 441 N Highland Ave Unit 445 Indianapolis, IN | 2.0 | 2.5 | 1650 | $2,400 | $1.45 | 45d | 1 | 1.10mi |
| 441 N Highland Ave Indianapolis, IN | 2.0 | 2.0 | 1650 | $2,400 | $1.45 | 45d | 1 | 1.10mi |
| 1529 N Alabama St Indianapolis, IN | 2.0 | 3.5 | 2673 | $3,750 | $1.40 | 45d | 1 | 1.11mi |
| 1529 Sturm Ave Indianapolis, IN | 3.0 | 2.0 | 1806 | $1,515 | $0.84 | 25d | 1 | 1.12mi |
| 1531 Sturm Ave Indianapolis, IN | 3.0 | 2.0 | 1806 | $1,515 | $0.84 | 25d | 1 | 1.12mi |
| 2136 Central Ave Indianapolis, IN | 3.0 | 1.0–2.0 | 1325 | $3,499 | $2.64 | 0d | 32 | 1.15mi |
| 849 N Oakland Ave Indianapolis, IN | 4.0 | 3.0 | 1638 | $2,350 | $1.43 | 13d | 1 | 1.18mi |
| 800 N Park Ave Indianapolis, IN | 2.0 | 2.0 | 2101 | $2,000 | $0.95 | 23d | 1 | 1.19mi |
| 706 Massachusetts Ave Indianapolis, IN | 2.0 | 2.5 | 1908 | $2,700 | $1.42 | 13d | 1 | 1.21mi |
| 519 Fulton St Indianapolis, IN | 3.0 | 2.5 | 1830 | $6,000 | $3.28 | 45d | 1 | 1.21mi |
| 322 N Summit St Unit 4 Indianapolis, IN | 3.0 | 3.5 | 2546 | $3,100 | $1.22 | 9d | 1 | 1.24mi |
| 1223 E New York St Indianapolis, IN | 3.0 | 3.0 | 2154 | $2,300 | $1.07 | 5d | 1 | 1.26mi |
| 1661 N Talbott St Indianapolis, IN | 3.0 | 1.5 | 2960 | $1,179 | $0.40 | 12d | 1 | 1.27mi |
| 303 N State Ave Indianapolis, IN | 3.0 | 1.0 | 1700 | $1,275 | $0.75 | 25d | 1 | 1.27mi |
| 1827 N Talbott St Indianapolis, IN | 3.0 | 2.0 | 2632 | $2,100 | $0.80 | 4d | 1 | 1.27mi |
| 2822 E Michigan St Indianapolis, IN | 3.0 | 2.0 | 1918 | $1,999 | $1.04 | 23d | 1 | 1.28mi |
| 515 N Oxford St Indianapolis, IN | 2.0 | 1.5 | 1728 | $1,050 | $0.61 | 4d | 1 | 1.28mi |
| 409 N Temple Ave Indianapolis, IN | 3.0 | 2.0 | 2106 | $1,650 | $0.78 | 45d | 1 | 1.28mi |
| 420 Eastern Ave Indianapolis, IN | 3.0 | 1.0 | 1900 | $1,325 | $0.70 | 45d | 1 | 1.29mi |
| 2318 N New Jersey St Unit 1364144P Indianapolis, IN | 3.0 | 2.0 | 1593 | $3,330 | $2.09 | 14d | 1 | 1.30mi |
| 931 N Lasalle St Indianapolis, IN | 4.0 | 2.5 | 2544 | $2,300 | $0.90 | 45d | 1 | 1.30mi |
| 909 N Lasalle St Indianapolis, IN | 3.0 | 2.0 | 1717 | $1,600 | $0.93 | 46d | 1 | 1.32mi |
Listing history 21 events
-
2026-06-21days on market $265,000 Active 110 DOM
-
2026-06-18days on market $265,000 Active 107 DOM
-
2026-06-17days on market $265,000 Active 106 DOM
-
2026-06-16days on market $265,000 Active 105 DOM
-
2026-06-15days on market $265,000 Active 104 DOM
-
2026-06-13days on market $265,000 Active 102 DOM
-
2026-06-13days on market $265,000 Active 101 DOM
-
2026-06-09days on market $265,000 Active 98 DOM
-
2026-06-08days on market $265,000 Active 97 DOM
-
2026-06-07days on market $265,000 Active 96 DOM
-
2026-06-03days on market $265,000 Active 92 DOM
-
2026-06-02days on market $265,000 Active 91 DOM
-
2026-06-01days on market $265,000 Active 90 DOM
-
2026-05-31days on market $265,000 Active 89 DOM
-
2026-04-18status Active 460-char remark
Show marketing remark (460 chars)
This charming two-story home, built in the 1900s, offers five bedrooms and two full bathrooms. The kitchen flows nicely into the dining and living areas, creating an open and welcoming space for everyday living and gatherings. Out back, there is a great area for kids to play or for enjoying time outdoors. This home has a warm, comfortable feel that truly stands out the moment you walk in-there's just something special about it that makes it feel like home.
-
2026-04-10status Active 460-char remark
Show marketing remark (460 chars)
This charming two-story home, built in the 1900s, offers five bedrooms and two full bathrooms. The kitchen flows nicely into the dining and living areas, creating an open and welcoming space for everyday living and gatherings. Out back, there is a great area for kids to play or for enjoying time outdoors. This home has a warm, comfortable feel that truly stands out the moment you walk in-there's just something special about it that makes it feel like home.
-
2026-02-25price $279,900 460-char remark
Show marketing remark (460 chars)
This charming two-story home, built in the 1900s, offers five bedrooms and two full bathrooms. The kitchen flows nicely into the dining and living areas, creating an open and welcoming space for everyday living and gatherings. Out back, there is a great area for kids to play or for enjoying time outdoors. This home has a warm, comfortable feel that truly stands out the moment you walk in-there's just something special about it that makes it feel like home.
-
2026-01-30$299,900 Active 460-char remark
Show marketing remark (460 chars)
This charming two-story home, built in the 1900s, offers five bedrooms and two full bathrooms. The kitchen flows nicely into the dining and living areas, creating an open and welcoming space for everyday living and gatherings. Out back, there is a great area for kids to play or for enjoying time outdoors. This home has a warm, comfortable feel that truly stands out the moment you walk in-there's just something special about it that makes it feel like home.
-
2013-12-05historical 126-char remark
Show marketing remark (126 chars)
2364 sq. ft., 5-bedroom, 1.5-bath, 1.5-story home built in 1900. To be SOLD AS IS. Info deemed accurate, but not guaranteed.
-
2013-12-03soldstatus $7,500 126-char remark
Show marketing remark (126 chars)
2364 sq. ft., 5-bedroom, 1.5-bath, 1.5-story home built in 1900. To be SOLD AS IS. Info deemed accurate, but not guaranteed.
-
2013-07-12$9,900 126-char remark
Show marketing remark (126 chars)
2364 sq. ft., 5-bedroom, 1.5-bath, 1.5-story home built in 1900. To be SOLD AS IS. Info deemed accurate, but not guaranteed.
ⓘ Source: listings_history table (triggers on properties + properties_extension) + one-shot
backfill from property_details.listing_events for pre-trigger history.
Tax reassessment forecast IN · Partial reset (capped growth)
- Current annual tax
- $1,138 · $95/mo
- Projected year-2 tax
- $1,695 · $141/mo
- Expected delta
- +$557/yr (+$46/mo · 49.0%)
ⓘ Screening estimate from a state-policy table — verify with the county assessor before closing.
Climate risk First Street
- Flood 1/10 Low FEMA zone X (unshaded) · 0% chance over 30 yrs
- Wildfire 1/10 Low
- Heat 4/10 Moderate 7 d/yr ≥102°F today · 19 d/yr by 30 yrs out
- Wind 2/10 Low 0% chance of damaging wind over 30 yrs
- Air quality 4/10 Moderate 5 unhealthy d/yr today · 7 by 30 yrs out
Nearby sold comps map
Loading sold comps map…
Walkable amenities ~0.75 mi
Loading nearby amenities…
Taxation est. · year 1
- Rental income
- $24,042
- − Mortgage interest
- −$14,844
- − Property taxes
- −$1,138
- − Insurance
- −$1,325
- − Repairs & maintenance
- −$1,923
- − Management
- −$1,923
- − Depreciation
- −$7,709
- Taxable loss
- −$4,820
- Est. tax savings @ 24.0%
- +$1,157
- After-tax cash flow
- $1,011/yr
For passive investors: Depreciation is non-cash, so a rental often shows a tax loss while cash-flowing — sheltering income. Rental losses are passive: they offset passive income freely, and up to $25,000/yr can offset ordinary (W-2) income if you actively participate and your MAGI is under $100k (phasing out to $0 by $150k); unused losses carry forward. On sale, claimed depreciation is recaptured at up to 25%, and gains may owe capital-gains tax (a 1031 exchange can defer both). Figures are a year-1 estimate at your 24.0% rate — not tax advice; consult a CPA.
Schools (NCES district)
- District
- Indianapolis Public Schools
- NCES district ID
- 1804770
- Math proficiency
- 14% ▼ -7.00%
- Reading proficiency
- 20% ▼ -3.00%
- Median HH income
- $32,034
- Composite
- 13.69/100
- National rank
- #9499
- State rank
- #286 of 301 in IN
Livability — Indianapolis city (balance)
No livability data for this city. (Only ~50 U.S. cities are tracked.)
Census & demographics
- Census place
- Indianapolis city (balance), IN
- County
- Marion County · 998,460 people
- City population
- 881,119
- Metro
- Indianapolis-Carmel-Anderson, IN
- Population (ZIP)
- 29,360
- Household income
- $38,063
- Rent vs Own
- Severe rent burden
- 2340.0
Population outlook (Marion County) Hauer SSP2
- Today (2025)
- 1,025,572 people
- By 2030
- 1,065,727 · +3.9%
- By 2040
- 1,141,577 · +11.3%
- By 2050
- 1,208,920 · +17.9%
- By 2075
- 1,367,288 · +33.3%
- By 2100
- 1,438,201 · +40.2%
Race, ethnicity, and origin ACS 2023
- Neighborhood character
- Predominantly Black (68%)
- Race & ethnicity
- Black 68% White 18% Hispanic / Latino 9% Two or more races 6%
- Hispanic origin (detail)
- Mexican 6%
- Common ancestry
- Romanian 1%
- Foreign-born
- 5% · Canada, Philippines
- Languages at home
- 92% English-only · Spanish 7%
Political lean MEDSL · Marion
- 2024 margin
- Strong D (+27.7) · D 63.0% · R 35.3% · Other 1.7%
- 2008→2024 swing
- -0.7pp no change · 2008: 28.4pp · 2024: 27.7pp
- All cycles
- 2024: D+27.7 2020: D+29.1 2016: D+22.8 2012: D+22.2 2008: D+28.4
Not yet ingested
- Civics
- —
Market trends
- HPI YoY
- ▼ -81.57%
- Current HPI
- 395.7071
- Rent YoY
- ▲ 0.81%
- Metro
- Indianapolis-Carmel-Anderson, IN
- State GDP YoY
- ▲ 2.90%
- F500 in state
- 18
Industry mix (Fortune 500 HQ in IN)
| Industry | F500 HQs | Revenue |
|---|---|---|
| Industrial Machinery | 2 | $37B |
|
||
| Healthcare | 1 | $177B |
|
||
| Pharmaceuticals | 1 | $45B |
|
||
| Metals / Steel | 1 | $18B |
|
||
| Agriculture | 1 | $17B |
|
||
| Packaging | 1 | $12B |
|
||
Price history
+2727.3% since first listed7 events — show timeline
- 2026-04-18 Relisted — MIBOR as Distributed by MLS Grid
- 2026-04-10 Relisted — MIBOR as Distributed by MLS Grid
- 2026-02-25 Price Changed $279,900 MIBOR as Distributed by MLS Grid
- 2026-01-30 Listed $299,900 MIBOR as Distributed by MLS Grid
- 2013-12-05 Listing Removed — MIBOR as Distributed by MLS Grid
- 2013-12-03 Sold (MLS) $7,500 MIBOR as Distributed by MLS Grid
- 2013-07-12 Listed $9,900 MIBOR as Distributed by MLS Grid
Property tax history
+9.4%/yrLatest (2025): $1,138 · +22.1% YoY. Source: county tax records.
Cash-flow waterfall
monthlySold comps — $/sqft
last 12 mo · ≤1 miLoading sold comps…