36 Hutto Ct · Forest Acres, SC
Flood risk 1/10 · Minimal
- FEMA flood zone
- X (unshaded)
- Chance of flooding over 30 yrs
- 0.0%
- Est. flood insurance / yr
- $507 – $1,088
Fire risk 1/10 · Minimal
- Est. fire insurance / yr
- $783 – $1,453
Heat risk 6/10 · Moderate
- Hot days now (above 108°F)
- 7 days/yr
- Hot days in 30 yrs
- 16 days/yr
Wind risk 6/10 · Moderate
- Chance of severe wind over 30 yrs
- 68.0%
Air-quality risk 3/10 · Minor
- Unhealthy air days now
- 2 days/yr
- Unhealthy air days in 30 yrs
- 2 days/yr
Risk factors via First Street. Map © Google.
Why this score? — see what drove the C grade
The composite is a weighted blend of 9 inputs, each scored 0–100. Each bar is that input's sub-score; the figure is the points it added to the 100-point composite (weight × sub-score).
- Cash flow +20.9/30.0
- ARV discount +8.2/15.0
- DSCR +6.7/10.0
- 1% rule +5.2/10.0
- Appreciation +5.0/10.0
- Livability +3.7/5.0
- Schools +2.6/10.0
- Rent growth +2.5/5.0
- Condition / age +2.5/5.0
$145,000
🖨 Deal sheet 📄 Offer letter ✓ Due diligence
Listing remarks
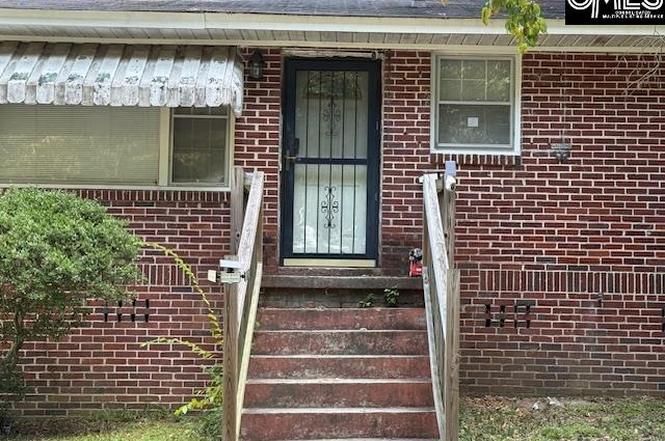
All brick home zoned for Richland School District 1 - Satchel Ford, Crayton and AC Flora. Large fenced yard with detached garage. This home requires some work but there will be a big return on your investment! Great rental history. Good investment opportunity or potential flip. Disclaimer: CMLS has not reviewed and, therefore, does not endorse vendors who may appear in listings.
Key facts
- Fenced yard
- Brick home
- Detached garage
Tags
Property features AI
Exterior
- Parking: Detached 2-car garage
- Utilities: Public water; Public sewer
- Home design: Single-story home
- Construction: Crawlspace foundation
- Exterior features: Brick exterior above foundation; Paved road access; Approximately 0.18 acre lot
Interior
- Kitchen: Kitchen on the main level
- Bedrooms: Master bedroom on main level; Bedroom 2 on main level; Bedroom 3 on main level
- Bathrooms: Two full bathrooms
- Heating & cooling: Central heating; Central air conditioning
- Interior features: One fireplace; Formal living room and great room on the main level
- Laundry & utility: Laundry in heated space on the main level
Neighborhood map
What this means for you Summary
Snapshot
- This is a 3-bed/1.0-bath single-family listed at $145k.
Deal economics
- At list price, monthly cash flow is $203 ($2k/yr) — positive.
- The deal already cash-flows at list — no discount required.
- Meets the 1% rule at list price ($1k rent vs $145k).
- Recommended offer: $128k (12.0% below list) — sets the bar for market timing.
Location & tenants
- Location reads 73/100 on livability (#39 in SC) — a middle-class / working-renter tenant base. Strengths: housing A+, cost of living A, employment A-; Watch: crime D, amenities F, commute F.
- Richland 01 (urban): math 26% / reading 36% proficiency, ranked #54 of 80 in SC (top 68%) — families likely to look elsewhere, expect single-tenant / working-renter base with shorter leases; 64% free/reduced lunch — lower-income household profile, screen leases tightly.
- Zoned schools: Satchel Ford Elementary (math 62% / reading 61%, grade B, #76 of 597 statewide, top 13%, 631 students, 100% FRL); A. C. Flora High (math 42% / reading 92%, grade B, #73 of 196 statewide, top 41%, 1,352 students, 100% FRL) — zoned schools average 100% FRL vs 64% district-wide (36 pts higher); higher-poverty schools than district average — tighter screening recommended.
- Zoned-school proficiency averages 64% at this address vs 31% district-wide (+33 pts) — the actual schools serving this property are materially stronger than the Richland 01 average implies; a family-tenant draw the district grade alone would hide.
- Market conditions: 1 active listings in the ZIP; 18 comparable units currently listed for rent nearby; rentals at typical pace (median 24d on market — plan ~3-4 weeks tenant-placement turnaround); 3,472 units permitted in Richland County in 2024 (1,096 in 5+ unit buildings).
Forward outlook
- In year one you build about $5k of equity ($1k loan paydown + $4k appreciation (3.0% local appreciation)).
- Richland County population projected at +30% by 2050 — long-run rental-demand tailwind backs the buy-and-hold thesis.
- At projected returns (3.0% appreciation + 3.0% rent growth), your $41k cash investment doubles in ~5 years — after that, you're playing with house money.
- By year 7, paydown + projected appreciation supports a ~$34k cash-out refi (75% LTV) — recoverable capital for the next deal without selling this one.
Negotiation context
- It's been on market 225 days — a 12% lower offer ($128k) is reasonable based on typical stale-listing flexibility.
- 2 sale attempts; this cycle's ask is 7% above the opening price — seller raised mid-cycle; expect resistance to lowballs.
- Current owner paid $50k; list at $145k implies a 193% gain — meaningful room to come down on a strong offer.
Risks & watch-outs
- Watch-outs: built in 1951 — expect roof / HVAC / electrical / plumbing capex.
Questions for the listing agent
- It's been on market 225 days. Have you received any prior offers? Is the seller open to a 12% concession, seller financing, or rate buy-down credit?
- Built in 1951 — when were the roof, HVAC, electrical panel, plumbing, and water heater last replaced?
- Why hasn't it sold? Are there any deal-killer items the seller is aware of (foundation, flood, title, zoning, code violations)?
- Is there a deadline driving the sale (1031 exchange, divorce, estate, relocation)? That informs how much negotiation room exists.
- Schools are A-rated — typically a magnet for longer-tenancy family renters. What's the average tenant stay here, and is there a school-zone premium baked into asking?
- Crime grade is D in this area — have there been break-ins, vandalism, or insurance claims at this property in the last 3 years? What carrier currently insures it and at what premium?
- What's the average days-on-market for RENTAL listings here right now (not sales)? A rising rental-DOM trend means longer vacancies and softer asking-rent achievability than the comps imply.
- What's the recent tenant-quality profile in this submarket — average credit score on applications, eviction rate, late-payment / NSF rate, and stable-employment percentage? A property-management company in the area should have these aggregated.
- How much new for-sale + rental construction is in the pipeline within 1–3 miles? Heavy new supply typically softens prices + rents 12–24 months out; constrained supply supports both.
Investment metrics
- 1% rule
- 1.02% ✓
- Cap rate
- 7.97%
- Cash-on-cash
- 5.99%
- DSCR
- 1.27
- GRM
- 8.2
CMA / ARV
- ARV (on-the-fly)
- $147,232
- Comps found
- 1
Show comp detail 1 sale within ~0.75 mi
| Address | Dist | Beds/Ba | Sqft | Sold | Price | $/sf | Match |
|---|---|---|---|---|---|---|---|
| 6546 Haley Dr | 0.48mi | 3/2.0 | 1,424 (+4%) | 3mo | $153,000 | $107 | 65 |
Match score weights: distance 35% · size 25% · config 20% · recency 20%. Top-matched comps best support the ARV.
Projected returns pro-forma
3.0% appreciation · 3.0% rent growth · sell at horizon
- IRR
- 13.1%
- Equity multiple
- 1.75×
- Total profit
- $30,376
- Equity at exit
- $65,198
- IRR
- 15.0%
- Equity multiple
- 3.22×
- Total profit
- $90,071
- Equity at exit
- $100,478
Cash invested: $40,600 (down + closing). Projections, not guarantees.
Landlord ↔ Tenant lean methodology
- Overall (STATE)
- 90 Strongly Landlord-Friendly
- State South Carolina
- 90 Strongly Landlord-Friendly · R+6
- County
- — inherits STATE
- City
- — inherits STATE
ZIP-level market 29204-3206
- Active inventory
- 1
- Price-to-rent
- 8.2×
Monthly cashflow live
- Estimated rent
- $1,482 high interval (Pro) →
- Mortgage (P&I)
- −$760
- Tax from tax record
- −$148 /mo · $1,771/yr
- Insurance
- −$60
- HOA
- −$0
- Vacancy / Maint / Mgmt
- −$311
- Net cashflow
- $203
Break-even live
UW: 25.0% down · 7.5% · 30yr · 1.5% tax · 5.0% vac · 8.0% maint · 8.0% mgmt
Financing live
Cash to close
- Down payment
- $36,250
- Closing costs
- $4,350
- Reserves months
- —
- Total cash needed
- —
Loan-product check · same deal, 3 products live
Conventional
25% down · 7.5% · 30yr
- Down + closing
- —
- Monthly P&I
- —
- Monthly cashflow
- —
- DSCR
- —
- Eligible?
- —
Personal DTI + credit; lowest rate.
DSCR
20% down · 8.5% · 30yr
- Down + closing
- —
- Monthly P&I
- —
- Monthly cashflow
- —
- DSCR
- —
- Eligible?
- —
No personal income docs; deal must DSCR.
Hard money
10% down · 12.0% · 12mo
- Down + closing
- —
- Monthly P&I
- —
- Monthly cashflow
- —
- DSCR
- —
- Eligible?
- —
Short-term bridge; refi at stabilization.
Rent comps 18 comps
| Address | Beds | Baths | Sqft | Rent | $/sqft | DOM | Units | Dist |
|---|---|---|---|---|---|---|---|---|
| 5437 Ransom Dr Columbia, SC | 3.0 | 1.0 | 1056 | $1,531 | $1.45 | 23d | 1 | 0.37mi |
| 1931 Chaney St Columbia, SC | 2.0 | 1.0 | 1034 | $1,600 | $1.55 | 23d | 1 | 0.61mi |
| 1115 Carter St Columbia, SC | 1.0–2.0 | 1.0 | 854 | $1,405 | $1.65 | 23d | 1 | 0.80mi |
| 4443 Bethel Church Rd #27 Columbia, SC | 3.0 | 2.5 | 1660 | $1,645 | $0.99 | 23d | 1 | 0.81mi |
| 320 Charwood Dr Columbia, SC | 3.0 | 2.0 | 1325 | $1,750 | $1.32 | 23d | 1 | 0.87mi |
| 3117 Quitman St Columbia, SC | 3.0 | 2.0 | 1500 | $1,750 | $1.17 | 23d | 1 | 0.94mi |
| 3431 Covenant Rd Columbia, SC | 1.0–3.0 | 1.0–1.5 | 950 | $1,100 | $1.16 | 23d | 1 | 0.98mi |
| 4215 Bethel Church Rd Columbia, SC | 1.0–3.0 | 1.0–2.0 | 962 | $1,395 | $1.45 | 23d | 1 | 1.06mi |
| 4214 Bethel Church Rd Columbia, SC | 2.0–3.0 | 1.0–2.0 | 1068 | $1,429 | $1.34 | 11d | 9 | 1.07mi |
| 3145 Bronx Rd Columbia, SC | 3.0 | 1.5 | 1207 | $1,511 | $1.25 | 23d | 1 | 1.11mi |
| 6604 Cartwright Dr Columbia, SC | 3.0 | 2.0 | 1648 | $1,650 | $1.00 | 3d | 1 | 1.12mi |
| 151 Renaissance Way Columbia, SC | 3.0 | 2.0 | 1200 | $1,400 | $1.17 | 23d | 1 | 1.15mi |
| 201 Redwood Ct Columbia, SC | 3.0 | 1.5 | 1050 | $1,300 | $1.24 | 14d | 1 | 1.18mi |
| 209 Christian St Columbia, SC | 3.0 | 3.0 | 1585 | $800 | $0.50 | 23d | 1 | 1.24mi |
| 5779 Ames Rd Unit 13B Columbia, SC | 2.0 | 1.0 | 895 | $1,000 | $1.12 | 11d | 1 | 1.36mi |
| 5779 Ames Rd Columbia, SC | 2.0 | 1.0 | 895 | $1,000 | $1.12 | 14d | 1 | 1.36mi |
| 3015 English Ave Columbia, SC | 2.0 | 1.0 | 981 | $1,250 | $1.27 | 11d | 1 | 1.37mi |
| 2928 English Ave Unit NA Columbia, SC | 3.0 | 1.0 | 1320 | $1,590 | $1.20 | 11d | 1 | 1.43mi |
Listing history 20 events
-
2026-06-18days on market $145,000 Active 225 DOM
-
2026-06-17days on market $145,000 Active 224 DOM
-
2026-06-16days on market $145,000 Active 223 DOM
-
2026-06-15days on market $145,000 Active 222 DOM
-
2026-06-14days on market $145,000 Active 220 DOM
-
2026-06-10days on market $145,000 Active 217 DOM
-
2026-06-09days on market $145,000 Active 216 DOM
-
2026-06-08days on market $145,000 Active 215 DOM
-
2026-06-07days on market $145,000 Active 214 DOM
-
2026-06-03days on market $145,000 Active 210 DOM
-
2026-06-03days on market $145,000 Active 209 DOM
-
2026-06-01days on market $145,000 Active 208 DOM
-
2026-05-31days on market $145,000 Active 207 DOM
-
2026-02-25price $145,000
-
2025-11-20price $155,000
-
2025-11-19status Active
-
2025-11-04status Pending
-
2025-10-20historical Active - Contingent
-
2025-10-20$135,000 Active
-
1989-08-04soldstatus $49,500
ⓘ Source: listings_history table (triggers on properties + properties_extension) + one-shot
backfill from property_details.listing_events for pre-trigger history.
Tax reassessment forecast SC · Resets to sale price
- Current annual tax
- $1,771 · $148/mo
- Projected year-2 tax
- $1,771 · $148/mo
- Expected delta
- $0/yr ($0/mo · 0.0%)
ⓘ Screening estimate from a state-policy table — verify with the county assessor before closing.
Climate risk First Street
- Flood 1/10 Low FEMA zone X (unshaded) · 0% chance over 30 yrs
- Wildfire 1/10 Low
- Heat 6/10 Major 7 d/yr ≥108°F today · 16 d/yr by 30 yrs out
- Wind 6/10 Major 68% chance of damaging wind over 30 yrs
- Air quality 3/10 Moderate 2 unhealthy d/yr today · 2 by 30 yrs out
Nearby sold comps map
Loading sold comps map…
Walkable amenities ~0.75 mi
Loading nearby amenities…
Taxation est. · year 1
- Rental income
- $17,788
- − Mortgage interest
- −$8,122
- − Property taxes
- −$1,771
- − Insurance
- −$725
- − Repairs & maintenance
- −$1,423
- − Management
- −$1,423
- − Depreciation
- −$4,218
- Taxable income
- $105
- Est. tax owed @ 24.0%
- −$25
- After-tax cash flow
- $2,406/yr
For passive investors: Depreciation is non-cash, so a rental often shows a tax loss while cash-flowing — sheltering income. Rental losses are passive: they offset passive income freely, and up to $25,000/yr can offset ordinary (W-2) income if you actively participate and your MAGI is under $100k (phasing out to $0 by $150k); unused losses carry forward. On sale, claimed depreciation is recaptured at up to 25%, and gains may owe capital-gains tax (a 1031 exchange can defer both). Figures are a year-1 estimate at your 24.0% rate — not tax advice; consult a CPA.
Schools (NCES district)
- District
- Richland 01
- NCES district ID
- 4503360
- Math proficiency
- 26% ▼ -7.00%
- Reading proficiency
- 36% ▼ -5.00%
- Median HH income
- $38,931
- Composite
- 25.94/100
- National rank
- #7335
- State rank
- #54 of 80 in SC
Livability — Forest Acres
- Score
- 73/100
- State rank
- #39
- US rank
- #5064
Category grades
Schools grade is shown separately in the Schools card above.
Census & demographics
- Census place
- Forest Acres, SC
Population outlook (Richland County) Hauer SSP2
- Today (2025)
- 459,667 people
- By 2030
- 487,524 · +6.1%
- By 2040
- 542,035 · +17.9%
- By 2050
- 595,371 · +29.5%
- By 2075
- 732,998 · +59.5%
- By 2100
- 820,415 · +78.5%
Not yet ingested
- Political lean
- —
- Race & ethnicity
- —
- Common origin
- —
- Civics
- —
Market trends
- HPI YoY
- —
- Current HPI
- —
- Rent YoY
- —
- Metro
- —
- State GDP YoY
- ▲ 4.51%
- F500 in state
- 2
Industry mix (Fortune 500 HQ in SC)
| Industry | F500 HQs | Revenue |
|---|---|---|
| Packaging | 1 | $7B |
|
||
Price history
+192.9% since first listed7 events — show timeline
- 2026-02-25 Price Changed $145,000 Consolidated MLS
- 2025-11-20 Price Changed $155,000 Consolidated MLS
- 2025-11-19 Relisted — Consolidated MLS
- 2025-11-04 Pending — Consolidated MLS
- 2025-10-20 Contingent — Consolidated MLS
- 2025-10-20 Listed $135,000 Consolidated MLS
- 1989-08-04 Sold (Public Records) $49,500 Public Records
Property tax history
+9.7%/yrLatest (2025): $1,771 · +2.2% YoY. Source: county tax records.
Cash-flow waterfall
monthlySold comps — $/sqft
last 12 mo · ≤1 miLoading sold comps…