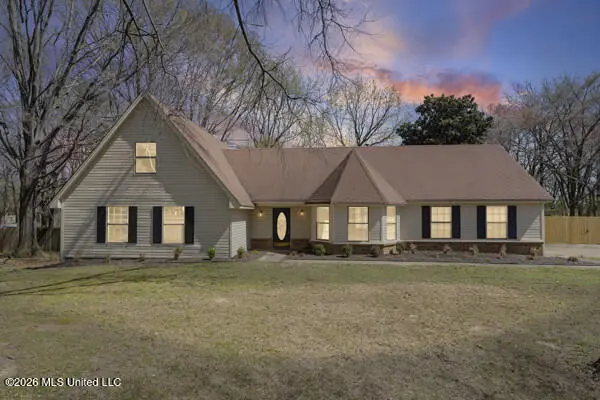
7060 Timber Trl · Southaven, MS
Flood risk 1/10 · Minimal
- FEMA flood zone
- X (unshaded)
- Chance of flooding over 30 yrs
- 0.0%
- Est. flood insurance / yr
- $507 – $1,088
Fire risk 3/10 · Minor
- Est. fire insurance / yr
- $1,241 – $2,305
Heat risk 6/10 · Moderate
- Hot days now (above 109°F)
- 7 days/yr
- Hot days in 30 yrs
- 20 days/yr
Wind risk 4/10 · Minor
- Chance of severe wind over 30 yrs
- 21.0%
Air-quality risk 2/10 · Minimal
- Unhealthy air days now
- 2 days/yr
- Unhealthy air days in 30 yrs
- 2 days/yr
Risk factors via First Street. Map © Google.
Why this score? — see what drove the D- grade
The composite is a weighted blend of 9 inputs, each scored 0–100. Each bar is that input's sub-score; the figure is the points it added to the 100-point composite (weight × sub-score).
- ARV discount +12.8/15.0
- Cash flow +8.6/30.0
- Schools +4.0/10.0
- Livability +3.2/5.0
- Rent growth +2.5/5.0
- Condition / age +2.5/5.0
- DSCR +2.4/10.0
- 1% rule +2.0/10.0
- Appreciation +0.0/10.0
$349,900
🖨 Deal sheet (PDF) 📄 Offer letter ✓ Due diligence
Listing remarks MLS
Located on a 1.5-acre lot surrounded by trees, with pond in the back. Conveniently located with easy access to shopping and restaurants. The home has just gone under some extensive repairs, new landscaping, new fencing, some new flooring, new deck, and all new vinyl siding. The home is clean, and ready for move in today. Schedule your showing.
Key facts
- New fencing
- New landscaping
- New flooring
Tags
Neighborhood map
What this means for you Summary
Snapshot
- This is a 3-bed/3.5-bath single-family listed at $350k.
Deal economics
- At list price, monthly cash flow is $-301 ($-4k/yr) — negative.
- To cash-flow at today's rent, offer at most $297k (15.2% below list).
- To meet the 1% rule (rent ≥ 1% of price), the offer needs to be $244k (30.2% below list).
- Recommended offer: $244k (30.2% below list) — sets the bar for 1% rule.
Location & tenants
- Location reads 65/100 on livability (#107 in MS) — a middle-class / working-renter tenant base. Strengths: cost of living A+, housing A+; Watch: amenities F, commute F, health & safety F.
- Desoto County School District (suburban): math 48% / reading 42% proficiency, ranked #20 of 130 in MS (top 15%) — families likely to look elsewhere, expect single-tenant / working-renter base with shorter leases.
- Zoned schools: Southaven Intermediate School (math 24% / reading 30%, grade F, #203 of 375 statewide, top 56%, 990 students, 100% FRL); Southaven Middle School (math 33% / reading 25%, grade F, #90 of 179 statewide, top 52%, 1,456 students, 100% FRL); Southaven High School (math 26% / reading 35%, grade F, #88 of 197 statewide, top 45%, 1,850 students, 100% FRL) — zoned schools average 100% FRL vs 43% district-wide (56 pts higher); higher-poverty schools than district average — tighter screening recommended.
- Zoned-school proficiency averages 29% at this address vs 45% district-wide (-16 pts) — the specific schools serving this property underperform the Desoto County School District average; the district grade overstates school quality for this exact location.
- Market conditions: 158 active listings in the ZIP; 25 comparable units currently listed for rent nearby; rentals at typical pace (median 19d on market — plan ~3-4 weeks tenant-placement turnaround); high-income renter base; 1,155 units permitted in DeSoto County in 2024 (0 in 5+ unit buildings).
Forward outlook
- Local home prices are declining (-3.0%/yr); year-one equity from $2k of loan paydown is wiped out by about $10k of value loss. Plan a longer hold.
- DeSoto County population projected at +33% by 2050 — long-run rental-demand tailwind backs the buy-and-hold thesis.
Negotiation context
- It's been on market 61 days — a 6% lower offer ($329k) is reasonable based on typical stale-listing flexibility.
Risks & watch-outs
- Climate carrying-cost: extreme-heat days projected 7→20/yr by 2055 (HVAC capex compounding) — expect insurance premiums to compound above CPI over the hold.
Questions for the listing agent
- What do current leases actually rent for vs. the listed asking? Can we see a recent rent roll and the last 12 months of T-12 income?
- It's been on market 61 days. Have you received any prior offers? Is the seller open to a 30% concession, seller financing, or rate buy-down credit?
- Why hasn't it sold? Are there any deal-killer items the seller is aware of (foundation, flood, title, zoning, code violations)?
- Is there a deadline driving the sale (1031 exchange, divorce, estate, relocation)? That informs how much negotiation room exists.
- Schools are D-rated, which usually means shorter tenancies and higher turnover. Who's the typical renter profile here, and what's been the actual vacancy rate?
- The area grade is low — what's the realistic commute time and amenity access for the typical tenant pool here? Any planned neighborhood developments (good or bad) we should know about?
- What's the average days-on-market for RENTAL listings here right now (not sales)? A rising rental-DOM trend means longer vacancies and softer asking-rent achievability than the comps imply.
- What's the recent tenant-quality profile in this submarket — average credit score on applications, eviction rate, late-payment / NSF rate, and stable-employment percentage? A property-management company in the area should have these aggregated.
- How much new for-sale + rental construction is in the pipeline within 1–3 miles? Heavy new supply typically softens prices + rents 12–24 months out; constrained supply supports both.
Investment metrics
- 1% rule
- 0.70% ✗
- Cap rate
- 5.26%
- Cash-on-cash
- -3.68%
- DSCR
- 0.84
- GRM
- 11.9
CMA / ARV
- ARV (median comp)
- $396,666
- List price
- $349,900
- Delta
- -11.79%
- Verdict
- UNDERPRICED
- Comps
- 20 within 1.0 mi
Show comp detail 12 sales within ~0.75 mi
| Address | Dist | Beds/Ba | Sqft | Sold | Price | $/sf | Match |
|---|---|---|---|---|---|---|---|
| 2539 Greencliff Dr | 0.34mi | 3/2.0 | 2,116 (+6%) | 9mo | $309,000 | $146 | 61 |
| 2543 Saint Charles Cv | 0.63mi | 3/2.0 | 2,000 (+0%) | 5mo | $389,900 | $195 | 60 |
| 2323 Kindlewood Dr | 0.51mi | 3/2.0 | 2,054 (+3%) | 7mo | $280,000 | $136 | 60 |
| 7160 E Pecan Rdg | 0.68mi | 3/2.5 | 2,076 (+4%) | 1mo | $309,000 | $149 | 57 |
| 2520 Saint Charles Cv | 0.63mi | 3/2.0 | 2,098 (+5%) | 2mo | $406,900 | $194 | 55 |
| 2892 Market Square Ave | 0.52mi | 3/3.0 | 2,153 (+8%) | 7mo | $402,900 | $187 | 54 |
| 2531 Saint Charles Cv | 0.65mi | 3/2.0 | 2,079 (+4%) | 7mo | $402,900 | $194 | 51 |
| 2557 Saint Charles Cv | 0.63mi | 3/2.0 | 2,121 (+6%) | 5mo | $410,900 | $194 | 50 |
| 2334 Heather Rdg | 0.58mi | 3/2.0 | 1,800 (-10%) | 2mo | $295,000 | $164 | 49 |
| 6643 Belltower Pl | 0.46mi | 4/3.0 (+1) | 2,196 (+10%) | 8mo | $410,000 | $187 | 48 |
| 2035 Greencliff Dr | 0.68mi | 3/2.5 | 1,824 (-8%) | 2mo | $281,000 | $154 | 48 |
| 2163 Woodridge Dr | 0.72mi | 4/2.0 (+1) | 1,930 (-3%) | 4mo | $330,000 | $171 | 47 |
Match score weights: distance 35% · size 25% · config 20% · recency 20%. Top-matched comps best support the ARV.
Projected returns pro-forma
-3.0% appreciation · 3.0% rent growth · sell at horizon
- IRR
- -22.5%
- Equity multiple
- 0.23×
- Total profit
- $-75,928
- Equity at exit
- $52,171
- IRR
- -16.8%
- Equity multiple
- 0.07×
- Total profit
- $-91,096
- Equity at exit
- $30,253
Cash invested: $97,972 (down + closing). Projections, not guarantees.
Landlord ↔ Tenant lean methodology
- Overall (STATE)
- 90 Strongly Landlord-Friendly
- State Mississippi
- 90 Strongly Landlord-Friendly · R+11
- County
- — inherits STATE
- City
- — inherits STATE
ZIP-level market 38672
- Home prices YoY
- -13.1%
- Active inventory
- 158
- Price-to-rent
- 11.9×
Monthly cashflow live
- Estimated rent
- $2,442 high interval (Pro) →
- Mortgage (P&I)
- −$1,835
- Tax from tax record
- −$249 /mo · $2,989/yr
- Insurance
- −$146
- HOA
- −$0
- Vacancy / Maint / Mgmt
- −$513
- Net cashflow
- $-301
Break-even live
Sensitivity live
| Price | -10% $-103 | -5% $-202 | +0% $-301 | +5% $-400 | +10% $-499 |
|---|---|---|---|---|---|
| Rent | -10% $-494 | -5% $-397 | +0% $-301 | +5% $-204 | +10% $-108 |
| Rate | -1.0pp $-124 | -0.5pp $-212 | base $-301 | +0.5pp $-391 | +1.0pp $-484 |
UW: 25.0% down · 7.5% · 30yr · 1.5% tax · 5.0% vac · 8.0% maint · 8.0% mgmt
Financing live
Cash to close
- Down payment
- $87,475
- Closing costs
- $10,497
- Reserves months
- —
- Total cash needed
- —
Loan-product check · same deal, 3 products live
Conventional
25% down · 7.5% · 30yr
- Down + closing
- —
- Monthly P&I
- —
- Monthly cashflow
- —
- DSCR
- —
- Eligible?
- —
Personal DTI + credit; lowest rate.
DSCR
20% down · 8.5% · 30yr
- Down + closing
- —
- Monthly P&I
- —
- Monthly cashflow
- —
- DSCR
- —
- Eligible?
- —
No personal income docs; deal must DSCR.
Hard money
10% down · 12.0% · 12mo
- Down + closing
- —
- Monthly P&I
- —
- Monthly cashflow
- —
- DSCR
- —
- Eligible?
- —
Short-term bridge; refi at stabilization.
Rent comps 25 comps
| Address | Beds | Baths | Sqft | Rent | $/sqft | DOM | Units | Dist |
|---|---|---|---|---|---|---|---|---|
| 2704 Greencliff Dr Southaven, MS | 4.0 | 2.0 | 2150 | $2,345 | $1.09 | 23d | 1 | 0.38mi |
| 6656 Belltower Pl Southaven, MS | 3.0 | 3.0 | 2126 | $4,400 | $2.07 | 45d | 1 | 0.44mi |
| 2687 Sapper Ln Southaven, MS | 4.0 | 2.0 | 1622 | $2,065 | $1.27 | 25d | 1 | 0.48mi |
| 2346 Kindlewood Dr Southaven, MS | 4.0 | 2.0 | 2000 | $2,260 | $1.13 | 3d | 1 | 0.53mi |
| 2334 Heather Rdg Southaven, MS | 3.0 | 2.0 | 1900 | $2,250 | $1.18 | 45d | 1 | 0.60mi |
| 1937 Pecan Meadows Dr Southaven, MS | 3.0 | 2.0 | 2072 | $2,040 | $0.98 | 45d | 1 | 0.78mi |
| 1859 Winners Circle Cv Southaven, MS | 3.0 | 2.0 | 1773 | $2,145 | $1.21 | 5d | 1 | 0.97mi |
| 1865 Winners Cir N Southaven, MS | 3.0 | 2.0 | 1600 | $1,890 | $1.18 | 45d | 1 | 0.99mi |
| 1820 Mary Payton Cv Southaven, MS | 3.0 | 2.0 | 1699 | $1,835 | $1.08 | 45d | 1 | 1.09mi |
| 7875 Sarah Ann Dr S Southaven, MS | 3.0 | 2.0 | 1572 | $1,800 | $1.15 | 45d | 1 | 1.11mi |
| 2855 Nail Rd E Southaven, MS | 2.0 | 2.0 | 1740 | $3,345 | $1.92 | 45d | 1 | 1.14mi |
| 2777 Rutherford Dr Southaven, MS | 4.0 | 2.0 | 2320 | $2,200 | $0.95 | 6d | 1 | 1.20mi |
| 7896 Nature Walk Dr Southaven, MS | 3.0 | 2.0 | 1428 | $1,705 | $1.19 | 16d | 1 | 1.24mi |
| 5764 Deer Ridge Dr Southaven, MS | 4.0 | 2.0 | 1665 | $2,060 | $1.24 | 3d | 1 | 1.25mi |
| 1688 Sarah Ann Dr W Southaven, MS | 3.0 | 2.0 | 1430 | $1,695 | $1.19 | 21d | 1 | 1.31mi |
| 1521 Miskelly Dr Unit 1 Southaven, MS | 3.0 | 2.0 | 1695 | $2,065 | $1.22 | 45d | 1 | 1.32mi |
| 5683 Antler Trl Southaven, MS | 3.0 | 2.0 | 1794 | $2,015 | $1.12 | 6d | 1 | 1.33mi |
| 5678 Kuykendall Dr Southaven, MS | 4.0 | 2.0 | 2244 | $2,285 | $1.02 | 6d | 1 | 1.34mi |
| 1708 Cherry Rd Southaven, MS | 3.0 | 2.0 | 1606 | $1,780 | $1.11 | 13d | 1 | 1.39mi |
| 8426 Linda Shore Cv Southaven, MS | 3.0 | 2.0 | 1780 | $1,910 | $1.07 | 6d | 1 | 1.40mi |
| 2221 Linda Shore Dr Southaven, MS | 3.0 | 2.5 | 2226 | $2,370 | $1.06 | 3d | 1 | 1.40mi |
| 8181 Martin Dr Southaven, MS | 4.0 | 2.0 | 1750 | $1,970 | $1.13 | 18d | 1 | 1.44mi |
| 8035 Park Pike Dr Southaven, MS | 3.0 | 2.0 | 1340 | $1,695 | $1.26 | 5d | 1 | 1.46mi |
| 7902 Hemlock Dr Southaven, MS | 3.0 | 2.0 | 1609 | $1,999 | $1.24 | 6d | 1 | 1.46mi |
| 8161 Loden Cv Southaven, MS | 4.0 | 2.0 | 1840 | $2,040 | $1.11 | 45d | 1 | 1.49mi |
Listing history 2 events
-
2026-04-23price $349,900 349-char remark
Show marketing remark (349 chars)
Located on a 1.5-acre lot surrounded by trees, with pond in the back. Conveniently located with easy access to shopping and restaurants. The home has just gone under some extensive repairs, new landscaping, new fencing, some new flooring, new deck, and all new vinyl siding. The home is clean, and ready for move in today. Schedule your showing.
-
2026-03-19$359,900 Active 349-char remark
Show marketing remark (349 chars)
Located on a 1.5-acre lot surrounded by trees, with pond in the back. Conveniently located with easy access to shopping and restaurants. The home has just gone under some extensive repairs, new landscaping, new fencing, some new flooring, new deck, and all new vinyl siding. The home is clean, and ready for move in today. Schedule your showing.
ⓘ Source: listings_history table (triggers on properties + properties_extension) + one-shot
backfill from property_details.listing_events for pre-trigger history.
Tax reassessment forecast MS · Resets to sale price
- Current annual tax
- $2,989 · $249/mo
- Projected year-2 tax
- $2,989 · $249/mo
- Expected delta
- $0/yr ($0/mo · 0.0%)
ⓘ Screening estimate from a state-policy table — verify with the county assessor before closing.
Climate risk First Street
- Flood 1/10 Low FEMA zone X (unshaded) · 0% chance over 30 yrs
- Wildfire 3/10 Moderate
- Heat 6/10 Major 7 d/yr ≥109°F today · 20 d/yr by 30 yrs out
- Wind 4/10 Moderate 21% chance of damaging wind over 30 yrs
- Air quality 2/10 Low 2 unhealthy d/yr today · 2 by 30 yrs out
Nearby sold comps map
Loading sold comps map…
Walkable amenities ~0.75 mi
Loading nearby amenities…
Taxation est. · year 1
- Rental income
- $29,303
- − Mortgage interest
- −$19,600
- − Property taxes
- −$2,989
- − Insurance
- −$1,750
- − Repairs & maintenance
- −$2,344
- − Management
- −$2,344
- − Depreciation
- −$10,179
- Taxable loss
- −$9,903
- Est. tax savings @ 24.0%
- +$2,377
- After-tax cash flow
- $-1,231/yr
For passive investors: Depreciation is non-cash, so a rental often shows a tax loss while cash-flowing — sheltering income. Rental losses are passive: they offset passive income freely, and up to $25,000/yr can offset ordinary (W-2) income if you actively participate and your MAGI is under $100k (phasing out to $0 by $150k); unused losses carry forward. On sale, claimed depreciation is recaptured at up to 25%, and gains may owe capital-gains tax (a 1031 exchange can defer both). Figures are a year-1 estimate at your 24.0% rate — not tax advice; consult a CPA.
Schools (NCES district)
- District
- Desoto County School District
- NCES district ID
- 2801320
- Math proficiency
- 48% ▼ -13.00%
- Reading proficiency
- 42% ▼ -6.00%
- Median HH income
- $59,272
- Composite
- 39.56/100
- National rank
- #3933
- State rank
- #20 of 130 in MS
Livability — Southaven
- Score
- 65/100
- State rank
- #107
- US rank
- #12584
Category grades
Schools grade is shown separately in the Schools card above.
Census & demographics
- Census place
- Southaven, MS
- County
- DeSoto County · 176,513 people
- City population
- 53,755
- Metro
- Memphis, TN-MS-AR
- Population (ZIP)
- 16,436
- Household income
- $116,184
- Rent vs Own
- Severe rent burden
- 44.0
Population outlook (DeSoto County) Hauer SSP2
- Today (2025)
- 203,338 people
- By 2030
- 217,692 · +7.1%
- By 2040
- 245,320 · +20.6%
- By 2050
- 270,133 · +32.8%
- By 2075
- 323,341 · +59.0%
- By 2100
- 348,742 · +71.5%
Race, ethnicity, and origin ACS 2023
- Neighborhood character
- Majority White (60%)
- Race & ethnicity
- White 60% Black 31% Hispanic / Latino 5% Two or more races 4% Asian 3%
- Hispanic origin (detail)
- Mexican 3%
- Common ancestry
- Subsaharan African 2% Italian 2% Serbian 1%
- Foreign-born
- 5% · Canada, China
- Languages at home
- 96% English-only · Spanish 2% Chinese 1% Other Asian/Pacific 1%
Political lean MEDSL · DeSoto
- 2024 margin
- Strong R (+24.1) · D 36.7% · R 60.8% · Other 2.5%
- 2008→2024 swing
- +14.2pp toward D · 2008: -38.2pp · 2024: -24.1pp
- All cycles
- 2024: R+24.1 2020: R+23.9 2016: R+34.8 2012: R+33.5 2008: R+38.2
Not yet ingested
- Civics
- —
Market trends
- HPI YoY
- ▼ -25.90%
- Current HPI
- 172.4771
- Rent YoY
- —
- Metro
- Memphis, TN-MS-AR
- State GDP YoY
- —
- F500 in state
- 0
Price history
-2.8% since first listed2 events — show timeline
- 2026-04-23 Price Changed $349,900 MLSU
- 2026-03-19 Listed $359,900 MLSU
Property tax history
+3.7%/yrLatest (2025): $2,989 · +134.8% YoY. Source: county tax records.
Cash-flow waterfall
monthlySold comps — $/sqft
last 12 mo · ≤1 miLoading sold comps…