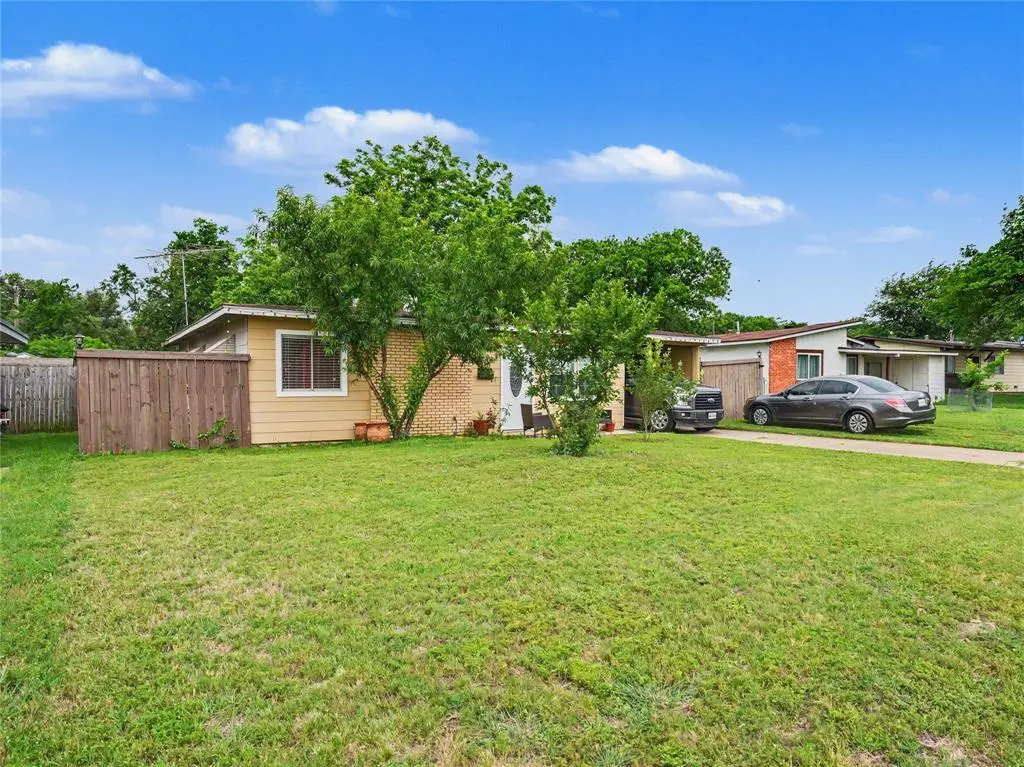
1217 California Pkwy S · Fort Worth, TX
Flood risk 1/10 · Minimal
- FEMA flood zone
- X (unshaded)
- Chance of flooding over 30 yrs
- 0.0%
- Est. flood insurance / yr
- $507 – $1,088
Fire risk 1/10 · Minimal
- Est. fire insurance / yr
- $1,222 – $2,270
Heat risk 7/10 · Major
- Hot days now (above 109°F)
- 7 days/yr
- Hot days in 30 yrs
- 23 days/yr
Wind risk 4/10 · Minor
- Chance of severe wind over 30 yrs
- 24.0%
Air-quality risk 3/10 · Minor
- Unhealthy air days now
- 3 days/yr
- Unhealthy air days in 30 yrs
- 4 days/yr
Risk factors via First Street. Map © Google.
Why this score? — see what drove the D grade
The composite is a weighted blend of 9 inputs, each scored 0–100. Each bar is that input's sub-score; the figure is the points it added to the 100-point composite (weight × sub-score).
- Cash flow +14.3/30.0
- ARV discount +6.6/15.0
- 1% rule +4.3/10.0
- DSCR +4.3/10.0
- Livability +4.0/5.0
- Rent growth +3.1/5.0
- Condition / age +2.5/5.0
- Schools +2.0/10.0
- Appreciation +0.0/10.0
$195,000
🖨 Deal sheet 📄 Offer letter ✓ Due diligence
Listing remarks MLS
This cute 3 bedroom, 1 bath house features: Open living room area! Spacious front yard! Centrally located close to popular shopping center and schools. Priced to sell quickly.
Key facts
- Alley access
- Oversized lot
- Nearby dining
Tags
Property features AI
Finance
- Financial info: Treat as clear loan type; No second mortgage
- HOA & community: No homeowners association
Exterior
- Parking: Covered parking space; Carport with space for 4 vehicles; Driveway
- Utilities: City water; City sewer; Not in a municipal utility district
- Home design: Single-family residence; One story; Attached property; Accessible approach with ramp and accessible doors
- Construction: Siding exterior; Built in 1957
- Exterior features: Less than 0.5 acre lot (approximately 0.20 acre); Alley access
Interior
- Kitchen: Electric range; Garbage disposal; Refrigerator
- Bedrooms: Primary bedroom (14 x 12)
- Bathrooms: 1 full bathroom
- Interior features: Open floorplan; Three living/dining areas (living room and dining room included)
Neighborhood map
What this means for you Summary
Snapshot
- This is a 3-bed/1.0-bath single-family listed at $195k.
Deal economics
- At list price, monthly cash flow is $34 ($407/yr) — positive.
- The deal already cash-flows at list — no discount required.
- To meet the 1% rule (rent ≥ 1% of price), the offer needs to be $181k (7.0% below list).
- Recommended offer: $181k (7.0% below list) — sets the bar for 1% rule.
- Cap rate 6.5% vs local median 3.9% in Fort Worth — top-decile yield for the area; either an underpriced asset or a hidden risk that comps aren't pricing in. Stress-test before assuming the spread holds.
Location & tenants
- Location reads 80/100 on livability (#49 in TX, #1,954 nationally) — a professional / high-income tenant draw. Strengths: amenities A+, cost of living A+, housing A+; Watch: crime F.
- Fort Worth ISD (urban): math 18% / reading 28% proficiency, ranked #742 of 826 in TX (top 90%) — low school quality limits family demand, transient renter base, plan for 1-2y turnover; 73% free/reduced lunch — lower-income household profile, screen leases tightly.
- Zoned schools: Greenbriar El (math 20% / reading 23%, grade F, #3,470 of 4,322 statewide, top 81%, 426 students, 90% FRL) — zoned schools average 90% FRL vs 73% district-wide (17 pts higher); higher-poverty schools than district average — tighter screening recommended.
- Market conditions: Rents rising (+2.3%/yr); 120 active listings in the ZIP; 9 comparable units currently listed for rent nearby; rentals at typical pace (median 24d on market — plan ~3-4 weeks tenant-placement turnaround); 44% of comp listings sitting > 30 days — soft ceiling on asking rent; 18,938 units permitted in Tarrant County in 2024 (8,336 in 5+ unit buildings).
- This rent runs 31% of the median local income ($71k/yr) — at the standard rent-burdened threshold; future hikes will face affordability resistance.
Forward outlook
- Local home prices are declining (-3.0%/yr); year-one equity from $1k of loan paydown is wiped out by about $6k of value loss. Plan a longer hold.
- Tarrant County population projected at +41% by 2050 — long-run rental-demand tailwind backs the buy-and-hold thesis.
Negotiation context
- It's been on market 48 days — a 3% lower offer ($189k) is reasonable based on typical stale-listing flexibility.
- 5 sale attempts since 23y ago with the ask held roughly flat each time — persistent listings suggest the price (not the market) is what's stuck; bring a comps-based counter.
Risks & watch-outs
- Watch-outs: built in 1957 — expect roof / HVAC / electrical / plumbing capex.
- Climate carrying-cost: extreme-heat days projected 7→23/yr by 2055 (HVAC capex compounding) — expect insurance premiums to compound above CPI over the hold.
Questions for the listing agent
- It's been on market 48 days. Have you received any prior offers? Is the seller open to a 7% concession, seller financing, or rate buy-down credit?
- Built in 1957 — when were the roof, HVAC, electrical panel, plumbing, and water heater last replaced?
- Is there a deadline driving the sale (1031 exchange, divorce, estate, relocation)? That informs how much negotiation room exists.
- Schools are D-rated, which usually means shorter tenancies and higher turnover. Who's the typical renter profile here, and what's been the actual vacancy rate?
- Crime grade is F in this area — have there been break-ins, vandalism, or insurance claims at this property in the last 3 years? What carrier currently insures it and at what premium?
- The area grade is low — what's the realistic commute time and amenity access for the typical tenant pool here? Any planned neighborhood developments (good or bad) we should know about?
- What's the average days-on-market for RENTAL listings here right now (not sales)? A rising rental-DOM trend means longer vacancies and softer asking-rent achievability than the comps imply.
- What's the recent tenant-quality profile in this submarket — average credit score on applications, eviction rate, late-payment / NSF rate, and stable-employment percentage? A property-management company in the area should have these aggregated.
- How much new for-sale + rental construction is in the pipeline within 1–3 miles? Heavy new supply typically softens prices + rents 12–24 months out; constrained supply supports both.
Investment metrics
- 1% rule
- 0.93% ✗
- Cap rate
- 6.50%
- Cash-on-cash
- 0.75%
- DSCR
- 1.03
- GRM
- 9.0
CMA / ARV
- ARV (median comp)
- $191,303
- List price
- $195,000
- Delta
- 1.93%
- Verdict
- FAIR
- Comps
- 20 within 1.0 mi
Show comp detail 10 sales within ~0.75 mi
| Address | Dist | Beds/Ba | Sqft | Sold | Price | $/sf | Match |
|---|---|---|---|---|---|---|---|
| 5713 6th Ave | 0.19mi | 2/1.0 (-1) | 900 (+0%) | 14mo | $162,000 | $180 | 74 |
| 1224 Hamsted St | 0.15mi | 3/1.0 | 956 (+7%) | 21mo | $180,000 | $188 | 65 |
| 5225 Gordon Ave | 0.67mi | 3/1.0 | 902 (+1%) | 9mo | $135,000 | $150 | 60 |
| 1200 Edney St | 0.25mi | 3/1.0 | 1,008 (+12%) | 9mo | $189,000 | $188 | 60 |
| 1441 Edney St | 0.40mi | 3/1.0 | 804 (-10%) | 7mo | $125,000 | $155 | 58 |
| 1436 Sharondale St | 0.45mi | 3/1.0 | 978 (+9%) | 15mo | $208,000 | $213 | 52 |
| 916 Hodgson St | 0.36mi | 3/1.0 | 1,001 (+12%) | 17mo | $157,999 | $158 | 49 |
| 5316 Gordon Ave | 0.68mi | 3/1.0 | 973 (+9%) | 9mo | $179,900 | $185 | 47 |
| 5441 Mcconnell Dr | 0.64mi | 3/1.0 | 1,029 (+15%) | 12mo | $241,500 | $235 | 36 |
| 5205 Mcconnell Dr | 0.72mi | 3/1.5 | 962 (+7%) | 23mo | $182,000 | $189 | 33 |
Match score weights: distance 35% · size 25% · config 20% · recency 20%. Top-matched comps best support the ARV.
Projected returns pro-forma
-3.0% appreciation · 2.3% rent growth · sell at horizon
- IRR
- -15.9%
- Equity multiple
- 0.44×
- Total profit
- $-30,647
- Equity at exit
- $29,075
- IRR
- -8.7%
- Equity multiple
- 0.47×
- Total profit
- $-28,796
- Equity at exit
- $16,860
Cash invested: $54,600 (down + closing). Projections, not guarantees.
Landlord ↔ Tenant lean methodology
- Overall (STATE)
- 87 Strongly Landlord-Friendly
- State Texas
- 87 Strongly Landlord-Friendly · R+5
- County
- — inherits STATE
- City
- — inherits STATE
ZIP-level market 76134
- Home prices YoY
- -6.9%
- Rents YoY
- 2.3%
- Active inventory
- 120
- Price-to-rent
- 9.0×
Monthly cashflow live
- Estimated rent
- $1,813 high interval (Pro) →
- Mortgage (P&I)
- −$1,023
- Tax from tax record
- −$294 /mo · $3,530/yr
- Insurance
- −$81
- HOA
- −$0
- Vacancy / Maint / Mgmt
- −$381
- Net cashflow
- $34
Break-even live
UW: 25.0% down · 7.5% · 30yr · 1.5% tax · 5.0% vac · 8.0% maint · 8.0% mgmt
Financing live
Cash to close
- Down payment
- $48,750
- Closing costs
- $5,850
- Reserves months
- —
- Total cash needed
- —
Loan-product check · same deal, 3 products live
Conventional
25% down · 7.5% · 30yr
- Down + closing
- —
- Monthly P&I
- —
- Monthly cashflow
- —
- DSCR
- —
- Eligible?
- —
Personal DTI + credit; lowest rate.
DSCR
20% down · 8.5% · 30yr
- Down + closing
- —
- Monthly P&I
- —
- Monthly cashflow
- —
- DSCR
- —
- Eligible?
- —
No personal income docs; deal must DSCR.
Hard money
10% down · 12.0% · 12mo
- Down + closing
- —
- Monthly P&I
- —
- Monthly cashflow
- —
- DSCR
- —
- Eligible?
- —
Short-term bridge; refi at stabilization.
Rent comps 9 comps
| Address | Beds | Baths | Sqft | Rent | $/sqft | DOM | Units | Dist |
|---|---|---|---|---|---|---|---|---|
| 1205 Hamsted St Fort Worth, TX | 2.0 | 1.0 | 768 | $1,590 | $2.07 | 22d | 1 | 0.08mi |
| 5612 James Ave Fort Worth, TX | 1.0–3.0 | 1.0–2.0 | 824 | $1,700 | $2.06 | 3d | 8 | 0.45mi |
| 1000 W Hammond St Fort Worth, TX | 2.0 | 1.0 | 900 | $1,600 | $1.78 | 24d | 1 | 1.17mi |
| 6608 South Fwy Fort Worth, TX | 1.0–3.0 | 1.0–2.0 | 1047 | $1,495 | $1.43 | 2d | 8 | 1.33mi |
| 4318 Baldwin Ave Fort Worth, TX | 2.0 | 1.0 | 730 | $1,399 | $1.92 | 43d | 1 | 1.36mi |
| 4321 Baldwin Ave Fort Worth, TX | 2.0 | 1.0 | 730 | $1,399 | $1.92 | 43d | 1 | 1.37mi |
| 4316 Baldwin Ave Fort Worth, TX | 2.0 | 1.0 | 730 | $1,399 | $1.92 | 43d | 3 | 1.37mi |
| 4317 Baldwin Ave Fort Worth, TX | 1.0–2.0 | 1.0 | 642 | $1,399 | $2.18 | 43d | 2 | 1.39mi |
| 1127 Eloise Dr Fort Worth, TX | 2.0 | 1.0–2.0 | 656 | $1,911 | $2.91 | 2d | 12 | 1.41mi |
Listing history 30 events
-
2026-06-18days on market $195,000 Active 48 DOM
-
2026-06-17days on market $195,000 Active 47 DOM
-
2026-06-16days on market $195,000 Active 46 DOM
-
2026-06-15days on market $195,000 Active 45 DOM
-
2026-06-13days on market $195,000 Active 43 DOM
-
2026-06-09days on market $195,000 Active 39 DOM
-
2026-06-08days on market $195,000 Active 38 DOM
-
2026-06-07days on market $195,000 Active 37 DOM
-
2026-06-04days on market $195,000 Active 34 DOM
-
2026-06-03days on market $195,000 Active 33 DOM
-
2026-06-02days on market $195,000 Active 32 DOM
-
2026-06-01days on market $195,000 Active 31 DOM
-
2026-05-31days on market $195,000 Active 30 DOM
-
2026-05-01$195,000 Active 531-char remark
-
2016-09-09soldstatus
-
2016-09-07soldstatus Sold 175-char remark
Show marketing remark (175 chars)
This cute 3 bedroom, 1 bath house features: Open living room area! Spacious front yard! Centrally located close to popular shopping center and schools. Priced to sell quickly.
-
2016-06-06status Pending 175-char remark
Show marketing remark (175 chars)
This cute 3 bedroom, 1 bath house features: Open living room area! Spacious front yard! Centrally located close to popular shopping center and schools. Priced to sell quickly.
-
2016-06-03historical Active Option Contract 175-char remark
Show marketing remark (175 chars)
This cute 3 bedroom, 1 bath house features: Open living room area! Spacious front yard! Centrally located close to popular shopping center and schools. Priced to sell quickly.
-
2016-05-19status Active 175-char remark
Show marketing remark (175 chars)
This cute 3 bedroom, 1 bath house features: Open living room area! Spacious front yard! Centrally located close to popular shopping center and schools. Priced to sell quickly.
-
2016-03-28status Pending 175-char remark
Show marketing remark (175 chars)
This cute 3 bedroom, 1 bath house features: Open living room area! Spacious front yard! Centrally located close to popular shopping center and schools. Priced to sell quickly.
-
2016-03-28historical 175-char remark
Show marketing remark (175 chars)
This cute 3 bedroom, 1 bath house features: Open living room area! Spacious front yard! Centrally located close to popular shopping center and schools. Priced to sell quickly.
-
2016-02-18price $64,900 175-char remark
Show marketing remark (175 chars)
This cute 3 bedroom, 1 bath house features: Open living room area! Spacious front yard! Centrally located close to popular shopping center and schools. Priced to sell quickly.
-
2016-01-28$65,000 Active 175-char remark
Show marketing remark (175 chars)
This cute 3 bedroom, 1 bath house features: Open living room area! Spacious front yard! Centrally located close to popular shopping center and schools. Priced to sell quickly.
-
2015-02-17historical
-
2014-11-20price $62,900
-
2014-11-14price $67,900
-
2014-07-10$69,900 Active
-
2004-01-08historical
-
2003-07-31$36,000
-
1983-12-06soldstatus
ⓘ Source: listings_history table (triggers on properties + properties_extension) + one-shot
backfill from property_details.listing_events for pre-trigger history.
Tax reassessment forecast TX · Resets to sale price
- Current annual tax
- $3,530 · $294/mo
- Projected year-2 tax
- $3,568 · $297/mo
- Expected delta
- +$38/yr (+$3/mo · 1.1%)
ⓘ Screening estimate from a state-policy table — verify with the county assessor before closing.
Climate risk First Street
- Flood 1/10 Low FEMA zone X (unshaded) · 0% chance over 30 yrs
- Wildfire 1/10 Low
- Heat 7/10 Severe 7 d/yr ≥109°F today · 23 d/yr by 30 yrs out
- Wind 4/10 Moderate 24% chance of damaging wind over 30 yrs
- Air quality 3/10 Moderate 3 unhealthy d/yr today · 4 by 30 yrs out
Nearby sold comps map
Loading sold comps map…
Walkable amenities ~0.75 mi
Loading nearby amenities…
Taxation est. · year 1
- Rental income
- $21,752
- − Mortgage interest
- −$10,923
- − Property taxes
- −$3,530
- − Insurance
- −$975
- − Repairs & maintenance
- −$1,740
- − Management
- −$1,740
- − Depreciation
- −$5,673
- Taxable loss
- −$2,830
- Est. tax savings @ 24.0%
- +$679
- After-tax cash flow
- $1,086/yr
For passive investors: Depreciation is non-cash, so a rental often shows a tax loss while cash-flowing — sheltering income. Rental losses are passive: they offset passive income freely, and up to $25,000/yr can offset ordinary (W-2) income if you actively participate and your MAGI is under $100k (phasing out to $0 by $150k); unused losses carry forward. On sale, claimed depreciation is recaptured at up to 25%, and gains may owe capital-gains tax (a 1031 exchange can defer both). Figures are a year-1 estimate at your 24.0% rate — not tax advice; consult a CPA.
Schools (NCES district)
- District
- Fort Worth ISD
- NCES district ID
- 4819700
- Math proficiency
- 18% ▼ -16.00%
- Reading proficiency
- 28% ▼ -6.00%
- Median HH income
- $42,109
- Composite
- 19.61/100
- National rank
- #8753
- State rank
- #742 of 826 in TX
Livability — Fort Worth
- Score
- 80/100
- State rank
- #49
- US rank
- #1954
Category grades
Schools grade is shown separately in the Schools card above.
Census & demographics
- Census place
- Fort Worth, TX
- County
- Tarrant County · 2,033,669 people
- City population
- 911,619
- Metro
- Dallas-Fort Worth-Arlington, TX
- Population (ZIP)
- 29,949
- Household income
- $70,945
- Rent vs Own
- Severe rent burden
- 1539.0
Population outlook (Tarrant County) Hauer SSP2
- Today (2025)
- 2,380,417 people
- By 2030
- 2,578,900 · +8.3%
- By 2040
- 2,974,995 · +25.0%
- By 2050
- 3,350,489 · +40.8%
- By 2075
- 4,216,909 · +77.2%
- By 2100
- 4,741,527 · +99.2%
Race, ethnicity, and origin ACS 2023
- Neighborhood character
- Diverse neighborhood (Simpson 0.68)
- Race & ethnicity
- Hispanic / Latino 43% Black 31% Two or more races 21% White 19% Asian 4%
- Hispanic origin (detail)
- Mexican 38% Puerto Rican 1% Cuban 2%
- Common ancestry
- Lithuanian 2% Italian 2% Portuguese 1%
- Foreign-born
- 20% · Canada, Vietnam, Philippines
- Languages at home
- 62% English-only · Spanish 31% Vietnamese 3% French/Haitian/Cajun 1%
Political lean MEDSL · Tarrant
- 2024 margin
- Lean R (+5.1) · D 46.7% · R 51.9% · Other 1.4%
- 2008→2024 swing
- +6.6pp toward D · 2008: -11.7pp · 2024: -5.1pp
- All cycles
- 2024: R+5.1 2020: D+0.2 2016: R+8.7 2012: R+15.7 2008: R+11.7
Not yet ingested
- Civics
- —
Market trends
- HPI YoY
- ▼ -23.91%
- Current HPI
- 323.2306
- Rent YoY
- ▲ 2.30%
- Metro
- Dallas-Fort Worth-Arlington, TX
- State GDP YoY
- ▲ 3.95%
- F500 in state
- 110
Industry mix (Fortune 500 HQ in TX)
| Industry | F500 HQs | Revenue |
|---|---|---|
| Energy | 16 | $1,198B |
|
||
| Technology | 5 | $198B |
|
||
| Engineering / Construction | 4 | $72B |
|
||
| Energy Services | 3 | $60B |
|
||
| Utilities | 3 | $41B |
|
||
| Healthcare | 2 | $330B |
|
||
Price history
+441.7% since first listed17 events — show timeline
- 2026-05-01 Listed $195,000 NTREIS
- 2016-09-09 Sold (Public Records) — Public Records
- 2016-09-07 Sold (MLS) — NTREIS
- 2016-06-06 Pending — NTREIS
- 2016-06-03 Contingent — NTREIS
- 2016-05-19 Relisted — NTREIS
- 2016-03-28 Pending — NTREIS
- 2016-03-28 Listing Removed — NTREIS
- 2016-02-18 Price Changed $64,900 NTREIS
- 2016-01-28 Listed $65,000 NTREIS
- 2015-02-17 Listing Removed — NTREIS
- 2014-11-20 Price Changed $62,900 NTREIS
- 2014-11-14 Price Changed $67,900 NTREIS
- 2014-07-10 Listed $69,900 NTREIS
- 2004-01-08 Listing Removed — NTREIS
- 2003-07-31 Listed $36,000 NTREIS
- 1983-12-06 Sold (Public Records) — Public Records
Property tax history
+6.5%/yrLatest (2025): $3,530 · -10.9% YoY. Source: county tax records.
Cash-flow waterfall
monthlySold comps — $/sqft
last 12 mo · ≤1 miLoading sold comps…