 🏗️ New Construction
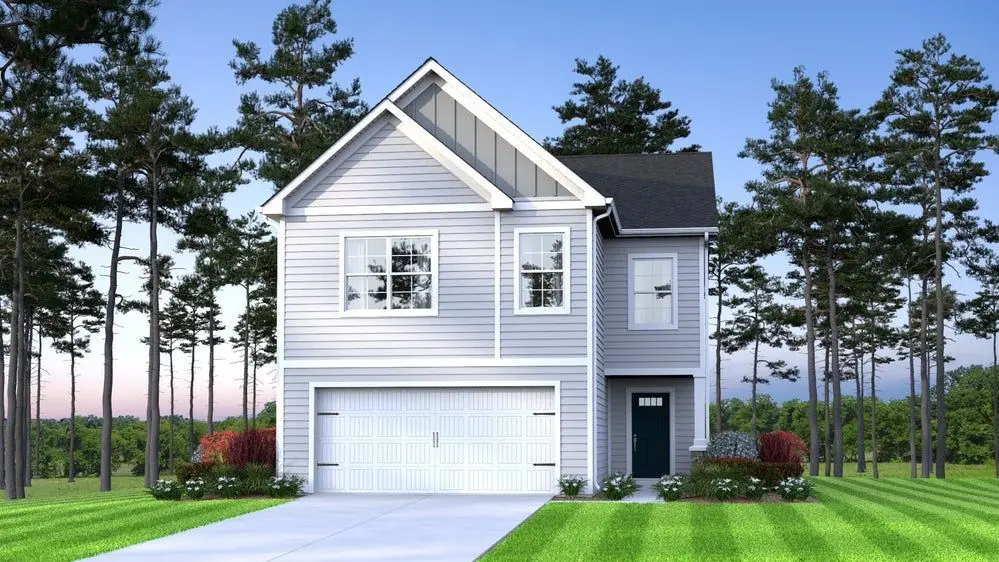
Cypress A Plan · Columbia, SC
Flood risk 1/10 · Minimal
- FEMA flood zone
- X (unshaded)
- Chance of flooding over 30 yrs
- 0.0%
- Est. flood insurance / yr
- $507 – $1,088
Fire risk 4/10 · Minor
- Est. fire insurance / yr
- $783 – $1,453
Heat risk 6/10 · Moderate
- Hot days now (above 107°F)
- 7 days/yr
- Hot days in 30 yrs
- 15 days/yr
Wind risk 6/10 · Moderate
- Chance of severe wind over 30 yrs
- 67.0%
Air-quality risk 3/10 · Minor
- Unhealthy air days now
- 2 days/yr
- Unhealthy air days in 30 yrs
- 2 days/yr
Risk factors via First Street. Map © Google.
Why this score? — see what drove the D grade
The composite is a weighted blend of 9 inputs, each scored 0–100. Each bar is that input's sub-score; the figure is the points it added to the 100-point composite (weight × sub-score).
- Cash flow +13.7/30.0
- ARV discount +7.5/15.0
- DSCR +4.1/10.0
- Condition / age +4.0/5.0
- Livability +3.9/5.0
- 1% rule +3.8/10.0
- Schools +2.6/10.0
- Rent growth +2.5/5.0
- Appreciation +0.0/10.0
$269,290
🖨 Deal sheet 📄 Offer letter ✓ Due diligence
Listing remarks
The Cypress is a home that feels spacious from the moment you step inside. This floor plan offers 4 bedrooms, 2.5 bathrooms, and 2,075 square feet of beautifully designed living space, along with a two-car garage. When you enter through the foyer, you're welcomed into a spacious main living area that flows naturally between the great room, kitchen, and dining space. The kitchen features a central island that's perfect for meal prep, quick breakfasts, or gathering throughout the day, along with a pantry and a convenient cubby area for extra storage and organization. Just off the dining area, step outside to the patio-perfect for grilling, enjoying fresh air, or winding down after a long day.
Key facts
- Central island
- Pantry
- Walk-in closet
Tags
Property features AI
Finance
- Financial info: List price: $269,290
Exterior
- Parking: 2 parking spaces; 2-car garage
- Home design: Single-family home (plan); Address listed as Cypress A Plan, Hopkins, SC 29061
- Exterior features: Living area: 2,075 (listed)
Interior
- Bedrooms: 4 bedrooms
- Bathrooms: 2 full bathrooms and 1 half bathroom (2.5 total)
- Interior features: Plan name: Cypress A; New construction plan
Neighborhood map
What this means for you Summary
Snapshot
- This is a 4-bed/2.5-bath single-family listed at $269k. Condition is rated good.
Deal economics
- At list price, monthly cash flow is $21 ($251/yr) — positive.
- The deal already cash-flows at list — no discount required.
- To meet the 1% rule (rent ≥ 1% of price), the offer needs to be $240k (10.7% below list).
- Recommended offer: $240k (10.7% below list) — sets the bar for 1% rule.
- Cap rate 6.4% vs local median 5.0% in Columbia — meaningfully above typical; check what's discounted (condition, days-on-market, listing class) to confirm the premium yield is real.
Location & tenants
- Location reads 78/100 on livability (#18 in SC, #2,436 nationally) — a middle-class / working-renter tenant base. Strengths: amenities A+, commute A+, cost of living A+; Watch: schools D+, employment D, crime F.
- Richland 01 (urban): math 26% / reading 36% proficiency, ranked #54 of 80 in SC (top 68%) — families likely to look elsewhere, expect single-tenant / working-renter base with shorter leases; 64% free/reduced lunch — lower-income household profile, screen leases tightly.
- Market conditions: 328 active listings in the ZIP; 5 comparable units currently listed for rent nearby; rentals at typical pace (median 14d on market — plan ~3-4 weeks tenant-placement turnaround); 3,472 units permitted in Richland County in 2024 (1,096 in 5+ unit buildings).
- At $2,404/mo this rent would consume 48% of the median local household income ($60k/yr) (locally 236% of renters already pay >50% of income on rent) — very limited rent-growth headroom before tenants either downsize or default.
Forward outlook
- Local home prices are declining (-3.0%/yr); year-one equity from $2k of loan paydown is wiped out by about $8k of value loss. Plan a longer hold.
- Richland County population projected at +30% by 2050 — long-run rental-demand tailwind backs the buy-and-hold thesis.
Negotiation context
- Only 6 days on market — expect competitive offers; lowballing is unlikely to land.
Risks & watch-outs
- Climate carrying-cost: major wind risk, 67% chance of damaging wind over 30y; extreme-heat days projected 7→15/yr by 2055 (HVAC capex compounding) — expect insurance premiums to compound above CPI over the hold.
Questions for the listing agent
- Is there a deadline driving the sale (1031 exchange, divorce, estate, relocation)? That informs how much negotiation room exists.
- Schools are D-rated, which usually means shorter tenancies and higher turnover. Who's the typical renter profile here, and what's been the actual vacancy rate?
- Crime grade is F in this area — have there been break-ins, vandalism, or insurance claims at this property in the last 3 years? What carrier currently insures it and at what premium?
- The area grade is low — what's the realistic commute time and amenity access for the typical tenant pool here? Any planned neighborhood developments (good or bad) we should know about?
- What's the average days-on-market for RENTAL listings here right now (not sales)? A rising rental-DOM trend means longer vacancies and softer asking-rent achievability than the comps imply.
- What's the recent tenant-quality profile in this submarket — average credit score on applications, eviction rate, late-payment / NSF rate, and stable-employment percentage? A property-management company in the area should have these aggregated.
- How much new for-sale + rental construction is in the pipeline within 1–3 miles? Heavy new supply typically softens prices + rents 12–24 months out; constrained supply supports both.
Investment metrics
- 1% rule
- 0.88% ✗
- Cap rate
- 6.39%
- Cash-on-cash
- 0.33%
- DSCR
- 1.01
- GRM
- 9.4
CMA / ARV
- ARV (on-the-fly)
- $271,825
- Comps found
- 1
Show comp detail 1 sale within ~0.75 mi
| Address | Dist | Beds/Ba | Sqft | Sold | Price | $/sf | Match |
|---|---|---|---|---|---|---|---|
| 130 Purple Heron Way | 0.28mi | 3/2.5 (-1) | 1,883 (-9%) | 16mo | $247,290 | $131 | 54 |
Match score weights: distance 35% · size 25% · config 20% · recency 20%. Top-matched comps best support the ARV.
Projected returns pro-forma
-3.0% appreciation · 3.0% rent growth · sell at horizon
- IRR
- -15.8%
- Equity multiple
- 0.44×
- Total profit
- $-42,677
- Equity at exit
- $40,530
- IRR
- -7.3%
- Equity multiple
- 0.54×
- Total profit
- $-35,297
- Equity at exit
- $23,502
Cash invested: $76,111 (down + closing). Projections, not guarantees.
Landlord ↔ Tenant lean methodology
- Overall (STATE)
- 90 Strongly Landlord-Friendly
- State South Carolina
- 90 Strongly Landlord-Friendly · R+6
- County
- — inherits STATE
- City
- — inherits STATE
ZIP-level market 29061
- Home prices YoY
- -22.8%
- Active inventory
- 328
- Price-to-rent
- 9.3×
Monthly cashflow live
- Estimated rent
- $2,404 high interval (Pro) →
- Mortgage (P&I)
- −$1,425
- Tax est. 1.5%
- −$340 /mo · $4,077/yr
- Insurance
- −$113
- HOA
- −$0
- Vacancy / Maint / Mgmt
- −$505
- Net cashflow
- $21
Break-even live
UW: 25.0% down · 7.5% · 30yr · 1.5% tax · 5.0% vac · 8.0% maint · 8.0% mgmt
Financing live
Cash to close
- Down payment
- $67,956
- Closing costs
- $8,155
- Reserves months
- —
- Total cash needed
- —
Loan-product check · same deal, 3 products live
Conventional
25% down · 7.5% · 30yr
- Down + closing
- —
- Monthly P&I
- —
- Monthly cashflow
- —
- DSCR
- —
- Eligible?
- —
Personal DTI + credit; lowest rate.
DSCR
20% down · 8.5% · 30yr
- Down + closing
- —
- Monthly P&I
- —
- Monthly cashflow
- —
- DSCR
- —
- Eligible?
- —
No personal income docs; deal must DSCR.
Hard money
10% down · 12.0% · 12mo
- Down + closing
- —
- Monthly P&I
- —
- Monthly cashflow
- —
- DSCR
- —
- Eligible?
- —
Short-term bridge; refi at stabilization.
Rent comps 5 comps
| Address | Beds | Baths | Sqft | Rent | $/sqft | DOM | Units | Dist |
|---|---|---|---|---|---|---|---|---|
| 331 Crooked Pine Ct Columbia, SC | 4.0 | 2.5 | 1775 | $2,133 | $1.20 | 19d | 1 | 0.12mi |
| 706 Common Widgeon WAY Hopkins, SC | 4.0 | 2.5 | 2157 | $2,430 | $1.13 | 14d | 1 | 0.19mi |
| 440 Delahays Rd Columbia, SC | 3.0 | 2.5 | 1704 | $1,900 | $1.12 | 14d | 1 | 0.83mi |
| 457 Delahays Rd Columbia, SC | 3.0 | 2.0 | 1704 | $2,000 | $1.17 | 14d | 1 | 0.88mi |
| 352 Sandbach Rd Columbia, SC | 4.0 | 2.5 | 1976 | $2,300 | $1.16 | 14d | 1 | 0.90mi |
Listing history 6 events
-
2026-06-18days on market $269,290 Active 6 DOM
-
2026-06-17days on market $269,290 Active 5 DOM
-
2026-06-16days on market $269,290 Active 4 DOM
-
2026-06-15days on market $269,290 Active 3 DOM
-
2026-06-14remarks 699-char remark
-
2026-06-14$269,290 Active 1 DOM
ⓘ Source: listings_history table (triggers on properties + properties_extension) + one-shot
backfill from property_details.listing_events for pre-trigger history.
Climate risk First Street
- Flood 1/10 Low FEMA zone X (unshaded) · 0% chance over 30 yrs
- Wildfire 4/10 Moderate
- Heat 6/10 Major 7 d/yr ≥107°F today · 15 d/yr by 30 yrs out
- Wind 6/10 Major 67% chance of damaging wind over 30 yrs
- Air quality 3/10 Moderate 2 unhealthy d/yr today · 2 by 30 yrs out
Nearby sold comps map
Loading sold comps map…
Walkable amenities ~0.75 mi
Loading nearby amenities…
Taxation est. · year 1
- Rental income
- $28,853
- − Mortgage interest
- −$15,226
- − Property taxes
- −$4,077
- − Insurance
- −$1,359
- − Repairs & maintenance
- −$2,308
- − Management
- −$2,308
- − Depreciation
- −$7,908
- Taxable loss
- −$4,334
- Est. tax savings @ 24.0%
- +$1,040
- After-tax cash flow
- $1,292/yr
For passive investors: Depreciation is non-cash, so a rental often shows a tax loss while cash-flowing — sheltering income. Rental losses are passive: they offset passive income freely, and up to $25,000/yr can offset ordinary (W-2) income if you actively participate and your MAGI is under $100k (phasing out to $0 by $150k); unused losses carry forward. On sale, claimed depreciation is recaptured at up to 25%, and gains may owe capital-gains tax (a 1031 exchange can defer both). Figures are a year-1 estimate at your 24.0% rate — not tax advice; consult a CPA.
Condition & rehab AI · 12 photos
This home is in excellent condition with no major repairs needed. It offers a good ROI with updates focusing on curb appeal and interior aesthetics.
Value-add opportunities
- Both Painting exterior and interior walls — Enhances curb appeal and interior aesthetics
- Both Landscaping improvements — Enhances curb appeal and adds value
- Both New flooring in bathrooms — Improves aesthetics and functionality
- Both New kitchen appliances — Modernizes the kitchen and adds value
Renovation cost estimate screening
Value-add ROI direction
- Both Painting exterior and interior walls — Enhances curb appeal and interior aesthetics ↑
- Both Landscaping improvements — Enhances curb appeal and adds value ↑
- Both New flooring in bathrooms — Improves aesthetics and functionality ↑
- Both New kitchen appliances — Modernizes the kitchen and adds value ↑
ⓘ Cost ranges are severity-bucket heuristics (US national rule-of-thumb). Get contractor quotes + a written scope before underwriting a rehab budget.
Schools (NCES district)
- District
- Richland 01
- NCES district ID
- 4503360
- Math proficiency
- 26% ▼ -7.00%
- Reading proficiency
- 36% ▼ -5.00%
- Median HH income
- $38,931
- Composite
- 25.94/100
- National rank
- #7335
- State rank
- #54 of 80 in SC
Livability — Columbia
- Score
- 78/100
- State rank
- #18
- US rank
- #2436
Category grades
Schools grade is shown separately in the Schools card above.
Census & demographics
- Census place
- Columbia, SC
- County
- Richland County · 389,530 people
- City population
- 335,994
- Metro
- Columbia, SC
- Population (ZIP)
- 12,538
- Household income
- $60,307
- Rent vs Own
- Severe rent burden
- 236.0
Population outlook (Richland County) Hauer SSP2
- Today (2025)
- 459,667 people
- By 2030
- 487,524 · +6.1%
- By 2040
- 542,035 · +17.9%
- By 2050
- 595,371 · +29.5%
- By 2075
- 732,998 · +59.5%
- By 2100
- 820,415 · +78.5%
Race, ethnicity, and origin ACS 2023
- Neighborhood character
- Predominantly Black (68%)
- Race & ethnicity
- Black 68% White 23% Two or more races 6% Hispanic / Latino 4%
- Common ancestry
- Italian 1% Lithuanian 1% Romanian 1%
- Foreign-born
- 3% · Canada
- Languages at home
- 96% English-only · Spanish 3%
Political lean MEDSL · Richland
- 2024 margin
- Solid D (+34.6) · D 66.4% · R 31.8% · Other 1.8%
- 2008→2024 swing
- +5.7pp toward D · 2008: 28.9pp · 2024: 34.6pp
- All cycles
- 2024: D+34.6 2020: D+38.3 2016: D+32.9 2012: D+33.3 2008: D+28.9
Not yet ingested
- Civics
- —
Market trends
- HPI YoY
- ▼ -57.44%
- Current HPI
- 194.8986
- Rent YoY
- —
- Metro
- Columbia, SC
- State GDP YoY
- ▲ 4.51%
- F500 in state
- 2
Industry mix (Fortune 500 HQ in SC)
| Industry | F500 HQs | Revenue |
|---|---|---|
| Packaging | 1 | $7B |
|
||
Cash-flow waterfall
monthlySold comps — $/sqft
last 12 mo · ≤1 miLoading sold comps…