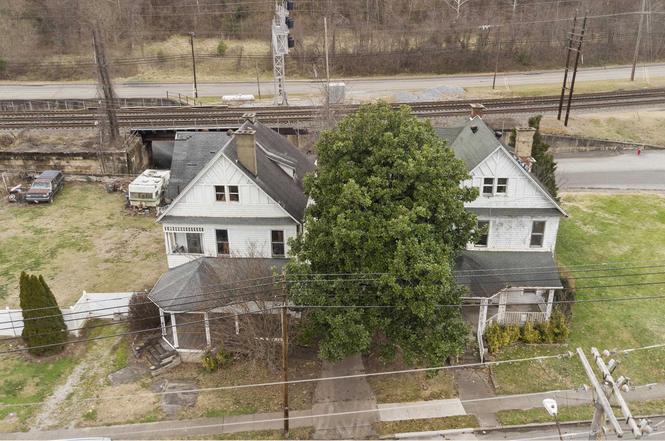
3112 Oakland Avenue Ave · Catlettsburg, KY
Flood risk 1/10 · Minimal
- FEMA flood zone
- X
- Chance of flooding over 30 yrs
- 0.0%
- Est. flood insurance / yr
- $507 – $1,088
Fire risk 3/10 · Minor
- Est. fire insurance / yr
- $839 – $1,559
Heat risk 4/10 · Minor
- Hot days now (above 102°F)
- 7 days/yr
- Hot days in 30 yrs
- 20 days/yr
Wind risk 2/10 · Minimal
- Chance of severe wind over 30 yrs
- 1.0%
Air-quality risk 2/10 · Minimal
- Unhealthy air days now
- 0 days/yr
- Unhealthy air days in 30 yrs
- 1 days/yr
Risk factors via First Street. Map © Google.
Why this score? — see what drove the B grade
The composite is a weighted blend of 9 inputs, each scored 0–100. Each bar is that input's sub-score; the figure is the points it added to the 100-point composite (weight × sub-score).
- Cash flow +30.0/30.0
- 1% rule +10.0/10.0
- DSCR +10.0/10.0
- ARV discount +7.5/15.0
- Appreciation +6.5/10.0
- Livability +3.4/5.0
- Rent growth +2.5/5.0
- Schools +2.5/10.0
- Condition / age +2.5/5.0
$55,000
🖨 Deal sheet (PDF) 📄 Offer letter ✓ Due diligence
Listing remarks
Two side-by-side historic homes in Catlettsburg, offered individually or as a package. These homes carry the soul and craftsmanship of another era, featuring original woodwork and architectural details that are nearly impossible to recreate today. They’re ready for someone with vision and appreciation for true character to restore them to their natural beauty. Whether you choose one or take on both, this is a rare opportunity to bring timeless homes back to life and preserve a piece of local history.
Key facts
- Original woodwork
- 5,000 sq ft lot
- Built 1880
Tags
Property features AI
Exterior
- Parking: No designated parking
- Utilities: Public water; Public sewer
- Home design: Single-family residence; 2 stories
- Construction: Wood siding; Block foundation; Built above grade: 2,776 (finished area)
- Exterior features: Porch; Composition roof
Interior
- Kitchen: Dishwasher; Microwave; Refrigerator
- Bathrooms: 1 full bathroom; 1 half bathroom
- Heating & cooling: Central air
- Interior features: Dishwasher; Microwave; Refrigerator; Central air conditioning
Neighborhood map
What this means for you Summary
Snapshot
- This is a 4-bed/1.5-bath single-family listed at $55k.
Deal economics
- At list price, monthly cash flow is $703 ($8k/yr) — positive.
- The deal already cash-flows at list — no discount required.
- Meets the 1% rule at list price ($1k rent vs $55k).
- Recommended offer: $48k (12.0% below list) — sets the bar for market timing.
- Cap rate 21.6% vs local median 5.4% in Catlettsburg — top-decile yield for the area; either an underpriced asset or a hidden risk that comps aren't pricing in. Stress-test before assuming the spread holds.
Location & tenants
- Location reads 68/100 on livability (#187 in KY) — a middle-class / working-renter tenant base. Strengths: crime A+, cost of living A+, housing B+; Watch: amenities F, commute F, employment F.
- Boyd County (suburban): math 20% / reading 37% proficiency, ranked #115 of 165 in KY (top 70%) — low school quality limits family demand, transient renter base, plan for 1-2y turnover.
- Zoned schools: Catlettsburg Elementary School (math 12% / reading 27%, grade F, #572 of 676 statewide, top 88%, 209 students, 80% FRL); Boyd County Middle School (math 18% / reading 39%, grade F, #161 of 217 statewide, top 75%, 620 students, 55% FRL); Boyd County High School (math 27% / reading 37%, grade F, #97 of 254 statewide, top 46%, 911 students, 52% FRL) — zoned schools average 62% FRL vs 45% district-wide (17 pts higher); higher-poverty schools than district average — tighter screening recommended.
- Market conditions: 48 active listings in the ZIP; 2 units permitted in Boyd County in 2024 (0 in 5+ unit buildings).
Forward outlook
- In year one you build about $2k of equity ($380 loan paydown + $2k appreciation (3.1% local appreciation)).
- Boyd County population projected at -17% by 2050 — secular population decline; favor cash flow + early exit over multi-decade hold.
- At projected returns (3.1% appreciation + 3.0% rent growth), your $15k cash investment doubles in ~2 years — after that, you're playing with house money.
Negotiation context
- It's been on market 125 days — a 12% lower offer ($48k) is reasonable based on typical stale-listing flexibility.
- 3 sale attempts; this cycle's ask has dropped $4k (7%) from the opening price — seller is motivated, your offer sets the floor, not the list.
Risks & watch-outs
- Watch-outs: built in 1880 — expect roof / HVAC / electrical / plumbing capex.
Questions for the listing agent
- It's been on market 125 days. Have you received any prior offers? Is the seller open to a 12% concession, seller financing, or rate buy-down credit?
- Built in 1880 — when were the roof, HVAC, electrical panel, plumbing, and water heater last replaced?
- Why hasn't it sold? Are there any deal-killer items the seller is aware of (foundation, flood, title, zoning, code violations)?
- Is there a deadline driving the sale (1031 exchange, divorce, estate, relocation)? That informs how much negotiation room exists.
- Schools are D-rated, which usually means shorter tenancies and higher turnover. Who's the typical renter profile here, and what's been the actual vacancy rate?
- What's the average days-on-market for RENTAL listings here right now (not sales)? A rising rental-DOM trend means longer vacancies and softer asking-rent achievability than the comps imply.
- What's the recent tenant-quality profile in this submarket — average credit score on applications, eviction rate, late-payment / NSF rate, and stable-employment percentage? A property-management company in the area should have these aggregated.
- How much new for-sale + rental construction is in the pipeline within 1–3 miles? Heavy new supply typically softens prices + rents 12–24 months out; constrained supply supports both.
Investment metrics
- 1% rule
- 2.40% ✓
- Cap rate
- 21.62%
- Cash-on-cash
- 54.75%
- DSCR
- 3.44
- GRM
- 3.5
CMA / ARV
- ARV (on-the-fly)
- $180,440
- Comps found
- 1
Show comp detail 1 sale within ~0.75 mi
| Address | Dist | Beds/Ba | Sqft | Sold | Price | $/sf | Match |
|---|---|---|---|---|---|---|---|
| 3216 Oakland Avenue Ave | 0.24mi | 4/2.0 | 2,920 (+5%) | 24mo | $190,000 | $65 | 58 |
Match score weights: distance 35% · size 25% · config 20% · recency 20%. Top-matched comps best support the ARV.
Projected returns pro-forma
3.09% appreciation · 3.0% rent growth · sell at horizon
- IRR
- 59.8%
- Equity multiple
- 4.35×
- Total profit
- $51,622
- Equity at exit
- $24,996
- IRR
- 59.3%
- Equity multiple
- 8.84×
- Total profit
- $120,743
- Equity at exit
- $38,731
Cash invested: $15,400 (down + closing). Projections, not guarantees.
Landlord ↔ Tenant lean methodology
- Overall (STATE)
- 83 Strongly Landlord-Friendly
- State Kentucky
- 83 Strongly Landlord-Friendly · R+16
- County
- — inherits STATE
- City
- — inherits STATE
ZIP-level market 41129
- Home prices YoY
- 1.2%
- Active inventory
- 48
- Price-to-rent
- 3.5×
Monthly cashflow live
- Estimated rent
- $1,319 medium interval (Pro) →
- Mortgage (P&I)
- −$288
- Tax from tax record
- −$28 /mo · $338/yr
- Insurance
- −$23
- HOA
- −$0
- Vacancy / Maint / Mgmt
- −$277
- Net cashflow
- $703
Break-even live
Sensitivity live
| Price | -10% $734 | -5% $718 | +0% $703 | +5% $687 | +10% $671 |
|---|---|---|---|---|---|
| Rent | -10% $598 | -5% $651 | +0% $703 | +5% $755 | +10% $807 |
| Rate | -1.0pp $730 | -0.5pp $717 | base $703 | +0.5pp $688 | +1.0pp $674 |
UW: 25.0% down · 7.5% · 30yr · 1.5% tax · 5.0% vac · 8.0% maint · 8.0% mgmt
Financing live
Cash to close
- Down payment
- $13,750
- Closing costs
- $1,650
- Reserves months
- —
- Total cash needed
- —
Loan-product check · same deal, 3 products live
Conventional
25% down · 7.5% · 30yr
- Down + closing
- —
- Monthly P&I
- —
- Monthly cashflow
- —
- DSCR
- —
- Eligible?
- —
Personal DTI + credit; lowest rate.
DSCR
20% down · 8.5% · 30yr
- Down + closing
- —
- Monthly P&I
- —
- Monthly cashflow
- —
- DSCR
- —
- Eligible?
- —
No personal income docs; deal must DSCR.
Hard money
10% down · 12.0% · 12mo
- Down + closing
- —
- Monthly P&I
- —
- Monthly cashflow
- —
- DSCR
- —
- Eligible?
- —
Short-term bridge; refi at stabilization.
Listing history 9 events
-
2026-06-02days on market $55,000 Active 125 DOM
-
2026-06-01days on market $55,000 Active 124 DOM
-
2026-05-31days on market $55,000 Active 123 DOM
-
2026-05-31days on market $55,000 Active 122 DOM
-
2026-05-11status Active
-
2026-04-29status Active Under Contract
-
2026-03-28historical Active Under Contract
-
2026-03-10price $55,000
-
2026-01-08$59,000 Active
ⓘ Source: listings_history table (triggers on properties + properties_extension) + one-shot
backfill from property_details.listing_events for pre-trigger history.
Tax reassessment forecast KY · Resets to sale price
- Current annual tax
- $338 · $28/mo
- Projected year-2 tax
- $473 · $39/mo
- Expected delta
- +$135/yr (+$11/mo · 40.0%)
ⓘ Screening estimate from a state-policy table — verify with the county assessor before closing.
Climate risk First Street
- Flood 1/10 Low FEMA zone X · 0% chance over 30 yrs
- Wildfire 3/10 Moderate
- Heat 4/10 Moderate 7 d/yr ≥102°F today · 20 d/yr by 30 yrs out
- Wind 2/10 Low 100% chance of damaging wind over 30 yrs
- Air quality 2/10 Low 0 unhealthy d/yr today · 1 by 30 yrs out
Nearby sold comps map
Loading sold comps map…
Walkable amenities ~0.75 mi
Loading nearby amenities…
Taxation est. · year 1
- Rental income
- $15,830
- − Mortgage interest
- −$3,081
- − Property taxes
- −$338
- − Insurance
- −$275
- − Repairs & maintenance
- −$1,266
- − Management
- −$1,266
- − Depreciation
- −$1,600
- Taxable income
- $8,003
- Est. tax owed @ 24.0%
- −$1,921
- After-tax cash flow
- $6,511/yr
For passive investors: Depreciation is non-cash, so a rental often shows a tax loss while cash-flowing — sheltering income. Rental losses are passive: they offset passive income freely, and up to $25,000/yr can offset ordinary (W-2) income if you actively participate and your MAGI is under $100k (phasing out to $0 by $150k); unused losses carry forward. On sale, claimed depreciation is recaptured at up to 25%, and gains may owe capital-gains tax (a 1031 exchange can defer both). Figures are a year-1 estimate at your 24.0% rate — not tax advice; consult a CPA.
Schools (NCES district)
- District
- Boyd County
- NCES district ID
- 2100620
- Math proficiency
- 20% ▼ -18.00%
- Reading proficiency
- 37% ▼ -17.00%
- Median HH income
- $47,479
- Composite
- 24.65/100
- National rank
- #7625
- State rank
- #115 of 165 in KY
Livability — Catlettsburg
- Score
- 68/100
- State rank
- #187
- US rank
- #9459
Category grades
Schools grade is shown separately in the Schools card above.
Census & demographics
- Census place
- Catlettsburg, KY
- Population (ZIP)
- 8,417
Population outlook (Boyd County) Hauer SSP2
- Today (2025)
- 46,137 people
- By 2030
- 44,585 · -3.4%
- By 2040
- 41,442 · -10.2%
- By 2050
- 38,313 · -17.0%
- By 2075
- 31,077 · -32.6%
- By 2100
- 23,432 · -49.2%
Race, ethnicity, and origin ACS 2023
- Neighborhood character
- Predominantly White (96%)
- Race & ethnicity
- White 96% Two or more races 2% Black 2%
- Common ancestry
- Slovak 2% Serbian 1% Iranian 1%
- Foreign-born
- 0% · Canada
Political lean MEDSL · Boyd
- 2024 margin
- Solid R (+38.5) · D 30.0% · R 68.6% · Other 1.4%
- 2008→2024 swing
- -26.2pp toward R · 2008: -12.3pp · 2024: -38.5pp
- All cycles
- 2024: R+38.5 2020: R+33.2 2016: R+37.0 2012: R+16.3 2008: R+12.3
Not yet ingested
- Civics
- —
Market trends
- HPI YoY
- ▲ 3.09%
- Current HPI
- 265.4897
- Rent YoY
- —
- Metro
- —
- State GDP YoY
- ▲ 1.81%
- F500 in state
- 4
Industry mix (Fortune 500 HQ in KY)
| Industry | F500 HQs | Revenue |
|---|---|---|
| Healthcare | 1 | $118B |
|
||
| Food / Beverage | 1 | $7B |
|
||
Price history
-6.8% since first listed5 events — show timeline
- 2026-05-11 Relisted — AABOR
- 2026-04-29 Relisted — AABOR
- 2026-03-28 Contingent — AABOR
- 2026-03-10 Price Changed $55,000 AABOR
- 2026-01-08 Listed $59,000 AABOR
Property tax history
+47.6%/yrLatest (2025): $338 · -30.9% YoY. Source: county tax records.
Cash-flow waterfall
monthlySold comps — $/sqft
last 12 mo · ≤1 miLoading sold comps…