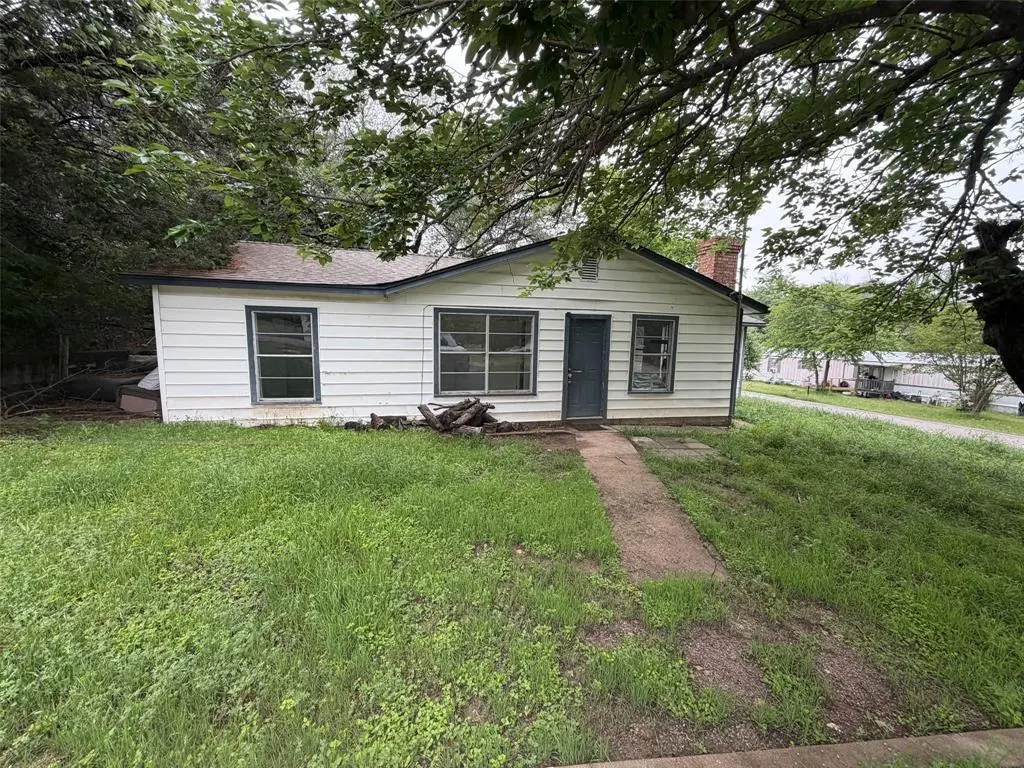
2604 Pinoak St · Oak Trail Shores, TX
Flood risk 1/10 · Minimal
- FEMA flood zone
- X (unshaded)
- Chance of flooding over 30 yrs
- 0.0%
- Est. flood insurance / yr
- $507 – $1,088
Fire risk 5/10 · Moderate
- Est. fire insurance / yr
- $1,222 – $2,270
Heat risk 7/10 · Major
- Hot days now (above 108°F)
- 6 days/yr
- Hot days in 30 yrs
- 18 days/yr
Wind risk 4/10 · Minor
- Chance of severe wind over 30 yrs
- 24.0%
Air-quality risk 2/10 · Minimal
- Unhealthy air days now
- 1 days/yr
- Unhealthy air days in 30 yrs
- 2 days/yr
Risk factors via First Street. Map © Google.
Why this score? — see what drove the B- grade
The composite is a weighted blend of 9 inputs, each scored 0–100. Each bar is that input's sub-score; the figure is the points it added to the 100-point composite (weight × sub-score).
- Cash flow +24.2/30.0
- ARV discount +15.0/15.0
- DSCR +7.8/10.0
- 1% rule +6.4/10.0
- Schools +4.0/10.0
- Livability +2.9/5.0
- Rent growth +2.8/5.0
- Condition / age +2.5/5.0
- Appreciation +0.0/10.0
$115,000
🖨 Deal sheet (PDF) 📄 Offer letter ✓ Due diligence
Listing remarks
Affordable opportunity in Oak Trail Shores! This 2-bedroom, 1 and a half bath home sits on two combined lots in an established lake community with low annual HOA dues and access to community amenities. The open living area features tile flooring, a brick fireplace, and a ceiling fan, with plenty of natural light from large windows. The eat-in kitchen offers good cabinet space and a stainless range. A 2nd living area, with a layout that is functional and efficient. The property is vacant and ready for its next chapter, whether as a primary residence, weekend retreat, or investment-rental. Call today for a tour!
Key facts
- 3,920 sq ft lot
- Built 1981
- Listed 60 days
Property features AI
Finance
- Other: Property listed as active and for sale; Possession at closing/funding
- Financial info: Acceptable financing: Cash and Conventional; No second mortgage reported
- HOA & community: Mandatory association (Oak Trail Shores Owners Association); Annual association fee of $120; Association fees cover full use of facilities and management fees; HOA management phone available
Exterior
- Parking: Driveway (no garage or covered/carport spaces listed)
- Utilities: All-weather road access; Co-op electric service; Not in a municipal utility district
- Home design: Single-family residence; One story; Residential property
- Construction: Built in 1981; Preowned
- Exterior features: Lot smaller than 0.5 acre; Subdivision: Oak Trail Shores Sec B
Interior
- Kitchen: Electric oven
- Bedrooms: 2 bedrooms (Primary bedroom on level 1)
- Bathrooms: 1 full bathroom; 1 half bathroom
- Heating & cooling: Electric heating
- Interior features: Eat-in kitchen; One living area; One dining area; Two total rooms (room count 2)
- Laundry & utility: No smart home features reported
Neighborhood map
What this means for you Summary
Snapshot
- This is a 2-bed/1.5-bath single-family listed at $115k.
Deal economics
- At list price, monthly cash flow is $229 ($3k/yr) — positive.
- The deal already cash-flows at list — no discount required.
- Meets the 1% rule at list price ($1k rent vs $115k).
- Recommended offer: $112k (3.0% below list) — sets the bar for market timing.
- Cap rate 8.7% vs local median 5.9% in Oak Trail Shores — top-decile yield for the area; either an underpriced asset or a hidden risk that comps aren't pricing in. Stress-test before assuming the spread holds.
Location & tenants
- Location reads 58/100 on livability (#1,187 in TX) — a working-class tenant base; expect higher turnover. Strengths: cost of living A+, housing A+, crime B+; Watch: health & safety D+, amenities F, commute F.
- Granbury ISD (town): math 46% / reading 46% proficiency, ranked #237 of 826 in TX (top 29%) — families likely to look elsewhere, expect single-tenant / working-renter base with shorter leases.
- Zoned schools: Nettie Baccus El (math 39% / reading 36%, grade F, #1,744 of 4,322 statewide, top 41%, 466 students, 81% FRL); Granbury Middle (math 35% / reading 40%, grade F, #736 of 1,662 statewide, top 45%, 846 students, 68% FRL); Granbury H S (math 38% / reading 51%, grade F, #652 of 1,632 statewide, top 43%, 2,202 students, 46% FRL) — zoned schools average 65% FRL vs 43% district-wide (22 pts higher); higher-poverty schools than district average — tighter screening recommended.
- Market conditions: Rents rising (+1.1%/yr); 932 active listings in the ZIP; 2 comparable units currently listed for rent nearby; 125 units permitted in Hood County in 2024 (0 in 5+ unit buildings).
Forward outlook
- Local home prices are declining (-3.0%/yr); year-one equity from $795 of loan paydown is wiped out by about $3k of value loss. Plan a longer hold.
- Hood County population projected at +29% by 2050 — long-run rental-demand tailwind backs the buy-and-hold thesis.
Negotiation context
- It's been on market 60 days — a 3% lower offer ($112k) is reasonable based on typical stale-listing flexibility.
- 4 sale attempts since 9y ago with the ask held roughly flat each time — persistent listings suggest the price (not the market) is what's stuck; bring a comps-based counter.
Risks & watch-outs
- Climate carrying-cost: moderate wildfire risk; extreme-heat days projected 6→18/yr by 2055 (HVAC capex compounding) — expect insurance premiums to compound above CPI over the hold.
Questions for the listing agent
- It's been on market 60 days. Have you received any prior offers? Is the seller open to a 3% concession, seller financing, or rate buy-down credit?
- What does the HOA fee cover, when was the last increase, and are there any pending special assessments or reserve-fund shortfalls?
- Is there a deadline driving the sale (1031 exchange, divorce, estate, relocation)? That informs how much negotiation room exists.
- Schools are F-rated, which usually means shorter tenancies and higher turnover. Who's the typical renter profile here, and what's been the actual vacancy rate?
- What's the average days-on-market for RENTAL listings here right now (not sales)? A rising rental-DOM trend means longer vacancies and softer asking-rent achievability than the comps imply.
- What's the recent tenant-quality profile in this submarket — average credit score on applications, eviction rate, late-payment / NSF rate, and stable-employment percentage? A property-management company in the area should have these aggregated.
- How much new for-sale + rental construction is in the pipeline within 1–3 miles? Heavy new supply typically softens prices + rents 12–24 months out; constrained supply supports both.
Investment metrics
- 1% rule
- 1.14% ✓
- Cap rate
- 8.68%
- Cash-on-cash
- 8.52%
- DSCR
- 1.38
- GRM
- 7.3
CMA / ARV
- ARV (median comp)
- $139,666
- List price
- $115,000
- Delta
- -17.66%
- Verdict
- UNDERPRICED
- Comps
- 20 within 1.0 mi
Show comp detail 6 sales within ~0.75 mi
| Address | Dist | Beds/Ba | Sqft | Sold | Price | $/sf | Match |
|---|---|---|---|---|---|---|---|
| 2612 S Oak Trl | 0.20mi | 3/1.5 (+1) | 1,029 (-1%) | 2mo | $180,000 | $175 | 82 |
| 2616 Pinoak St | 0.06mi | 2/1.0 | 948 (-9%) | 16mo | $179,000 | $189 | 67 |
| 3917 Greenbrook St | 0.29mi | 3/1.5 (+1) | 1,152 (+11%) | 2mo | $78,000 | $68 | 62 |
| 3203 Sunrise Ct | 0.56mi | 3/2.0 (+1) | 1,056 (+2%) | 3mo | $180,000 | $170 | 62 |
| 2906 Cedarhill St | 0.49mi | 3/2.0 (+1) | 1,092 (+5%) | 22mo | $110,000 | $101 | 43 |
| 2923 Cedarbrush St | 0.52mi | 2/2.0 | 960 (-8%) | 22mo | $73,000 | $76 | 43 |
Match score weights: distance 35% · size 25% · config 20% · recency 20%. Top-matched comps best support the ARV.
Projected returns pro-forma
-3.0% appreciation · 1.1% rent growth · sell at horizon
- IRR
- -5.5%
- Equity multiple
- 0.80×
- Total profit
- $-6,492
- Equity at exit
- $17,147
- IRR
- 1.7%
- Equity multiple
- 1.11×
- Total profit
- $3,530
- Equity at exit
- $9,943
Cash invested: $32,200 (down + closing). Projections, not guarantees.
Landlord ↔ Tenant lean methodology
- Overall (STATE)
- 87 Strongly Landlord-Friendly
- State Texas
- 87 Strongly Landlord-Friendly · R+5
- County
- — inherits STATE
- City
- — inherits STATE
ZIP-level market 76048
- Home prices YoY
- -23.4%
- Rents YoY
- 1.1%
- Active inventory
- 932
- Price-to-rent
- 7.3×
Monthly cashflow live
- Estimated rent
- $1,306 medium interval (Pro) →
- Mortgage (P&I)
- −$603
- Tax from tax record
- −$142 /mo · $1,700/yr
- Insurance
- −$48
- HOA
- −$10
- Lot rent
- −$0
- Vacancy / Maint / Mgmt
- −$274
- Net cashflow
- $229
Break-even live
Sensitivity live
| Price | -10% $294 | -5% $261 | +0% $229 | +5% $196 | +10% $164 |
|---|---|---|---|---|---|
| Rent | -10% $126 | -5% $177 | +0% $229 | +5% $280 | +10% $332 |
| Rate | -1.0pp $287 | -0.5pp $258 | base $229 | +0.5pp $199 | +1.0pp $169 |
UW: 25.0% down · 7.5% · 30yr · 1.5% tax · 5.0% vac · 8.0% maint · 8.0% mgmt
Financing live
Cash to close
- Down payment
- $28,750
- Closing costs
- $3,450
- Reserves months
- —
- Total cash needed
- —
Loan-product check · same deal, 3 products live
Conventional
25% down · 7.5% · 30yr
- Down + closing
- —
- Monthly P&I
- —
- Monthly cashflow
- —
- DSCR
- —
- Eligible?
- —
Personal DTI + credit; lowest rate.
DSCR
20% down · 8.5% · 30yr
- Down + closing
- —
- Monthly P&I
- —
- Monthly cashflow
- —
- DSCR
- —
- Eligible?
- —
No personal income docs; deal must DSCR.
Hard money
10% down · 12.0% · 12mo
- Down + closing
- —
- Monthly P&I
- —
- Monthly cashflow
- —
- DSCR
- —
- Eligible?
- —
Short-term bridge; refi at stabilization.
Rent comps 2 comps
| Address | Beds | Baths | Sqft | Rent | $/sqft | DOM | Units | Dist |
|---|---|---|---|---|---|---|---|---|
| 3007 Inwood Trl Granbury, TX | 1.0 | 1.0 | 902 | $800 | $0.89 | 21d | 1 | 0.71mi |
| 3225 Evergreen Dr Granbury, TX | 3.0 | 1.0 | 916 | $1,425 | $1.56 | 0d | 1 | 1.35mi |
HOA detail
- Monthly dues
- $10 · $120/yr
Listing history 33 events
-
2026-06-22status $115,000 Pending 60 DOM
-
2026-06-21days on market $115,000 Active 60 DOM
-
2026-06-18days on market $115,000 Active 57 DOM
-
2026-06-17days on market $115,000 Active 56 DOM
-
2026-06-16days on market $115,000 Active 55 DOM
-
2026-06-15days on market $115,000 Active 54 DOM
-
2026-06-13days on market $115,000 Active 52 DOM
-
2026-06-09days on market $115,000 Active 48 DOM
-
2026-06-08days on market $115,000 Active 47 DOM
-
2026-06-07days on market $115,000 Active 46 DOM
-
2026-06-04days on market $115,000 Active 43 DOM
-
2026-06-03days on market $115,000 Active 42 DOM
-
2026-06-02days on market $115,000 Active 41 DOM
-
2026-06-02days on market $115,000 Active 40 DOM
-
2026-05-31days on market $115,000 Active 39 DOM
-
2026-04-20$120,000 Active 617-char remark
-
2020-02-29historical
-
2020-02-03status Active
-
2020-01-02historical Active Option Contract
-
2019-11-07price $92,750
-
2019-10-18price $95,900
-
2019-09-27price $97,500
-
2019-09-09price $99,950
-
2019-09-02$99,995 Active
-
2019-08-14soldstatus
-
2017-04-17historical
-
2017-04-12price $70,900
-
2017-03-28price $74,900
-
2017-03-19$79,900 Active
-
2016-04-07soldstatus
-
2013-09-23soldstatus
-
2001-10-25soldstatus
-
1975-12-04soldstatus
ⓘ Source: listings_history table (triggers on properties + properties_extension) + one-shot
backfill from property_details.listing_events for pre-trigger history.
Tax reassessment forecast TX · Resets to sale price
- Current annual tax
- $1,700 · $142/mo
- Projected year-2 tax
- $2,104 · $175/mo
- Expected delta
- +$405/yr (+$34/mo · 23.8%)
ⓘ Screening estimate from a state-policy table — verify with the county assessor before closing.
Climate risk First Street
- Flood 1/10 Low FEMA zone X (unshaded) · 0% chance over 30 yrs
- Wildfire 5/10 Major
- Heat 7/10 Severe 6 d/yr ≥108°F today · 18 d/yr by 30 yrs out
- Wind 4/10 Moderate 24% chance of damaging wind over 30 yrs
- Air quality 2/10 Low 1 unhealthy d/yr today · 2 by 30 yrs out
Nearby sold comps map
Loading sold comps map…
Walkable amenities ~0.75 mi
Loading nearby amenities…
Taxation est. · year 1
- Rental income
- $15,666
- − Mortgage interest
- −$6,442
- − Property taxes
- −$1,700
- − Insurance
- −$575
- − Repairs & maintenance
- −$1,253
- − Management
- −$1,253
- − HOA
- −$120
- − Depreciation
- −$3,345
- Taxable income
- $978
- Est. tax owed @ 24.0%
- −$235
- After-tax cash flow
- $2,510/yr
For passive investors: Depreciation is non-cash, so a rental often shows a tax loss while cash-flowing — sheltering income. Rental losses are passive: they offset passive income freely, and up to $25,000/yr can offset ordinary (W-2) income if you actively participate and your MAGI is under $100k (phasing out to $0 by $150k); unused losses carry forward. On sale, claimed depreciation is recaptured at up to 25%, and gains may owe capital-gains tax (a 1031 exchange can defer both). Figures are a year-1 estimate at your 24.0% rate — not tax advice; consult a CPA.
Schools (NCES district)
- District
- Granbury ISD
- NCES district ID
- 4821390
- Math proficiency
- 46% ▬ 0.00%
- Reading proficiency
- 46% ▲ 4.00%
- Median HH income
- $55,856
- Composite
- 40.04/100
- National rank
- #3820
- State rank
- #237 of 826 in TX
Livability — Oak Trail Shores
- Score
- 58/100
- State rank
- #1187
- US rank
- #20758
Category grades
Schools grade is shown separately in the Schools card above.
Census & demographics
- Census place
- Oak Trail Shores, TX
- County
- Hood County · 58,506 people
- Metro
- Granbury, TX
- Population (ZIP)
- 27,000
- Household income
- $70,346
- Rent vs Own
- Severe rent burden
- 612.0
Population outlook (Hood County) Hauer SSP2
- Today (2025)
- 63,502 people
- By 2030
- 67,459 · +6.2%
- By 2040
- 74,958 · +18.0%
- By 2050
- 81,922 · +29.0%
- By 2075
- 98,872 · +55.7%
- By 2100
- 107,796 · +69.8%
Race, ethnicity, and origin ACS 2023
- Neighborhood character
- Predominantly White (80%)
- Race & ethnicity
- White 80% Hispanic / Latino 14% Two or more races 11% Black 1%
- Hispanic origin (detail)
- Mexican 13%
- Common ancestry
- Italian 2% Slovak 2% Portuguese 1%
- Foreign-born
- 4% · Canada
- Languages at home
- 89% English-only · Spanish 10%
Political lean MEDSL · Hood
- 2024 margin
- Solid R (+66.0) · D 16.6% · R 82.6%
- 2008→2024 swing
- -11.9pp toward R · 2008: -54.0pp · 2024: -66.0pp
- All cycles
- 2024: R+66.0 2020: R+64.1 2016: R+66.5 2012: R+64.7 2008: R+54.0
Not yet ingested
- Civics
- —
Market trends
- HPI YoY
- ▼ -83.25%
- Current HPI
- 272.2126
- Rent YoY
- ▲ 1.10%
- Metro
- Granbury, TX
- State GDP YoY
- ▲ 3.95%
- F500 in state
- 110
Industry mix (Fortune 500 HQ in TX)
| Industry | F500 HQs | Revenue |
|---|---|---|
| Energy | 16 | $1,198B |
|
||
| Technology | 5 | $198B |
|
||
| Engineering / Construction | 4 | $72B |
|
||
| Energy Services | 3 | $60B |
|
||
| Utilities | 3 | $41B |
|
||
| Healthcare | 2 | $330B |
|
||
Price history
+43.9% since first listed20 events — show timeline
- 2026-06-21 Pending — NTREIS
- 2026-05-22 Price Changed $115,000 NTREIS
- 2026-04-20 Listed $120,000 NTREIS
- 2020-02-29 Listing Removed — NTREIS
- 2020-02-03 Relisted — NTREIS
- 2020-01-02 Contingent — NTREIS
- 2019-11-07 Price Changed $92,750 NTREIS
- 2019-10-18 Price Changed $95,900 NTREIS
- 2019-09-27 Price Changed $97,500 NTREIS
- 2019-09-09 Price Changed $99,950 NTREIS
- 2019-09-02 Listed $99,995 NTREIS
- 2019-08-14 Sold (Public Records) — Public Records
- 2017-04-17 Listing Removed — NTREIS
- 2017-04-12 Price Changed $70,900 NTREIS
- 2017-03-28 Price Changed $74,900 NTREIS
- 2017-03-19 Listed $79,900 NTREIS
- 2016-04-07 Sold (Public Records) — Public Records
- 2013-09-23 Sold (Public Records) — Public Records
- 2001-10-25 Sold (Public Records) — Public Records
- 1975-12-04 Sold (Public Records) — Public Records
Property tax history
+5.7%/yrLatest (2025): $1,700 · +4.4% YoY. Source: county tax records.
Cash-flow waterfall
monthlySold comps — $/sqft
last 12 mo · ≤1 miLoading sold comps…