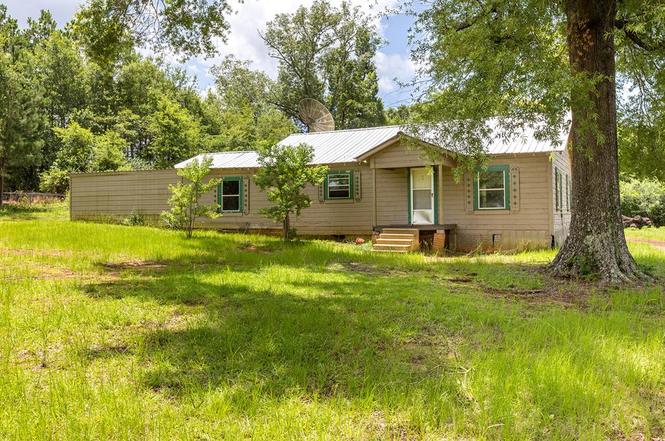
1346 Highway 21 E · San Augustine, TX
Flood risk 1/10 · Minimal
- FEMA flood zone
- X
- Chance of flooding over 30 yrs
- 0.0%
- Est. flood insurance / yr
- $507 – $1,088
Fire risk 5/10 · Moderate
- Est. fire insurance / yr
- $1,222 – $2,270
Heat risk 7/10 · Major
- Hot days now (above 110°F)
- 7 days/yr
- Hot days in 30 yrs
- 23 days/yr
Wind risk 8/10 · Major
- Chance of severe wind over 30 yrs
- 80.0%
Air-quality risk 1/10 · Minimal
- Unhealthy air days now
- 0 days/yr
- Unhealthy air days in 30 yrs
- 0 days/yr
Risk factors via First Street. Map © Google.
Why this score? — see what drove the B grade
The composite is a weighted blend of 9 inputs, each scored 0–100. Each bar is that input's sub-score; the figure is the points it added to the 100-point composite (weight × sub-score).
- Cash flow +30.0/30.0
- 1% rule +10.0/10.0
- DSCR +10.0/10.0
- ARV discount +7.5/15.0
- Appreciation +6.8/10.0
- Livability +3.4/5.0
- Rent growth +2.5/5.0
- Condition / age +2.2/5.0
- Schools +1.6/10.0
$55,500
🖨 Deal sheet 📄 Offer letter ✓ Due diligence
Listing remarks
NEW LISTING ALERT! Opportunity awaits on 1.64 acres just outside the city limits! If you've been searching for your next investment property or a home with potential, this could be the one. Bring your vision, creativity, and personal touch to breath new life into this home while enjoying the peace and privacy of country living. Conveniently close to town, schools and everyday amenities. The roof was replaced 2018. Whether you're looking to expand your investment portfolio or create a place to call home, this property offers endless possibilities! Always believe something wonderful is about to happen.
Key facts
- Close to town
- 1.64 acres
- Roof replaced 2018
Tags
Property features AI
Exterior
- Parking: Attached parking
- Utilities: Public water
- Home design: Single-family residential home; Located on 1.64-acre lot
- Construction: Wood siding construction
- Exterior features: Metal roof
Interior
- Flooring: Vinyl flooring
- Bathrooms: 1 full bathroom
- Heating & cooling: Electric heating
- Interior features: Walk-in closet(s)
Neighborhood map
What this means for you Summary
Snapshot
- This is a 2-bed/1.0-bath single-family listed at $56k. Condition is rated fair.
Deal economics
- At list price, monthly cash flow is $358 ($4k/yr) — positive.
- The deal already cash-flows at list — no discount required.
- Meets the 1% rule at list price ($939 rent vs $56k).
Location & tenants
- Location reads 67/100 on livability (#579 in TX) — a middle-class / working-renter tenant base. Strengths: cost of living A+, housing A+, health & safety A+; Watch: amenities F, commute F, employment F.
- San Augustine ISD (rural): math 16% / reading 23% proficiency, ranked #786 of 826 in TX (top 95%) — low school quality limits family demand, transient renter base, plan for 1-2y turnover; 83% free/reduced lunch — lower-income household profile, screen leases tightly.
- Zoned schools: San Augustine El (math 17% / reading 22%, grade F, #3,583 of 4,322 statewide, top 86%, 304 students, 90% FRL).
- Market conditions: 88 active listings in the ZIP; 2 units permitted in San Augustine County in 2024 (0 in 5+ unit buildings).
Forward outlook
- In year one you build about $2k of equity ($384 loan paydown + $2k appreciation (3.7% local appreciation)).
- San Augustine County population projected at -25% by 2050 — secular population decline; favor cash flow + early exit over multi-decade hold.
- At projected returns (3.7% appreciation + 3.0% rent growth), your $16k cash investment doubles in ~3 years — after that, you're playing with house money.
Negotiation context
- Only 1 days on market — expect competitive offers; lowballing is unlikely to land.
Risks & watch-outs
- Watch-outs: built in 1952 — expect roof / HVAC / electrical / plumbing capex.
- Climate carrying-cost: severe wind risk, 80% chance of damaging wind over 30y; moderate wildfire risk; extreme-heat days projected 7→23/yr by 2055 (HVAC capex compounding) — expect insurance premiums to compound above CPI over the hold.
Questions for the listing agent
- Have any recent inspections been done? Can we get a copy of the seller's disclosures and any deferred-maintenance estimates?
- Built in 1952 — when were the roof, HVAC, electrical panel, plumbing, and water heater last replaced?
- Is there a deadline driving the sale (1031 exchange, divorce, estate, relocation)? That informs how much negotiation room exists.
- Schools are F-rated, which usually means shorter tenancies and higher turnover. Who's the typical renter profile here, and what's been the actual vacancy rate?
- What's the average days-on-market for RENTAL listings here right now (not sales)? A rising rental-DOM trend means longer vacancies and softer asking-rent achievability than the comps imply.
- What's the recent tenant-quality profile in this submarket — average credit score on applications, eviction rate, late-payment / NSF rate, and stable-employment percentage? A property-management company in the area should have these aggregated.
- How much new for-sale + rental construction is in the pipeline within 1–3 miles? Heavy new supply typically softens prices + rents 12–24 months out; constrained supply supports both.
Investment metrics
- 1% rule
- 1.69% ✓
- Cap rate
- 14.03%
- Cash-on-cash
- 27.64%
- DSCR
- 2.23
- GRM
- 4.9
CMA / ARV
No comps found within radius.
Projected returns pro-forma
3.67% appreciation · 3.0% rent growth · sell at horizon
- IRR
- 34.8%
- Equity multiple
- 3.03×
- Total profit
- $31,474
- Equity at exit
- $27,061
- IRR
- 34.3%
- Equity multiple
- 6.00×
- Total profit
- $77,745
- Equity at exit
- $43,421
Cash invested: $15,540 (down + closing). Projections, not guarantees.
Landlord ↔ Tenant lean methodology
- Overall (STATE)
- 87 Strongly Landlord-Friendly
- State Texas
- 87 Strongly Landlord-Friendly · R+5
- County
- — inherits STATE
- City
- — inherits STATE
ZIP-level market 75972
- Home prices YoY
- 3.2%
- Active inventory
- 88
- Price-to-rent
- 4.9×
Monthly cashflow live
- Estimated rent
- $939 medium interval (Pro) →
- Mortgage (P&I)
- −$291
- Tax est. 1.5%
- −$69 /mo · $832/yr
- Insurance
- −$23
- HOA
- −$0
- Vacancy / Maint / Mgmt
- −$197
- Net cashflow
- $358
Break-even live
UW: 25.0% down · 7.5% · 30yr · 1.5% tax · 5.0% vac · 8.0% maint · 8.0% mgmt
Financing live
Cash to close
- Down payment
- $13,875
- Closing costs
- $1,665
- Reserves months
- —
- Total cash needed
- —
Loan-product check · same deal, 3 products live
Conventional
25% down · 7.5% · 30yr
- Down + closing
- —
- Monthly P&I
- —
- Monthly cashflow
- —
- DSCR
- —
- Eligible?
- —
Personal DTI + credit; lowest rate.
DSCR
20% down · 8.5% · 30yr
- Down + closing
- —
- Monthly P&I
- —
- Monthly cashflow
- —
- DSCR
- —
- Eligible?
- —
No personal income docs; deal must DSCR.
Hard money
10% down · 12.0% · 12mo
- Down + closing
- —
- Monthly P&I
- —
- Monthly cashflow
- —
- DSCR
- —
- Eligible?
- —
Short-term bridge; refi at stabilization.
Listing history 2 events
-
2026-06-18remarks 609-char remark
-
2026-06-18$55,500 Active 1 DOM
ⓘ Source: listings_history table (triggers on properties + properties_extension) + one-shot
backfill from property_details.listing_events for pre-trigger history.
Climate risk First Street
- Flood 1/10 Low FEMA zone X · 0% chance over 30 yrs
- Wildfire 5/10 Major
- Heat 7/10 Severe 7 d/yr ≥110°F today · 23 d/yr by 30 yrs out
- Wind 8/10 Severe 80% chance of damaging wind over 30 yrs
- Air quality 1/10 Low 0 unhealthy d/yr today · 0 by 30 yrs out
Nearby sold comps map
Loading sold comps map…
Walkable amenities ~0.75 mi
Loading nearby amenities…
Taxation est. · year 1
- Rental income
- $11,262
- − Mortgage interest
- −$3,109
- − Property taxes
- −$832
- − Insurance
- −$278
- − Repairs & maintenance
- −$901
- − Management
- −$901
- − Depreciation
- −$1,615
- Taxable income
- $3,627
- Est. tax owed @ 24.0%
- −$870
- After-tax cash flow
- $3,424/yr
For passive investors: Depreciation is non-cash, so a rental often shows a tax loss while cash-flowing — sheltering income. Rental losses are passive: they offset passive income freely, and up to $25,000/yr can offset ordinary (W-2) income if you actively participate and your MAGI is under $100k (phasing out to $0 by $150k); unused losses carry forward. On sale, claimed depreciation is recaptured at up to 25%, and gains may owe capital-gains tax (a 1031 exchange can defer both). Figures are a year-1 estimate at your 24.0% rate — not tax advice; consult a CPA.
Condition & rehab AI · 12 photos
This property offers a fair condition with moderate rehab needs, including exterior siding, interior walls, and kitchen cabinets. Fresh paint, new flooring, and updated cabinets can significantly enhance its resale and rental value.
Repairs flagged
- Moderate Exterior siding — Weathered and in need of replacement
- Moderate Interior walls — Peeling paint and potential structural issues
- Moderate Kitchen cabinets — Worn and in need of replacement
Value-add opportunities
- Resale Paint interior walls — Fresh paint enhances curb appeal and interior aesthetics
- Resale Replace flooring in living areas — New flooring improves the home's appearance and value
- Resale Replace kitchen cabinets — New cabinets improve functionality and aesthetics
- Both Landscaping and curb appeal — Landscaping enhances the home's curb appeal and rental value
Renovation cost estimate screening
| Repair item | Severity | Est. cost |
|---|---|---|
| Exterior siding · Weathered and in need of replacement | Moderate | $3,000–15,000 |
| Interior walls · Peeling paint and potential structural issues | Moderate | $3,000–15,000 |
| Kitchen cabinets · Worn and in need of replacement | Moderate | $3,000–15,000 |
| Total estimated repair cost · 3 items | $9,000–45,000 |
Value-add ROI direction
- Resale Paint interior walls — Fresh paint enhances curb appeal and interior aesthetics ↑
- Resale Replace flooring in living areas — New flooring improves the home's appearance and value ↑
- Resale Replace kitchen cabinets — New cabinets improve functionality and aesthetics ↑
- Both Landscaping and curb appeal — Landscaping enhances the home's curb appeal and rental value ↑
ⓘ Cost ranges are severity-bucket heuristics (US national rule-of-thumb). Get contractor quotes + a written scope before underwriting a rehab budget.
Schools (NCES district)
- District
- San Augustine ISD
- NCES district ID
- 4838760
- Math proficiency
- 16% ▼ -6.00%
- Reading proficiency
- 23% ▲ 1.00%
- Median HH income
- $30,460
- Composite
- 15.61/100
- National rank
- #9291
- State rank
- #786 of 826 in TX
Livability — San Augustine
- Score
- 67/100
- State rank
- #579
- US rank
- #11071
Category grades
Schools grade is shown separately in the Schools card above.
Census & demographics
- Population (ZIP)
- 5,896
Population outlook (San Augustine County) Hauer SSP2
- Today (2025)
- 7,544 people
- By 2030
- 7,094 · -6.0%
- By 2040
- 6,327 · -16.1%
- By 2050
- 5,645 · -25.2%
- By 2075
- 4,447 · -41.1%
- By 2100
- 3,299 · -56.3%
Race, ethnicity, and origin ACS 2023
- Neighborhood character
- Diverse neighborhood (Simpson 0.58)
- Race & ethnicity
- White 56% Black 30% Hispanic / Latino 11% Two or more races 4% Native American 1%
- Hispanic origin (detail)
- Mexican 11%
- Common ancestry
- Lithuanian 3% Serbian 3% Slovak 2%
- Foreign-born
- 5% · Canada
- Languages at home
- 92% English-only · Spanish 8%
Political lean MEDSL · San Augustine
- 2024 margin
- Solid R (+56.3) · D 21.6% · R 77.8%
- 2008→2024 swing
- -29.0pp toward R · 2008: -27.3pp · 2024: -56.3pp
- All cycles
- 2024: R+56.3 2020: R+50.6 2016: R+48.1 2012: R+34.6 2008: R+27.3
Not yet ingested
- Civics
- —
Market trends
- HPI YoY
- ▲ 3.67%
- Current HPI
- 116.5112
- Rent YoY
- —
- Metro
- —
- State GDP YoY
- ▲ 3.95%
- F500 in state
- 110
Industry mix (Fortune 500 HQ in TX)
| Industry | F500 HQs | Revenue |
|---|---|---|
| Energy | 16 | $1,198B |
|
||
| Technology | 5 | $198B |
|
||
| Engineering / Construction | 4 | $72B |
|
||
| Energy Services | 3 | $60B |
|
||
| Utilities | 3 | $41B |
|
||
| Healthcare | 2 | $330B |
|
||
Price history
1 event — show timeline
- 2026-06-18 Listed $55,500 Deep East Texas MLS
Cash-flow waterfall
monthlySold comps — $/sqft
last 12 mo · ≤1 miLoading sold comps…