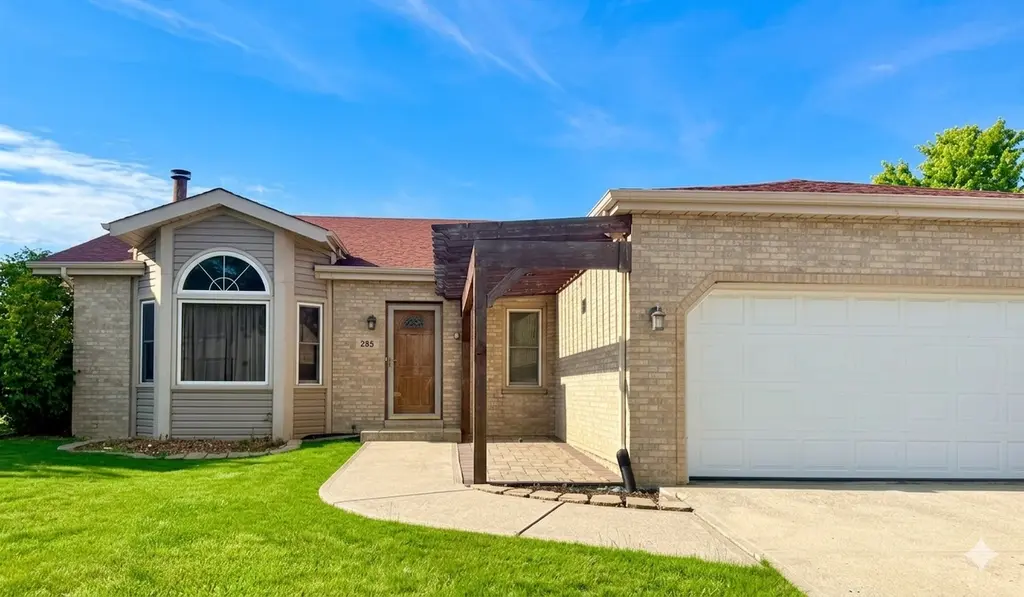
285 Green Mountain Dr · Bolingbrook, IL
Flood risk No data
- FEMA flood zone
- —
- Chance of flooding over 30 yrs
- —
- Est. flood insurance / yr
- —
Fire risk No data
- Est. fire insurance / yr
- —
Heat risk No data
- Hot days now (above threshold)
- —
- Hot days in 30 yrs
- —
Wind risk No data
- Chance of severe wind over 30 yrs
- —
Air-quality risk No data
- Unhealthy air days now
- —
- Unhealthy air days in 30 yrs
- —
Risk factors via First Street. Map © Google.
Why this score? — see what drove the D grade
The composite is a weighted blend of 9 inputs, each scored 0–100. Each bar is that input's sub-score; the figure is the points it added to the 100-point composite (weight × sub-score).
- Cash flow +13.6/30.0
- ARV discount +6.7/15.0
- DSCR +4.1/10.0
- 1% rule +3.8/10.0
- Livability +3.8/5.0
- Rent growth +3.5/5.0
- Condition / age +2.5/5.0
- Schools +2.3/10.0
- Appreciation +0.0/10.0
$339,000
🖨 Deal sheet 📄 Offer letter ✓ Due diligence
Listing remarks
Incredible Opportunity & Great Bones. Bring your decorating ideas and unlock the massive potential of this spacious 4-bedroom, 2-full-bath split-level home with Sub-basement! Built in 1991 and offering over 1,700 square feet of living space, this solid home is the perfect canvas for your personal touch. Key Features You'll Love: Sun-Drenched Living: Vaulted ceilings create an airy, expansive feel the moment you step inside. Eat-In Kitchen: Features classic hardwood flooring and plenty of space for casual dining. Massive Family Room: The perfect gathering space, complete with a cozy fireplace and sliding glass doors that lead directly to the outdoors. Outdoor & Storage Space: A
Key facts
- 7,590 sq ft lot
- 2 garage spots
- Built 1991
Property features AI
Finance
- HOA & community: No master association fee required; Community features include curbs, sidewalks, street lights, and paved streets
Exterior
- Parking: Attached garage (2 spaces) with concrete surface and garage door opener
- Utilities: Public water; Public sewer; Electric service (standard)
- Home design: Detached single-family home; Split-level with sub-level; Fee simple ownership; 31–40 years old; School bus service available
- Construction: Vinyl siding and brick exterior; Asphalt roof; Concrete perimeter foundation
- Exterior features: Deck; Lot dimensions approximately 69 x 110
Interior
- Kitchen: Eating area/table space; Range; Microwave; Dishwasher; Refrigerator; Hardwood flooring in kitchen
- Bedrooms: 4 bedrooms; Master bedroom on second level (15 x 11, carpet); Bedroom on second level (11 x 10, carpet); Bedroom on main level (14 x 11, carpet); Bedroom on lower level (14 x 8, carpet)
- Flooring: Carpet in most living areas and bedrooms; Hardwood in kitchen
- Bathrooms: 2 full bathrooms
- Heating & cooling: Natural gas heating; Central air conditioning
- Interior features: 7 total rooms; Unfinished partial basement; 1 fireplace with gas starter (located in family room)
- Laundry & utility: Dedicated laundry room
Neighborhood map
What this means for you Summary
Snapshot
- This is a 4-bed/2.0-bath single-family listed at $339k.
Deal economics
- At list price, monthly cash flow is $19 ($225/yr) — positive.
- The deal already cash-flows at list — no discount required.
- To meet the 1% rule (rent ≥ 1% of price), the offer needs to be $299k (11.8% below list).
- Recommended offer: $299k (11.8% below list) — sets the bar for 1% rule.
- Cap rate 6.4% vs local median 4.8% in Bolingbrook — top-decile yield for the area; either an underpriced asset or a hidden risk that comps aren't pricing in. Stress-test before assuming the spread holds.
Location & tenants
- Location reads 76/100 on livability (#199 in IL, #3,692 nationally) — a middle-class / working-renter tenant base. Strengths: employment A+, housing A+, crime A; Watch: amenities F, health & safety F.
- Valley View CUSD 365U (suburban): math 21% / reading 28% proficiency, ranked #289 of 620 in IL (top 47%) — low school quality limits family demand, transient renter base, plan for 1-2y turnover.
- Zoned schools: John R Tibbott Elem School (math 17% / reading 17%, grade F, #1,141 of 2,056 statewide, top 59%, 344 students, 0% FRL); Hubert H Humphrey Middle School (math 14% / reading 23%, grade F, #438 of 665 statewide, top 67%, 690 students, 0% FRL); Bolingbrook High School (math 23% / reading 29%, grade F, #244 of 693 statewide, top 35%, 3,405 students, 0% FRL) — zoned schools average 0% FRL vs 51% district-wide (51 pts lower); this property's tenant base skews higher-income than the district average.
- Market conditions: Rents rising fast (+4.1%/yr); 68 active listings in the ZIP; 7 comparable units currently listed for rent nearby; rentals leasing fast (median 8d on market — plan ~1-2 weeks tenant-placement turnaround); solid renter incomes; 2,028 units permitted in Will County in 2024 (530 in 5+ unit buildings).
- This rent runs 38% of the median local income ($93k/yr) — at the standard rent-burdened threshold; future hikes will face affordability resistance.
Forward outlook
- Local home prices are declining (-3.0%/yr); year-one equity from $2k of loan paydown is wiped out by about $10k of value loss. Plan a longer hold.
- Will County population projected to shrink 4% by 2050 — rents likely to lag national; underwrite the cash flow, not the appreciation.
Negotiation context
- Only 13 days on market — expect competitive offers; lowballing is unlikely to land.
Questions for the listing agent
- Is there a deadline driving the sale (1031 exchange, divorce, estate, relocation)? That informs how much negotiation room exists.
- Schools are D-rated, which usually means shorter tenancies and higher turnover. Who's the typical renter profile here, and what's been the actual vacancy rate?
- The area grade is low — what's the realistic commute time and amenity access for the typical tenant pool here? Any planned neighborhood developments (good or bad) we should know about?
- What's the average days-on-market for RENTAL listings here right now (not sales)? A rising rental-DOM trend means longer vacancies and softer asking-rent achievability than the comps imply.
- What's the recent tenant-quality profile in this submarket — average credit score on applications, eviction rate, late-payment / NSF rate, and stable-employment percentage? A property-management company in the area should have these aggregated.
- How much new for-sale + rental construction is in the pipeline within 1–3 miles? Heavy new supply typically softens prices + rents 12–24 months out; constrained supply supports both.
Investment metrics
- 1% rule
- 0.88% ✗
- Cap rate
- 6.36%
- Cash-on-cash
- 0.24%
- DSCR
- 1.01
- GRM
- 9.5
CMA / ARV
- ARV (on-the-fly)
- $333,060
- Comps found
- 12
Show comp detail 12 sales within ~0.75 mi
| Address | Dist | Beds/Ba | Sqft | Sold | Price | $/sf | Match |
|---|---|---|---|---|---|---|---|
| 312 Homestead Dr | 0.10mi | 3/2.5 (-1) | 1,550 (-9%) | 1mo | $387,000 | $250 | 72 |
| 304 N Janes Ave | 0.12mi | 3/2.0 (-1) | 1,604 (-6%) | 10mo | $363,000 | $226 | 71 |
| 320 Homestead Dr | 0.12mi | 3/2.0 (-1) | 1,546 (-10%) | 3mo | $351,000 | $227 | 71 |
| 612 Melissa Dr | 0.37mi | 4/2.0 | 1,785 (+4%) | 6mo | $390,000 | $218 | 70 |
| 357 Sword Way | 0.48mi | 3/2.0 (-1) | 1,726 (+1%) | 9mo | $365,000 | $211 | 63 |
| 235 Capitol Dr | 0.36mi | 3/2.0 (-1) | 1,609 (-6%) | 8mo | $310,000 | $193 | 61 |
| 547 Redwood Rd | 0.52mi | 4/2.0 | 1,862 (+9%) | 2mo | $230,000 | $124 | 59 |
| 536 E Briarcliff Rd | 0.59mi | 4/2.5 | 1,776 (+4%) | 9mo | $250,000 | $141 | 57 |
| 473 Rockhurst Rd | 0.68mi | 4/2.5 | 1,792 (+5%) | 3mo | $350,000 | $195 | 56 |
| 132 N Pinecrest Rd | 0.66mi | 4/2.5 | 1,560 (-9%) | 1mo | $245,000 | $157 | 52 |
| 551 Falconridge Way | 0.64mi | 4/2.0 | 1,950 (+14%) | 0mo | $332,000 | $170 | 46 |
| 461 Rockhurst Rd | 0.72mi | 5/2.0 (+1) | 1,850 (+8%) | 5mo | $357,000 | $193 | 44 |
Match score weights: distance 35% · size 25% · config 20% · recency 20%. Top-matched comps best support the ARV.
Projected returns pro-forma
-3.0% appreciation · 4.1% rent growth · sell at horizon
- IRR
- -14.7%
- Equity multiple
- 0.47×
- Total profit
- $-50,347
- Equity at exit
- $50,546
- IRR
- -4.3%
- Equity multiple
- 0.70×
- Total profit
- $-28,084
- Equity at exit
- $29,311
Cash invested: $94,920 (down + closing). Projections, not guarantees.
Landlord ↔ Tenant lean methodology
- Overall (STATE)
- 43 Moderately Tenant-Leaning
- State Illinois
- 43 Moderately Tenant-Leaning · D+7
- County
- — inherits STATE
- City
- — inherits STATE
ZIP-level market 60440
- Rents YoY
- 4.1%
- Active inventory
- 68
- Price-to-rent
- 9.5×
Monthly cashflow live
- Estimated rent
- $2,989 high interval (Pro) →
- Mortgage (P&I)
- −$1,778
- Tax est. 1.5%
- −$424 /mo · $5,085/yr
- Insurance
- −$141
- HOA
- −$0
- Vacancy / Maint / Mgmt
- −$628
- Net cashflow
- $19
Break-even live
UW: 25.0% down · 7.5% · 30yr · 1.5% tax · 5.0% vac · 8.0% maint · 8.0% mgmt
Financing live
Cash to close
- Down payment
- $84,750
- Closing costs
- $10,170
- Reserves months
- —
- Total cash needed
- —
Loan-product check · same deal, 3 products live
Conventional
25% down · 7.5% · 30yr
- Down + closing
- —
- Monthly P&I
- —
- Monthly cashflow
- —
- DSCR
- —
- Eligible?
- —
Personal DTI + credit; lowest rate.
DSCR
20% down · 8.5% · 30yr
- Down + closing
- —
- Monthly P&I
- —
- Monthly cashflow
- —
- DSCR
- —
- Eligible?
- —
No personal income docs; deal must DSCR.
Hard money
10% down · 12.0% · 12mo
- Down + closing
- —
- Monthly P&I
- —
- Monthly cashflow
- —
- DSCR
- —
- Eligible?
- —
Short-term bridge; refi at stabilization.
Rent comps 7 comps
| Address | Beds | Baths | Sqft | Rent | $/sqft | DOM | Units | Dist |
|---|---|---|---|---|---|---|---|---|
| 668 Niagara Dr Bolingbrook, IL | 3.0 | 2.5 | 1402 | $2,695 | $1.92 | 43d | 1 | 0.23mi |
| 651 Chesapeake Dr Bolingbrook, IL | 3.0 | 2.0 | 1800 | $2,700 | $1.50 | 17d | 1 | 0.29mi |
| 254 Thornhurst Rd Bolingbrook, IL | 3.0 | 2.5 | 1600 | $2,600 | $1.62 | 1d | 1 | 0.59mi |
| 601 Preston Dr Bolingbrook, IL | 3.0 | 1.0–2.0 | 980 | $2,250 | $2.30 | 7d | 1 | 0.94mi |
| 160 Camelot Way Bolingbrook, IL | 4.0 | 2.5 | 2002 | $2,950 | $1.47 | 24d | 1 | 1.43mi |
| 216 Ironbark Way Bolingbrook, IL | 5.0 | 2.5 | 1954 | $3,500 | $1.79 | 2d | 1 | 1.45mi |
| 2 Willow Ct Bolingbrook, IL | 4.0 | 2.0 | 1800 | $3,300 | $1.83 | 1d | 1 | 1.50mi |
Listing history 5 events
-
2026-06-17days on market $339,000 Coming Soon 13 DOM
-
2026-06-09days on market $339,000 Coming Soon 5 DOM
-
2026-06-08days on market $339,000 Coming Soon 4 DOM
-
2026-06-07remarks 691-char remark
-
2026-06-07$339,000 Coming Soon 3 DOM
ⓘ Source: listings_history table (triggers on properties + properties_extension) + one-shot
backfill from property_details.listing_events for pre-trigger history.
Nearby sold comps map
Loading sold comps map…
Walkable amenities ~0.75 mi
Loading nearby amenities…
Taxation est. · year 1
- Rental income
- $35,871
- − Mortgage interest
- −$18,989
- − Property taxes
- −$5,085
- − Insurance
- −$1,695
- − Repairs & maintenance
- −$2,870
- − Management
- −$2,870
- − Depreciation
- −$9,862
- Taxable loss
- −$5,499
- Est. tax savings @ 24.0%
- +$1,320
- After-tax cash flow
- $1,545/yr
For passive investors: Depreciation is non-cash, so a rental often shows a tax loss while cash-flowing — sheltering income. Rental losses are passive: they offset passive income freely, and up to $25,000/yr can offset ordinary (W-2) income if you actively participate and your MAGI is under $100k (phasing out to $0 by $150k); unused losses carry forward. On sale, claimed depreciation is recaptured at up to 25%, and gains may owe capital-gains tax (a 1031 exchange can defer both). Figures are a year-1 estimate at your 24.0% rate — not tax advice; consult a CPA.
Schools (NCES district)
- District
- Valley View CUSD 365U
- NCES district ID
- 1740070
- Math proficiency
- 21% ▼ -15.00%
- Reading proficiency
- 28% ▼ -10.00%
- Median HH income
- $69,424
- Composite
- 23.48/100
- National rank
- #7875
- State rank
- #289 of 620 in IL
Livability — Bolingbrook
- Score
- 76/100
- State rank
- #199
- US rank
- #3692
Category grades
Schools grade is shown separately in the Schools card above.
Census & demographics
- Census place
- Bolingbrook, IL
- County
- Will County · 412,448 people
- City population
- 74,096
- Metro
- Chicago-Naperville-Elgin, IL-IN-WI
- Population (ZIP)
- 51,940
- Household income
- $93,494
- Rent vs Own
- Severe rent burden
- 1149.0
Population outlook (Will County) Hauer SSP2
- Today (2025)
- 705,368 people
- By 2030
- 708,154 · +0.4%
- By 2040
- 702,692 · -0.4%
- By 2050
- 680,249 · -3.6%
- By 2075
- 611,990 · -13.2%
- By 2100
- 516,215 · -26.8%
Race, ethnicity, and origin ACS 2023
- Neighborhood character
- Highly diverse neighborhood (Simpson 0.72)
- Race & ethnicity
- White 36% Hispanic / Latino 33% Black 19% Two or more races 15% Asian 10%
- Hispanic origin (detail)
- Mexican 30%
- Common ancestry
- Romanian 7% Lithuanian 1% Italian 1%
- Foreign-born
- 23% · Canada, China, South Korea
- Languages at home
- 62% English-only · Spanish 26% Other Indo-European 5% Tagalog/Filipino 2%
Political lean MEDSL · Will
- 2024 margin
- Toss-up / Even · D 50.1% · R 48.5% · Other 1.4%
- 2008→2024 swing
- -11.6pp toward R · 2008: 13.2pp · 2024: 1.6pp
- All cycles
- 2024: D+1.6 2020: D+8.3 2016: D+5.7 2012: D+3.7 2008: D+13.2
Not yet ingested
- Civics
- —
Market trends
- HPI YoY
- ▼ -256.14%
- Current HPI
- 246.1906
- Rent YoY
- ▲ 4.10%
- Metro
- Chicago-Naperville-Elgin, IL-IN-WI
- State GDP YoY
- ▲ 1.59%
- F500 in state
- 60
Industry mix (Fortune 500 HQ in IL)
| Industry | F500 HQs | Revenue |
|---|---|---|
| Insurance | 4 | $201B |
|
||
| Consumer Goods | 4 | $87B |
|
||
| Industrial Machinery | 3 | $64B |
|
||
| Healthcare | 2 | $55B |
|
||
| Retail / Pharmacy | 1 | $148B |
|
||
| Agriculture / Food | 1 | $86B |
|
||
Cash-flow waterfall
monthlySold comps — $/sqft
last 12 mo · ≤1 miLoading sold comps…