 Duplex
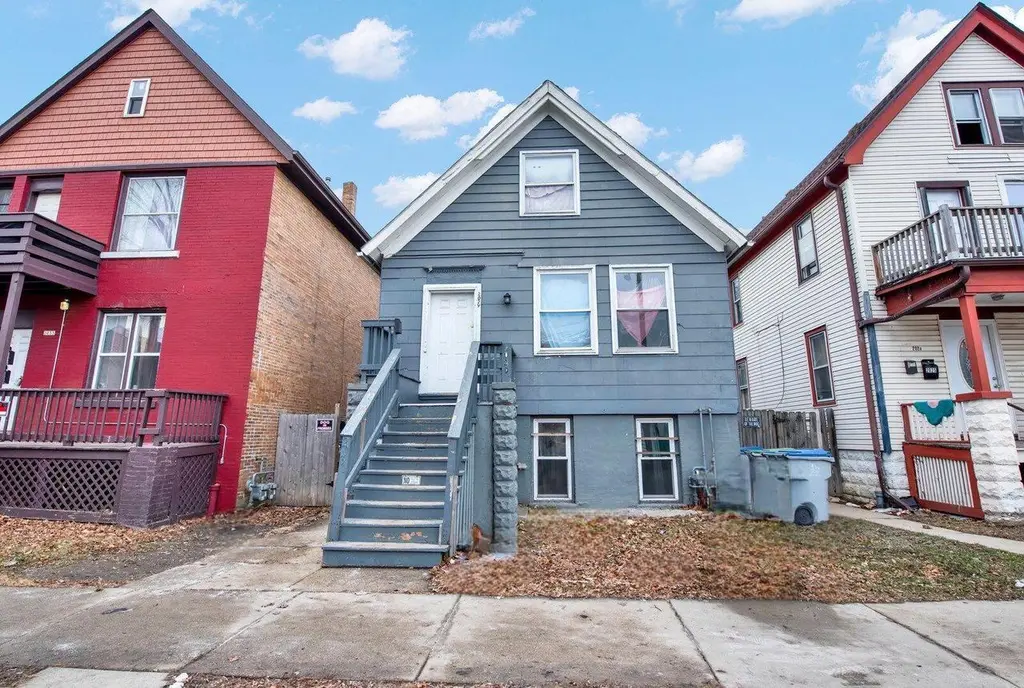
2029 S 16th St #2031 · Milwaukee, WI
Flood risk 1/10 · Minimal
- FEMA flood zone
- X (unshaded)
- Chance of flooding over 30 yrs
- 0.0%
- Est. flood insurance / yr
- $473 – $860
Fire risk 1/10 · Minimal
- Est. fire insurance / yr
- $636 – $1,182
Heat risk 2/10 · Minimal
- Hot days now (above 97°F)
- 7 days/yr
- Hot days in 30 yrs
- 13 days/yr
Wind risk 2/10 · Minimal
- Chance of severe wind over 30 yrs
- —
Air-quality risk 3/10 · Minor
- Unhealthy air days now
- 3 days/yr
- Unhealthy air days in 30 yrs
- 3 days/yr
Risk factors via First Street. Map © Google.
Why this score? — see what drove the A- grade
The composite is a weighted blend of 9 inputs, each scored 0–100. Each bar is that input's sub-score; the figure is the points it added to the 100-point composite (weight × sub-score).
- Cash flow +30.0/30.0
- ARV discount +11.6/15.0
- 1% rule +10.0/10.0
- DSCR +10.0/10.0
- Appreciation +10.0/10.0
- Livability +4.0/5.0
- Rent growth +3.0/5.0
- Condition / age +2.2/5.0
- Schools +1.2/10.0
$150,000
🖨 Deal sheet 📄 Offer letter ✓ Due diligence
Multi-family units
County records classify this as Multi-Family (2-4 Unit). Listing-text estimate: 2 units. confirmed
Listing remarks MLS
Prime investment opportunity located in Milwaukee's Muskego Way neighborhood on the south side. This 2-family duplex features a spacious 3-bedroom lower unit & a 2-bedroom upper unit w/ an additional flex room that can function as a third bedroom or office. Both units include washer & dryer hookups. The lower unit is currently rented at $1,175/month, while the upper unit was previously rented at $1,400/month. Upper Furnace replaced in 2025. Ideal for investors or owner-occupants seeking cash flow in a high-demand rental area.
Key facts
- 2 family duplex
- Washer dryer hookups
- Flex room
Tags
Neighborhood map
What this means for you Summary
Snapshot
- This is a 2 × 2-bed/1.0-bath units multifamily listed at $150k. Condition is rated fair.
Deal economics
- At list price, monthly cash flow is $763 ($9k/yr) — positive. Per door: $382/mo.
- The deal already cash-flows at list — no discount required.
- Meets the 1% rule at list price ($2k rent vs $150k).
- Recommended offer: $136k (9.0% below list) — sets the bar for market timing.
- Cap rate 12.4% vs local median 5.1% in Milwaukee — top-decile yield for the area; either an underpriced asset or a hidden risk that comps aren't pricing in. Stress-test before assuming the spread holds.
Location & tenants
- Location reads 81/100 on livability (#55 in WI, #1,534 nationally) — a professional / high-income tenant draw. Strengths: amenities A+, commute A+, cost of living A+; Watch: employment D+, schools F, crime F.
- Milwaukee School District (urban): math 10% / reading 18% proficiency, ranked #337 of 342 in WI (top 98%) — low school quality limits family demand, transient renter base, plan for 1-2y turnover; 77% free/reduced lunch — lower-income household profile, screen leases tightly.
- Market conditions: Rents rising (+2.0%/yr); 55 active listings in the ZIP; 2 comparable units currently listed for rent nearby; 1,017 units permitted in Milwaukee County in 2024 (803 in 5+ unit buildings).
- At $2,278/mo this rent would consume 60% of the median local household income ($46k/yr) (locally 2357% of renters already pay >50% of income on rent) — very limited rent-growth headroom before tenants either downsize or default.
Forward outlook
- In year one you build about $16k of equity ($1k loan paydown + $15k appreciation (10.0% local appreciation)).
- Milwaukee County population projected at +4% by 2050 — modest demand growth; plan on rents tracking national, not racing it.
- At projected returns (10.0% appreciation + 2.0% rent growth), your $42k cash investment doubles in ~2 years — after that, you're playing with house money.
- By year 3, paydown + projected appreciation supports a ~$41k cash-out refi (75% LTV) — recoverable capital for the next deal without selling this one.
Negotiation context
- It's been on market 110 days — a 9% lower offer ($136k) is reasonable based on typical stale-listing flexibility.
- Current owner paid $70k; list at $150k implies a 114% gain — meaningful room to come down on a strong offer.
Risks & watch-outs
- Watch-outs: built in 1898 — expect roof / HVAC / electrical / plumbing capex.
Questions for the listing agent
- It's been on market 110 days. Have you received any prior offers? Is the seller open to a 9% concession, seller financing, or rate buy-down credit?
- Can we see the unit-by-unit rent roll, current vacancy, and any below-market leases? What's the average tenancy length?
- What capital expenditures (roof, boiler, parking lot, exteriors) have been made in the last 5 years, and what's planned in the next 2?
- Have any recent inspections been done? Can we get a copy of the seller's disclosures and any deferred-maintenance estimates?
- Built in 1898 — when were the roof, HVAC, electrical panel, plumbing, and water heater last replaced?
- Why hasn't it sold? Are there any deal-killer items the seller is aware of (foundation, flood, title, zoning, code violations)?
- Is there a deadline driving the sale (1031 exchange, divorce, estate, relocation)? That informs how much negotiation room exists.
- Schools are F-rated, which usually means shorter tenancies and higher turnover. Who's the typical renter profile here, and what's been the actual vacancy rate?
- Crime grade is F in this area — have there been break-ins, vandalism, or insurance claims at this property in the last 3 years? What carrier currently insures it and at what premium?
- What's the average days-on-market for RENTAL listings here right now (not sales)? A rising rental-DOM trend means longer vacancies and softer asking-rent achievability than the comps imply.
- What's the recent tenant-quality profile in this submarket — average credit score on applications, eviction rate, late-payment / NSF rate, and stable-employment percentage? A property-management company in the area should have these aggregated.
- How much new apartment / multifamily construction is in the pipeline within 1–3 miles? Heavy new supply (>2% of stock underway) typically softens rents 12–24 months out; light construction supports rent growth.
Investment metrics
- 1% rule
- 1.52% ✓
- Cap rate
- 12.40%
- Cash-on-cash
- 21.80%
- DSCR
- 1.97
- GRM
- 5.5
CMA / ARV
- ARV (median comp)
- $165,048
- List price
- $150,000
- Delta
- -9.12%
- Verdict
- FAIR
- Comps
- 20 within 1.0 mi
Show comp detail 12 sales within ~0.75 mi
| Address | Dist | Beds/Ba | Sqft | Sold | Price | $/sf | Match |
|---|---|---|---|---|---|---|---|
| 2111 W Burnham St Unit 2111A | 0.33mi | 4/2.0 | 1,977 (+3%) | 0mo | $194,000 | $98 | 79 |
| 2119 S 14th St | 0.21mi | 5/2.0 (+1) | 1,968 (+3%) | 3mo | $220,000 | $112 | 78 |
| 2239 S 11th St | 0.46mi | 4/2.0 | 1,920 (+0%) | 4mo | $260,000 | $135 | 75 |
| 1600 S Muskego Ave | 0.45mi | 5/2.0 (+1) | 1,910 (-0%) | 3mo | $140,140 | $73 | 71 |
| 2133 S 20th St | 0.28mi | 4/2.0 | 1,754 (-8%) | 3mo | $130,000 | $74 | 70 |
| 2411 S 12th St | 0.55mi | 4/2.0 | 1,916 (0%) | 5mo | $125,000 | $65 | 70 |
| 1571 S 14th St | 0.51mi | 4/2.0 | 1,830 (-4%) | 0mo | $155,000 | $85 | 69 |
| 2322 S 15th Pl | 0.37mi | 5/2.0 (+1) | 1,694 (-12%) | 4mo | $265,000 | $156 | 55 |
| 1423 S Comstock Ave | 0.64mi | 5/2.0 (+1) | 1,731 (-10%) | 3mo | $148,148 | $86 | 47 |
| 2053 S 25th St | 0.61mi | 5/3.0 (+1) | 2,095 (+9%) | 1mo | $300,000 | $143 | 46 |
| 2415 S 9th St Unit 2415A | 0.72mi | 5/2.0 (+1) | 2,124 (+11%) | 0mo | $190,000 | $89 | 43 |
| 1300 W Greenfield Ave | 0.71mi | 5/2.0 (+1) | 1,692 (-12%) | 3mo | $155,000 | $92 | 40 |
Match score weights: distance 35% · size 25% · config 20% · recency 20%. Top-matched comps best support the ARV.
Projected returns pro-forma
10.0% appreciation · 2.0% rent growth · sell at horizon
- IRR
- 40.1%
- Equity multiple
- 4.05×
- Total profit
- $128,055
- Equity at exit
- $135,132
- IRR
- 34.2%
- Equity multiple
- 8.97×
- Total profit
- $334,533
- Equity at exit
- $291,417
Cash invested: $42,000 (down + closing). Projections, not guarantees.
Landlord ↔ Tenant lean methodology
- Overall (STATE)
- 73 Landlord-Friendly
- State Wisconsin
- 73 Landlord-Friendly · R+2
- County
- — inherits STATE
- City
- — inherits STATE
ZIP-level market 53204
- Home prices YoY
- 19.0%
- Rents YoY
- 2.0%
- Active inventory
- 55
- Price-to-rent
- 11.0×
Monthly cashflow live
- Estimated rent
- $2,278 high interval (Pro) →
- Mortgage (P&I)
- −$787
- Tax est. 1.5%
- −$188 /mo · $2,250/yr
- Insurance
- −$62
- HOA
- −$0
- Vacancy / Maint / Mgmt
- −$478
- Net cashflow
- $763
Break-even live
2-unit breakdown (identical units grouped — click to expand)
| Units | Beds | Baths | Est. rent |
|---|---|---|---|
| 2× units | 2 | 1 | $2,278 |
| #1 | 2 | 1 | $1,139 |
| #2 | 2 | 1 | $1,139 |
| Total (2 units) | $2,278 | ||
UW: 25.0% down · 7.5% · 30yr · 1.5% tax · 5.0% vac · 8.0% maint · 8.0% mgmt
Financing live
Cash to close
- Down payment
- $37,500
- Closing costs
- $4,500
- Reserves months
- —
- Total cash needed
- —
Loan-product check · same deal, 3 products live
Conventional
25% down · 7.5% · 30yr
- Down + closing
- —
- Monthly P&I
- —
- Monthly cashflow
- —
- DSCR
- —
- Eligible?
- —
Personal DTI + credit; lowest rate.
DSCR
20% down · 8.5% · 30yr
- Down + closing
- —
- Monthly P&I
- —
- Monthly cashflow
- —
- DSCR
- —
- Eligible?
- —
No personal income docs; deal must DSCR.
Hard money
10% down · 12.0% · 12mo
- Down + closing
- —
- Monthly P&I
- —
- Monthly cashflow
- —
- DSCR
- —
- Eligible?
- —
Short-term bridge; refi at stabilization.
Rent comps 2 comps
| Address | Beds | Baths | Sqft | Rent | $/sqft | DOM | Units | Dist |
|---|---|---|---|---|---|---|---|---|
| 1812 S 7th St Milwaukee, WI | 3.0 | 1.5 | 1703 | $2,100 | $1.23 | 24d | 1 | 0.70mi |
| 2141 S Robinson Ave Milwaukee, WI | 3.0 | 1.0–2.0 | 1006 | $2,695 | $2.68 | 2d | 20 | 1.30mi |
Listing history 18 events
-
2026-06-18days on market $150,000 Active 110 DOM
-
2026-06-17days on market $150,000 Active 109 DOM
-
2026-06-16days on market $150,000 Active 108 DOM
-
2026-06-15days on market $150,000 Active 107 DOM
-
2026-06-13days on market $150,000 Active 105 DOM
-
2026-06-13pricedays on market $150,000 Active 104 DOM
-
2026-06-09days on market $165,999 Active 101 DOM
-
2026-06-08days on market $165,999 Active 100 DOM
-
2026-06-07days on market $165,999 Active 99 DOM
-
2026-06-05days on market $165,999 Active 96 DOM
-
2026-06-03days on market $165,999 Active 95 DOM
-
2026-06-02days on market $165,999 Active 94 DOM
-
2026-06-01days on market $165,999 Active 93 DOM
-
2026-05-31days on market $165,999 Active 92 DOM
-
2026-05-05price $165,999 543-char remark
Show marketing remark (543 chars)
Prime investment opportunity located in Milwaukee's Muskego Way neighborhood on the south side. This 2-family duplex features a spacious 3-bedroom lower unit & a 2-bedroom upper unit w/ an additional flex room that can function as a third bedroom or office. Both units include washer & dryer hookups. The lower unit is currently rented at $1,175/month, while the upper unit was previously rented at $1,400/month. Upper Furnace replaced in 2025. Ideal for investors or owner-occupants seeking cash flow in a high-demand rental area.
-
2026-03-28price $171,000 543-char remark
Show marketing remark (543 chars)
Prime investment opportunity located in Milwaukee's Muskego Way neighborhood on the south side. This 2-family duplex features a spacious 3-bedroom lower unit & a 2-bedroom upper unit w/ an additional flex room that can function as a third bedroom or office. Both units include washer & dryer hookups. The lower unit is currently rented at $1,175/month, while the upper unit was previously rented at $1,400/month. Upper Furnace replaced in 2025. Ideal for investors or owner-occupants seeking cash flow in a high-demand rental area.
-
2026-02-28$181,000 Active 543-char remark
Show marketing remark (543 chars)
Prime investment opportunity located in Milwaukee's Muskego Way neighborhood on the south side. This 2-family duplex features a spacious 3-bedroom lower unit & a 2-bedroom upper unit w/ an additional flex room that can function as a third bedroom or office. Both units include washer & dryer hookups. The lower unit is currently rented at $1,175/month, while the upper unit was previously rented at $1,400/month. Upper Furnace replaced in 2025. Ideal for investors or owner-occupants seeking cash flow in a high-demand rental area.
-
2007-10-16soldstatus $70,000 391-char remark
Show marketing remark (391 chars)
2 family. Great Price! Investors; buy now or Seller keeps this CASH COW! Separate utilities. Private laundry areas. 100 AMP circuit breakers each unit. Gas forced air furnaces. Immediate occupancy in lower. The upper unit is now rented cheap at $500.00/month. Fenced back yard area. No alley behind the home. Private front and back entrances. Priced for a quick sale. Better hurry. Call now.
ⓘ Source: listings_history table (triggers on properties + properties_extension) + one-shot
backfill from property_details.listing_events for pre-trigger history.
Climate risk First Street
- Flood 1/10 Low FEMA zone X (unshaded) · 0% chance over 30 yrs
- Wildfire 1/10 Low
- Heat 2/10 Low 7 d/yr ≥97°F today · 13 d/yr by 30 yrs out
- Wind 2/10 Low
- Air quality 3/10 Moderate 3 unhealthy d/yr today · 3 by 30 yrs out
Nearby sold comps map
Loading sold comps map…
Walkable amenities ~0.75 mi
Loading nearby amenities…
Taxation est. · year 1
- Rental income
- $27,336
- − Mortgage interest
- −$8,402
- − Property taxes
- −$2,250
- − Insurance
- −$750
- − Repairs & maintenance
- −$2,187
- − Management
- −$2,187
- − Depreciation
- −$4,364
- Taxable income
- $7,196
- Est. tax owed @ 24.0%
- −$1,727
- After-tax cash flow
- $7,429/yr
For passive investors: Depreciation is non-cash, so a rental often shows a tax loss while cash-flowing — sheltering income. Rental losses are passive: they offset passive income freely, and up to $25,000/yr can offset ordinary (W-2) income if you actively participate and your MAGI is under $100k (phasing out to $0 by $150k); unused losses carry forward. On sale, claimed depreciation is recaptured at up to 25%, and gains may owe capital-gains tax (a 1031 exchange can defer both). Figures are a year-1 estimate at your 24.0% rate — not tax advice; consult a CPA.
Condition & rehab AI · 7 photos
This 2-family home requires moderate repairs and maintenance to improve its condition and value. Exterior siding and interior walls need significant attention, while flooring is in poor condition. Painting and repairing these areas would significantly enhance its curb appeal and rental value.
Repairs flagged
- Major exterior siding — Severe weathering and peeling
- Major interior walls — Visible wear and tear
- Major flooring — Worn-out carpet
Value-add opportunities
- Both paint exterior — Enhances curb appeal and value
- Both repair flooring — Improves living space and rental appeal
- Both paint interior walls — Enhances interior aesthetics and rental appeal
Renovation cost estimate screening
| Repair item | Severity | Est. cost |
|---|---|---|
| exterior siding · Severe weathering and peeling | Major | $15,000–50,000 |
| interior walls · Visible wear and tear | Major | $15,000–50,000 |
| flooring · Worn-out carpet | Major | $15,000–50,000 |
| Total estimated repair cost · 3 items | $45,000–150,000 |
Value-add ROI direction
- Both paint exterior — Enhances curb appeal and value ↑
- Both repair flooring — Improves living space and rental appeal ↑
- Both paint interior walls — Enhances interior aesthetics and rental appeal ↑
ⓘ Cost ranges are severity-bucket heuristics (US national rule-of-thumb). Get contractor quotes + a written scope before underwriting a rehab budget.
Schools (NCES district)
- District
- Milwaukee School District
- NCES district ID
- 5509600
- Math proficiency
- 10% ▼ -5.00%
- Reading proficiency
- 18% ▬ 0.00%
- Median HH income
- $36,339
- Composite
- 11.61/100
- National rank
- #9696
- State rank
- #337 of 342 in WI
Livability — Milwaukee
- Score
- 81/100
- State rank
- #55
- US rank
- #1534
Category grades
Schools grade is shown separately in the Schools card above.
Census & demographics
- Census place
- Milwaukee, WI
- County
- Milwaukee County · 926,379 people
- City population
- 573,768
- Metro
- Milwaukee-Waukesha, WI
- Population (ZIP)
- 39,996
- Household income
- $45,934
- Rent vs Own
- Severe rent burden
- 2357.0
Population outlook (Milwaukee County) Hauer SSP2
- Today (2025)
- 995,758 people
- By 2030
- 1,009,124 · +1.3%
- By 2040
- 1,028,128 · +3.3%
- By 2050
- 1,040,066 · +4.4%
- By 2075
- 1,057,849 · +6.2%
- By 2100
- 1,039,774 · +4.4%
Race, ethnicity, and origin ACS 2023
- Neighborhood character
- Predominantly Hispanic (68%)
- Race & ethnicity
- Hispanic / Latino 68% Two or more races 35% White 15% Black 11% Asian 3% Native American 1%
- Hispanic origin (detail)
- Mexican 51% Puerto Rican 13%
- Common ancestry
- Romanian 3% Portuguese 1% Lithuanian 1%
- Foreign-born
- 28% · Canada
- Languages at home
- 35% English-only · Spanish 61% Other Asian/Pacific 1%
Political lean MEDSL · Milwaukee
- 2024 margin
- Solid D (+38.5) · D 68.3% · R 29.8% · Other 1.8%
- 2008→2024 swing
- +2.7pp toward D · 2008: 35.9pp · 2024: 38.5pp
- All cycles
- 2024: D+38.5 2020: D+39.9 2016: D+37.5 2012: D+34.6 2008: D+35.9
Not yet ingested
- Civics
- —
Market trends
- HPI YoY
- ▲ 64.27%
- Current HPI
- 403.236
- Rent YoY
- ▲ 2.00%
- Metro
- Milwaukee-Waukesha, WI
- State GDP YoY
- ▲ 2.10%
- F500 in state
- 20
Industry mix (Fortune 500 HQ in WI)
| Industry | F500 HQs | Revenue |
|---|---|---|
| Industrial Machinery | 4 | $23B |
|
||
| Industrial Technology | 2 | $36B |
|
||
| Insurance | 1 | $36B |
|
||
| Professional Services | 1 | $19B |
|
||
| Utilities | 1 | $9B |
|
||
| Consumer Goods | 1 | $3B |
|
||
Price history
+137.1% since first listed4 events — show timeline
- 2026-05-05 Price Changed $165,999 METROMLS
- 2026-03-28 Price Changed $171,000 METROMLS
- 2026-02-28 Listed $181,000 METROMLS
- 2007-10-16 Sold (MLS) $70,000 METROMLS
Cash-flow waterfall
monthlySold comps — $/sqft
last 12 mo · ≤1 miLoading sold comps…