 104-Plex
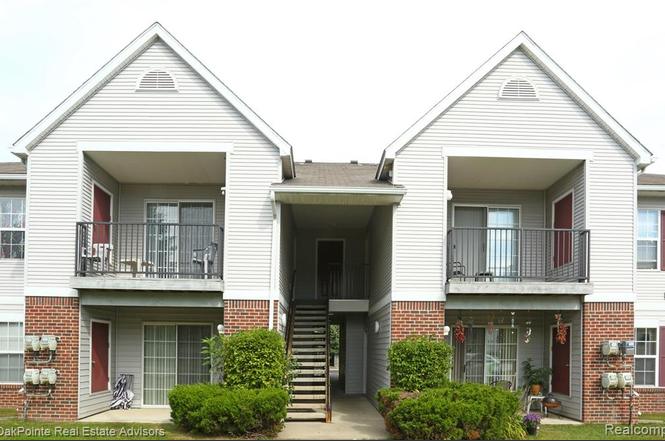
6101 Selby St · Flint, MI
Flood risk No data
- FEMA flood zone
- —
- Chance of flooding over 30 yrs
- —
- Est. flood insurance / yr
- —
Fire risk No data
- Est. fire insurance / yr
- —
Heat risk No data
- Hot days now (above threshold)
- —
- Hot days in 30 yrs
- —
Wind risk No data
- Chance of severe wind over 30 yrs
- —
Air-quality risk No data
- Unhealthy air days now
- —
- Unhealthy air days in 30 yrs
- —
Risk factors via First Street. Map © Google.
Why this score? — see what drove the B grade
The composite is a weighted blend of 9 inputs, each scored 0–100. Each bar is that input's sub-score; the figure is the points it added to the 100-point composite (weight × sub-score).
- Cash flow +30.0/30.0
- DSCR +10.0/10.0
- 1% rule +9.3/10.0
- ARV discount +7.5/15.0
- Appreciation +6.3/10.0
- Livability +3.7/5.0
- Rent growth +2.5/5.0
- Condition / age +2.5/5.0
- Schools +1.1/10.0
$7,000,000
🖨 Deal sheet 📄 Offer letter ✓ Due diligence
Multi-family units
County records classify this as Multi-Family (5+ Unit). Listing-text estimate: 104 units. confirmed
5+ unit building — per-unit beds/baths from public records are typically unavailable; the breakdown below (if shown) is an estimate from the listing text.
Listing remarks MLS
Eagle Ridge Apartments presents a rare opportunity to acquire a stabilized 104-unit multifamily community in Flint, Michigan. Originally developed in 1999–2000 under the Low-Income Housing Tax Credit program, the property has successfully completed its initial 15-year compliance period and is currently operating within the extended-use phase. Units are income-restricted between 30% and 60% AMI, providing dependable occupancy and durable demand fundamentals. Eagle Ridge benefits from a favorable expense structure. Units are equipped with individual HVAC systems, and tenants are responsible for gas and electric utilities, limiting owner exposure. The property operates under a PILOT program, providing predictable and controlled property tax treatment. Ownership has invested approximately $250,000 within the past six months toward parking lot resurfacing and comprehensive security improvements, reinforcing long-term asset integrity. Community amenities include a clubhouse with fitness center, outdoor swimming pool, and shared common areas designed to support resident retention and quality of life.
Key facts
- 8.5 acre lot
- Community pool
- Built 1999
Tags
Property features AI
Finance
- Other: Zoning: MultiFamily; Lot size: approximately 8.5 acres (lot dimensions 472.43 x 744.5)
- Financial info: Tax information not included (only annual amount available)
- HOA & community: Community pool
Exterior
- Parking: Parking details not provided
- Security: Security details not provided
- Utilities: Public water; Public sewer
- Home design: Multi-family residential property; Two levels; Subdivision: ROSEMONT; Directions: Between Saginaw St and 475 South of E Russell Ave; cross streets E Russell Ave and Selby St
- Construction: Vinyl siding exterior; Slab foundation; Built-up area above grade: 162,898 (square feet not listed in interior/exterior sections)
- Exterior features: Paved road access; Pets: contact for details
Interior
- Kitchen: Kitchen details not provided
- Bedrooms: Bedrooms not specified
- Flooring: Flooring details not provided
- Bathrooms: 99 full bathrooms
- Heating & cooling: Forced air heating; Natural gas heating; No cooling system
- Interior features: Community pool access
- Laundry & utility: Laundry details not provided
Neighborhood map
What this means for you Summary
Snapshot
- This is a 104 × 2-bed/1.5-bath units multifamily listed at $7.00M.
Deal economics
- At list price, monthly cash flow is $31k ($368k/yr) — positive. Per door: $295/mo.
- The deal already cash-flows at list — no discount required.
- Meets the 1% rule at list price ($100k rent vs $7.00M).
- Recommended offer: $6.37M (9.0% below list) — sets the bar for market timing.
Location & tenants
- Location reads 74/100 on livability (#196 in MI, #4,946 nationally) — a middle-class / working-renter tenant base. Strengths: commute A+, cost of living A+, housing A+; Watch: schools F, crime F, employment F.
- Flint School District (urban): math 7% / reading 13% proficiency, ranked #714 of 760 in MI (top 94%) — low school quality limits family demand, transient renter base, plan for 1-2y turnover; 83% free/reduced lunch — lower-income household profile, screen leases tightly.
- Market conditions: 99 active listings in the ZIP; lower-income renter base — watch delinquency; 419 units permitted in Genesee County in 2024 (68 in 5+ unit buildings).
- At $100,098/mo this rent would consume 3609% of the median local household income ($33k/yr) (locally 960% of renters already pay >50% of income on rent) — very limited rent-growth headroom before tenants either downsize or default.
Forward outlook
- In year one you build about $236k of equity ($48k loan paydown + $187k appreciation (2.7% local appreciation)).
- Genesee County population projected at -27% by 2050 — secular population decline; favor cash flow + early exit over multi-decade hold.
- At projected returns (2.7% appreciation + 3.0% rent growth), your $1.96M cash investment doubles in ~4 years — after that, you're playing with house money.
- By year 3, paydown + projected appreciation supports a ~$589k cash-out refi (75% LTV) — recoverable capital for the next deal without selling this one.
Negotiation context
- It's been on market 107 days — a 9% lower offer ($6.37M) is reasonable based on typical stale-listing flexibility.
- 2 sale attempts with the ask held roughly flat each time — persistent listings suggest the price (not the market) is what's stuck; bring a comps-based counter.
Questions for the listing agent
- It's been on market 107 days. Have you received any prior offers? Is the seller open to a 9% concession, seller financing, or rate buy-down credit?
- Can we see the unit-by-unit rent roll, current vacancy, and any below-market leases? What's the average tenancy length?
- What capital expenditures (roof, boiler, parking lot, exteriors) have been made in the last 5 years, and what's planned in the next 2?
- Why hasn't it sold? Are there any deal-killer items the seller is aware of (foundation, flood, title, zoning, code violations)?
- Is there a deadline driving the sale (1031 exchange, divorce, estate, relocation)? That informs how much negotiation room exists.
- Schools are F-rated, which usually means shorter tenancies and higher turnover. Who's the typical renter profile here, and what's been the actual vacancy rate?
- Crime grade is F in this area — have there been break-ins, vandalism, or insurance claims at this property in the last 3 years? What carrier currently insures it and at what premium?
- What's the average days-on-market for RENTAL listings here right now (not sales)? A rising rental-DOM trend means longer vacancies and softer asking-rent achievability than the comps imply.
- What's the recent tenant-quality profile in this submarket — average credit score on applications, eviction rate, late-payment / NSF rate, and stable-employment percentage? A property-management company in the area should have these aggregated.
- How much new apartment / multifamily construction is in the pipeline within 1–3 miles? Heavy new supply (>2% of stock underway) typically softens rents 12–24 months out; light construction supports rent growth.
Investment metrics
- 1% rule
- 1.43% ✓
- Cap rate
- 11.56%
- Cash-on-cash
- 18.80%
- DSCR
- 1.84
- GRM
- 5.8
CMA / ARV
No comps found within radius.
Projected returns pro-forma
2.67% appreciation · 3.0% rent growth · sell at horizon
- IRR
- 24.5%
- Equity multiple
- 2.37×
- Total profit
- $2,680,199
- Equity at exit
- $3,019,854
- IRR
- 25.6%
- Equity multiple
- 4.55×
- Total profit
- $6,955,101
- Equity at exit
- $4,557,045
Cash invested: $1,960,000 (down + closing). Projections, not guarantees.
Landlord ↔ Tenant lean methodology
- Overall (STATE)
- 62 Landlord-Friendly
- State Michigan
- 62 Landlord-Friendly · EVEN
- County
- — inherits STATE
- City
- — inherits STATE
ZIP-level market 48505
- Home prices YoY
- 1.3%
- Active inventory
- 99
- Price-to-rent
- 606.1×
Monthly cashflow live
- Estimated rent
- $100,098 medium interval (Pro) →
- Mortgage (P&I)
- −$36,709
- Tax est. 1.5%
- −$8,750 /mo · $105,000/yr
- Insurance
- −$2,917
- HOA
- −$0
- Vacancy / Maint / Mgmt
- −$21,021
- Net cashflow
- $30,702
Break-even live
104-unit breakdown (identical units grouped — click to expand)
| Units | Beds | Baths | Est. rent |
|---|---|---|---|
| 104× units | 2 | 1.5 | $100,048 |
| #1 | 2 | 1.5 | $962 |
| #2 | 2 | 1.5 | $962 |
| #3 | 2 | 1.5 | $962 |
| #4 | 2 | 1.5 | $962 |
| #5 | 2 | 1.5 | $962 |
| #6 | 2 | 1.5 | $962 |
| #7 | 2 | 1.5 | $962 |
| #8 | 2 | 1.5 | $962 |
| #9 | 2 | 1.5 | $962 |
| #10 | 2 | 1.5 | $962 |
| #11 | 2 | 1.5 | $962 |
| #12 | 2 | 1.5 | $962 |
| #13 | 2 | 1.5 | $962 |
| #14 | 2 | 1.5 | $962 |
| #15 | 2 | 1.5 | $962 |
| #16 | 2 | 1.5 | $962 |
| #17 | 2 | 1.5 | $962 |
| #18 | 2 | 1.5 | $962 |
| #19 | 2 | 1.5 | $962 |
| #20 | 2 | 1.5 | $962 |
| #21 | 2 | 1.5 | $962 |
| #22 | 2 | 1.5 | $962 |
| #23 | 2 | 1.5 | $962 |
| #24 | 2 | 1.5 | $962 |
| #25 | 2 | 1.5 | $962 |
| #26 | 2 | 1.5 | $962 |
| #27 | 2 | 1.5 | $962 |
| #28 | 2 | 1.5 | $962 |
| #29 | 2 | 1.5 | $962 |
| #30 | 2 | 1.5 | $962 |
| #31 | 2 | 1.5 | $962 |
| #32 | 2 | 1.5 | $962 |
| #33 | 2 | 1.5 | $962 |
| #34 | 2 | 1.5 | $962 |
| #35 | 2 | 1.5 | $962 |
| #36 | 2 | 1.5 | $962 |
| #37 | 2 | 1.5 | $962 |
| #38 | 2 | 1.5 | $962 |
| #39 | 2 | 1.5 | $962 |
| #40 | 2 | 1.5 | $962 |
| #41 | 2 | 1.5 | $962 |
| #42 | 2 | 1.5 | $962 |
| #43 | 2 | 1.5 | $962 |
| #44 | 2 | 1.5 | $962 |
| #45 | 2 | 1.5 | $962 |
| #46 | 2 | 1.5 | $962 |
| #47 | 2 | 1.5 | $962 |
| #48 | 2 | 1.5 | $962 |
| #49 | 2 | 1.5 | $962 |
| #50 | 2 | 1.5 | $962 |
| #51 | 2 | 1.5 | $962 |
| #52 | 2 | 1.5 | $962 |
| #53 | 2 | 1.5 | $962 |
| #54 | 2 | 1.5 | $962 |
| #55 | 2 | 1.5 | $962 |
| #56 | 2 | 1.5 | $962 |
| #57 | 2 | 1.5 | $962 |
| #58 | 2 | 1.5 | $962 |
| #59 | 2 | 1.5 | $962 |
| #60 | 2 | 1.5 | $962 |
| #61 | 2 | 1.5 | $962 |
| #62 | 2 | 1.5 | $962 |
| #63 | 2 | 1.5 | $962 |
| #64 | 2 | 1.5 | $962 |
| #65 | 2 | 1.5 | $962 |
| #66 | 2 | 1.5 | $962 |
| #67 | 2 | 1.5 | $962 |
| #68 | 2 | 1.5 | $962 |
| #69 | 2 | 1.5 | $962 |
| #70 | 2 | 1.5 | $962 |
| #71 | 2 | 1.5 | $962 |
| #72 | 2 | 1.5 | $962 |
| #73 | 2 | 1.5 | $962 |
| #74 | 2 | 1.5 | $962 |
| #75 | 2 | 1.5 | $962 |
| #76 | 2 | 1.5 | $962 |
| #77 | 2 | 1.5 | $962 |
| #78 | 2 | 1.5 | $962 |
| #79 | 2 | 1.5 | $962 |
| #80 | 2 | 1.5 | $962 |
| #81 | 2 | 1.5 | $962 |
| #82 | 2 | 1.5 | $962 |
| #83 | 2 | 1.5 | $962 |
| #84 | 2 | 1.5 | $962 |
| #85 | 2 | 1.5 | $962 |
| #86 | 2 | 1.5 | $962 |
| #87 | 2 | 1.5 | $962 |
| #88 | 2 | 1.5 | $962 |
| #89 | 2 | 1.5 | $962 |
| #90 | 2 | 1.5 | $962 |
| #91 | 2 | 1.5 | $962 |
| #92 | 2 | 1.5 | $962 |
| #93 | 2 | 1.5 | $962 |
| #94 | 2 | 1.5 | $962 |
| #95 | 2 | 1.5 | $962 |
| #96 | 2 | 1.5 | $962 |
| #97 | 2 | 1.5 | $962 |
| #98 | 2 | 1.5 | $962 |
| #99 | 2 | 1.5 | $962 |
| #100 | 2 | 1.5 | $962 |
| #101 | 2 | 1.5 | $962 |
| #102 | 2 | 1.5 | $962 |
| #103 | 2 | 1.5 | $962 |
| #104 | 2 | 1.5 | $962 |
| Total (104 units) | $100,098 | ||
UW: 25.0% down · 7.5% · 30yr · 1.5% tax · 5.0% vac · 8.0% maint · 8.0% mgmt
Financing live
Cash to close
- Down payment
- $1,750,000
- Closing costs
- $210,000
- Reserves months
- —
- Total cash needed
- —
Loan-product check · same deal, 3 products live
Conventional
25% down · 7.5% · 30yr
- Down + closing
- —
- Monthly P&I
- —
- Monthly cashflow
- —
- DSCR
- —
- Eligible?
- —
Personal DTI + credit; lowest rate.
DSCR
20% down · 8.5% · 30yr
- Down + closing
- —
- Monthly P&I
- —
- Monthly cashflow
- —
- DSCR
- —
- Eligible?
- —
No personal income docs; deal must DSCR.
Hard money
10% down · 12.0% · 12mo
- Down + closing
- —
- Monthly P&I
- —
- Monthly cashflow
- —
- DSCR
- —
- Eligible?
- —
Short-term bridge; refi at stabilization.
Listing history 18 events
-
2026-06-18days on market $7,000,000 Active 107 DOM
-
2026-06-17days on market $7,000,000 Active 106 DOM
-
2026-06-16days on market $7,000,000 Active 105 DOM
-
2026-06-15days on market $7,000,000 Active 104 DOM
-
2026-06-14days on market $7,000,000 Active 102 DOM
-
2026-06-13days on market $7,000,000 Active 101 DOM
-
2026-06-10days on market $7,000,000 Active 99 DOM
-
2026-06-09days on market $7,000,000 Active 98 DOM
-
2026-06-08days on market $7,000,000 Active 97 DOM
-
2026-06-07days on market $7,000,000 Active 96 DOM
-
2026-06-05days on market $7,000,000 Active 93 DOM
-
2026-06-03days on market $7,000,000 Active 92 DOM
-
2026-06-02days on market $7,000,000 Active 91 DOM
-
2026-06-01days on market $7,000,000 Active 90 DOM
-
2026-05-31days on market $7,000,000 Active 89 DOM
-
2026-05-30days on market $7,000,000 Active 88 DOM
-
2026-03-03$7,000,000 Active
Show marketing remark (1129 chars)
Eagle Ridge Apartments presents a rare opportunity to acquire a stabilized 104-unit multifamily community in Flint, Michigan. Originally developed in 1999–2000 under the Low-Income Housing Tax Credit program, the property has successfully completed its initial 15-year compliance period and is currently operating within the extended-use phase. Units are income-restricted between 30% and 60% AMI, providing dependable occupancy and durable demand fundamentals. Eagle Ridge benefits from a favorable expense structure. Units are equipped with individual HVAC systems, and tenants are responsible for gas and electric utilities, limiting owner exposure. The property operates under a PILOT program, providing predictable and controlled property tax treatment. Ownership has invested approximately $250,000 within the past six months toward parking lot resurfacing and comprehensive security improvements, reinforcing long-term asset integrity. Community amenities include a clubhouse with fitness center, outdoor swimming pool, and shared common areas designed to support resident retention and quality of life.
-
2026-03-03$7,000,000 Active 1129-char remark
Show marketing remark (1129 chars)
Eagle Ridge Apartments presents a rare opportunity to acquire a stabilized 104-unit multifamily community in Flint, Michigan. Originally developed in 1999–2000 under the Low-Income Housing Tax Credit program, the property has successfully completed its initial 15-year compliance period and is currently operating within the extended-use phase. Units are income-restricted between 30% and 60% AMI, providing dependable occupancy and durable demand fundamentals. Eagle Ridge benefits from a favorable expense structure. Units are equipped with individual HVAC systems, and tenants are responsible for gas and electric utilities, limiting owner exposure. The property operates under a PILOT program, providing predictable and controlled property tax treatment. Ownership has invested approximately $250,000 within the past six months toward parking lot resurfacing and comprehensive security improvements, reinforcing long-term asset integrity. Community amenities include a clubhouse with fitness center, outdoor swimming pool, and shared common areas designed to support resident retention and quality of life.
ⓘ Source: listings_history table (triggers on properties + properties_extension) + one-shot
backfill from property_details.listing_events for pre-trigger history.
Nearby sold comps map
Loading sold comps map…
Walkable amenities ~0.75 mi
Loading nearby amenities…
Taxation est. · year 1
- Rental income
- $1,201,176
- − Mortgage interest
- −$392,109
- − Property taxes
- −$105,000
- − Insurance
- −$35,000
- − Repairs & maintenance
- −$96,094
- − Management
- −$96,094
- − Depreciation
- −$203,636
- Taxable income
- $273,243
- Est. tax owed @ 24.0%
- −$65,578
- After-tax cash flow
- $302,846/yr
For passive investors: Depreciation is non-cash, so a rental often shows a tax loss while cash-flowing — sheltering income. Rental losses are passive: they offset passive income freely, and up to $25,000/yr can offset ordinary (W-2) income if you actively participate and your MAGI is under $100k (phasing out to $0 by $150k); unused losses carry forward. On sale, claimed depreciation is recaptured at up to 25%, and gains may owe capital-gains tax (a 1031 exchange can defer both). Figures are a year-1 estimate at your 24.0% rate — not tax advice; consult a CPA.
Schools (NCES district)
- District
- Flint School District
- NCES district ID
- 2614520
- Math proficiency
- 7% ▬ 0.00%
- Reading proficiency
- 13% ▲ 3.00%
- Median HH income
- $25,954
- Composite
- 10.97/100
- National rank
- #14642
- State rank
- #714 of 760 in MI
Livability — Flint
- Score
- 74/100
- State rank
- #196
- US rank
- #4946
Category grades
Schools grade is shown separately in the Schools card above.
Census & demographics
- Census place
- Flint, MI
- County
- Genesee County · 221,329 people
- City population
- 93,814
- Metro
- Flint, MI
- Population (ZIP)
- 18,032
- Household income
- $33,283
- Rent vs Own
- Severe rent burden
- 960.0
Population outlook (Genesee County) Hauer SSP2
- Today (2025)
- 381,312 people
- By 2030
- 362,731 · -4.9%
- By 2040
- 321,550 · -15.7%
- By 2050
- 279,212 · -26.8%
- By 2075
- 193,336 · -49.3%
- By 2100
- 128,118 · -66.4%
Race, ethnicity, and origin ACS 2023
- Neighborhood character
- Predominantly Black (79%)
- Race & ethnicity
- Black 79% White 11% Two or more races 6% Hispanic / Latino 3%
- Common ancestry
- Romanian 1% Iranian 1% Lithuanian 1%
- Foreign-born
- 1% · Canada
- Languages at home
- 98% English-only · Spanish 1%
Political lean MEDSL · Genesee
- 2024 margin
- Toss-up / Even · D 51.4% · R 47.2% · Other 1.4%
- 2008→2024 swing
- -28.3pp toward R · 2008: 32.5pp · 2024: 4.2pp
- All cycles
- 2024: D+4.2 2020: D+9.3 2016: D+9.5 2012: D+28.2 2008: D+32.5
Not yet ingested
- Civics
- —
Market trends
- HPI YoY
- ▲ 2.67%
- Current HPI
- 202.4878
- Rent YoY
- —
- Metro
- Flint, MI
- State GDP YoY
- ▲ 1.37%
- F500 in state
- 28
Industry mix (Fortune 500 HQ in MI)
| Industry | F500 HQs | Revenue |
|---|---|---|
| Automotive Parts | 3 | $48B |
|
||
| Automotive | 2 | $372B |
|
||
| Chemicals | 1 | $45B |
|
||
| Automotive Retail | 1 | $29B |
|
||
| Healthcare / Medical Devices | 1 | $23B |
|
||
| Automotive Technology | 1 | $20B |
|
||
Price history
+0.0% since first listed2 events — show timeline
- 2026-03-03 Listed $7,000,000 MiRealSource-MiMLS
- 2026-03-03 Listed $7,000,000 REALCOMP
Cash-flow waterfall
monthlySold comps — $/sqft
last 12 mo · ≤1 miLoading sold comps…