 Duplex
1014 Sedgefield St · Durham, NC
Flood risk 9/10 · Severe
- FEMA flood zone
- X (unshaded)
- Chance of flooding over 30 yrs
- 0.98%
- Est. flood insurance / yr
- $507 – $1,088
Fire risk 1/10 · Minimal
- Est. fire insurance / yr
- $906 – $1,684
Heat risk 6/10 · Moderate
- Hot days now (above 105°F)
- 7 days/yr
- Hot days in 30 yrs
- 16 days/yr
Wind risk 6/10 · Moderate
- Chance of severe wind over 30 yrs
- 27.0%
Air-quality risk 2/10 · Minimal
- Unhealthy air days now
- 1 days/yr
- Unhealthy air days in 30 yrs
- 1 days/yr
Risk factors via First Street. Map © Google.
Why this score? — see what drove the D grade
The composite is a weighted blend of 9 inputs, each scored 0–100. Each bar is that input's sub-score; the figure is the points it added to the 100-point composite (weight × sub-score).
- Cash flow +13.6/30.0
- ARV discount +7.5/15.0
- DSCR +4.1/10.0
- Livability +4.0/5.0
- 1% rule +3.5/10.0
- Rent growth +3.2/5.0
- Schools +3.0/10.0
- Condition / age +2.5/5.0
- Appreciation +0.0/10.0
$329,900
🖨 Deal sheet 📄 Offer letter ✓ Due diligence
Multi-family units
County records classify this as Multi-Family (2-4 Unit). Listing-text estimate: 2 units. confirmed
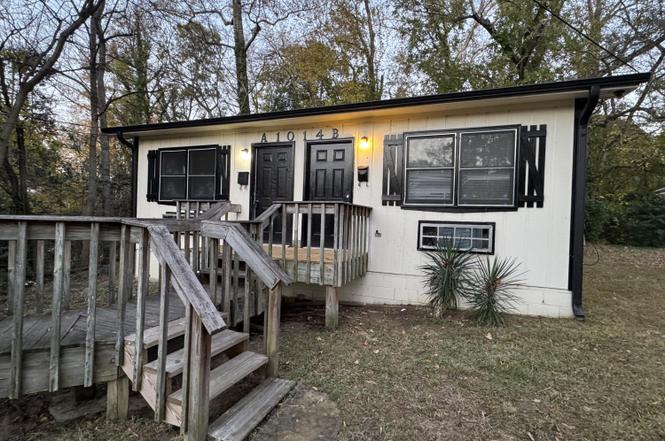
Listing remarks
Prime Durham duplex just minutes from Duke University! Tucked away from the main road, this one-level property offers solid rental appeal. Live in one unit and rent the other, or add an income-ready performer to your investment portfolio. Private feel, unbeatable convenience, and a rare opportunity in this established neighborhood.
Key facts
- Durham duplex
- Solid rental appeal
- One-level property
Tags
Property features AI
Finance
- Other: Public maintained paved road; County: Durham; Directions: South on Broad St., Right onto W. Knox St, Left onto Sedgefield St. Home 8th house on right.
- Financial info: Two-unit property; Owner pays: none; Units furnished: none
- HOA & community: No association; Not a senior community
Exterior
- Parking: Driveway; On-street parking; Unpaved parking
- Utilities: Public water; Public sewer; Electricity available and connected; Water connected; Sewer connected
- Home design: Duplex, site-built; One story
- Construction: Shingle roof; Unknown construction materials; 1 building; Built as a duplex
- Exterior features: Rear porch; No fencing; R-3 zoning; Not waterfront; 0.32 acre lot
Interior
- Kitchen: Electric cooktop; Refrigerator
- Bedrooms: 2 bedrooms
- Flooring: Luxury vinyl; 900 living area
- Bathrooms: 2 full bathrooms
- Heating & cooling: Electric heating; Heat pump; Electric cooling; Wall unit(s)
- Interior features: Bathtub/shower combination
- Laundry & utility: Washer hookup; Electric dryer hookup; Main level laundry
Neighborhood map
What this means for you Summary
Snapshot
- This is a 2 × 2-bed/2.0-bath units multifamily listed at $330k.
Deal economics
- At list price, monthly cash flow is $-48 ($-570/yr) — negative. Per door: $-24/mo.
- To cash-flow at today's rent, offer at most $322k (2.5% below list).
- To meet the 1% rule (rent ≥ 1% of price), the offer needs to be $280k (15.0% below list).
- Recommended offer: $280k (15.0% below list) — sets the bar for 1% rule.
- Cap rate 6.4% vs local median 3.0% in Durham — top-decile yield for the area; either an underpriced asset or a hidden risk that comps aren't pricing in. Stress-test before assuming the spread holds.
Location & tenants
- Location reads 81/100 on livability (#15 in NC, #1,411 nationally) — a professional / high-income tenant draw. Strengths: amenities A+, commute A+, housing A+; Watch: crime F.
- Durham Public Schools (urban): math 29% / reading 39% proficiency, ranked #132 of 178 in NC (top 74%) — families likely to look elsewhere, expect single-tenant / working-renter base with shorter leases.
- Zoned schools: Riverside High (math 49% / reading 42%, grade D-, #347 of 535 statewide, top 65%, 1,812 students, 51% FRL).
- Market conditions: Rents rising (+3.0%/yr); 257 active listings in the ZIP; 40 comparable units currently listed for rent nearby; rentals leasing fast (median 14d on market — plan ~1-2 weeks tenant-placement turnaround); 2,905 units permitted in Durham County in 2024 (955 in 5+ unit buildings).
- At $2,803/mo this rent would consume 46% of the median local household income ($73k/yr) (locally 3406% of renters already pay >50% of income on rent) — very limited rent-growth headroom before tenants either downsize or default.
Forward outlook
- Local home prices are declining (-3.0%/yr); year-one equity from $2k of loan paydown is wiped out by about $10k of value loss. Plan a longer hold.
- Durham County population projected at +44% by 2050 — long-run rental-demand tailwind backs the buy-and-hold thesis.
Negotiation context
- It's been on market 146 days — a 12% lower offer ($290k) is reasonable based on typical stale-listing flexibility.
- 6 sale attempts since 2y ago; this cycle's ask has dropped $20k (6%) from the opening price — seller is motivated, your offer sets the floor, not the list.
Risks & watch-outs
- Watch-outs: flood insurance adds $66/mo.
- Climate carrying-cost: severe flood risk; major wind risk, 27% chance of damaging wind over 30y; extreme-heat days projected 7→16/yr by 2055 (HVAC capex compounding) — expect insurance premiums to compound above CPI over the hold.
Questions for the listing agent
- What do current leases actually rent for vs. the listed asking? Can we see a recent rent roll and the last 12 months of T-12 income?
- It's been on market 146 days. Have you received any prior offers? Is the seller open to a 15% concession, seller financing, or rate buy-down credit?
- Can we see the unit-by-unit rent roll, current vacancy, and any below-market leases? What's the average tenancy length?
- What capital expenditures (roof, boiler, parking lot, exteriors) have been made in the last 5 years, and what's planned in the next 2?
- What's the actual annual flood-insurance premium (NFIP or private), and is the property in a SFHA with mandatory coverage?
- Why hasn't it sold? Are there any deal-killer items the seller is aware of (foundation, flood, title, zoning, code violations)?
- Is there a deadline driving the sale (1031 exchange, divorce, estate, relocation)? That informs how much negotiation room exists.
- Schools are D-rated, which usually means shorter tenancies and higher turnover. Who's the typical renter profile here, and what's been the actual vacancy rate?
- Crime grade is F in this area — have there been break-ins, vandalism, or insurance claims at this property in the last 3 years? What carrier currently insures it and at what premium?
- The area grade is low — what's the realistic commute time and amenity access for the typical tenant pool here? Any planned neighborhood developments (good or bad) we should know about?
- What's the average days-on-market for RENTAL listings here right now (not sales)? A rising rental-DOM trend means longer vacancies and softer asking-rent achievability than the comps imply.
- What's the recent tenant-quality profile in this submarket — average credit score on applications, eviction rate, late-payment / NSF rate, and stable-employment percentage? A property-management company in the area should have these aggregated.
- How much new apartment / multifamily construction is in the pipeline within 1–3 miles? Heavy new supply (>2% of stock underway) typically softens rents 12–24 months out; light construction supports rent growth.
Investment metrics
- 1% rule
- 0.85% ✗
- Cap rate
- 6.36%
- Cash-on-cash
- 0.25%
- DSCR
- 1.01
- GRM
- 9.8
CMA / ARV
No comps found within radius.
Projected returns pro-forma
-3.0% appreciation · 2.97% rent growth · sell at horizon
- IRR
- -17.3%
- Equity multiple
- 0.39×
- Total profit
- $-56,539
- Equity at exit
- $49,189
- IRR
- -9.4%
- Equity multiple
- 0.42×
- Total profit
- $-53,352
- Equity at exit
- $28,524
Cash invested: $92,372 (down + closing). Projections, not guarantees.
Landlord ↔ Tenant lean methodology
- Overall (STATE)
- 85 Strongly Landlord-Friendly
- State North Carolina
- 85 Strongly Landlord-Friendly · R+3
- County
- — inherits STATE
- City
- — inherits STATE
ZIP-level market 27705
- Rents YoY
- 3.0%
- Active inventory
- 257
- Price-to-rent
- 19.6×
Monthly cashflow live
- Estimated rent
- $2,803 medium interval (Pro) →
- Mortgage (P&I)
- −$1,730
- Tax from tax record
- −$328 /mo · $3,936/yr
- Insurance
- −$137
- Flood insurance flood zone
- −$66 /mo · $798/yr
- HOA
- −$0
- Vacancy / Maint / Mgmt
- −$589
- Net cashflow
- $-48
Break-even live
2-unit breakdown (identical units grouped — click to expand)
| Units | Beds | Baths | Est. rent |
|---|---|---|---|
| 2× units | 2 | 2 | $2,804 |
| #1 | 2 | 2 | $1,402 |
| #2 | 2 | 2 | $1,402 |
| Total (2 units) | $2,803 | ||
UW: 25.0% down · 7.5% · 30yr · 1.5% tax · 5.0% vac · 8.0% maint · 8.0% mgmt
Financing live
Cash to close
- Down payment
- $82,475
- Closing costs
- $9,897
- Reserves months
- —
- Total cash needed
- —
Loan-product check · same deal, 3 products live
Conventional
25% down · 7.5% · 30yr
- Down + closing
- —
- Monthly P&I
- —
- Monthly cashflow
- —
- DSCR
- —
- Eligible?
- —
Personal DTI + credit; lowest rate.
DSCR
20% down · 8.5% · 30yr
- Down + closing
- —
- Monthly P&I
- —
- Monthly cashflow
- —
- DSCR
- —
- Eligible?
- —
No personal income docs; deal must DSCR.
Hard money
10% down · 12.0% · 12mo
- Down + closing
- —
- Monthly P&I
- —
- Monthly cashflow
- —
- DSCR
- —
- Eligible?
- —
Short-term bridge; refi at stabilization.
Rent comps 40 comps
| Address | Beds | Baths | Sqft | Rent | $/sqft | DOM | Units | Dist |
|---|---|---|---|---|---|---|---|---|
| 906 Clarendon St Unit A Durham, NC | 1.0 | 1.0 | 750 | $1,695 | $2.26 | 13d | 1 | 0.22mi |
| 810 9th St Durham, NC | 3.0 | 1.0–3.0 | 988 | $3,110 | $3.15 | 13d | 47 | 0.40mi |
| 1906 Guess Rd Durham, NC | 1.0–3.0 | 1.0–1.5 | 825 | $1,338 | $1.62 | 23d | 22 | 0.49mi |
| 749 9th St Durham, NC | 3.0 | 1.0–2.0 | 1084 | $3,191 | $2.94 | 13d | 97 | 0.61mi |
| 1001 Ruby St Durham, NC | 2.0 | 1.0–2.0 | 600 | $1,300 | $2.17 | 13d | 3 | 0.64mi |
| 1309 Hudson Ave Unit A5 Durham, NC | 1.0 | 1.0 | 549 | $1,100 | $2.00 | 23d | 1 | 0.65mi |
| 1803 Hillcrest Dr Durham, NC | 3.0 | 1.0 | 1044 | $1,975 | $1.89 | 13d | 1 | 0.67mi |
| 2211 Hillsborough Rd Durham, NC | 1.0–2.0 | 1.0–2.0 | 1142 | $3,125 | $2.74 | 13d | 85 | 0.67mi |
| 730 Rutherford St Durham, NC | 3.0 | 1.0–3.0 | 1030 | $3,220 | $3.12 | 13d | 1 | 0.73mi |
| 1000 N Duke St Durham, NC | 2.0 | 1.5 | 1080 | $1,595 | $1.48 | 23d | 1 | 0.74mi |
| 800 Demerius St Durham, NC | 2.0 | 1.0 | 715 | $1,445 | $2.02 | 23d | 1 | 0.74mi |
| 1306 Leon St Durham, NC | 1.0–3.0 | 1.0–2.0 | 850 | $1,287 | $1.51 | 23d | 1 | 0.77mi |
| 810 N Duke St Apt 17 Durham, NC | 1.0 | 1.0 | 575 | $950 | $1.65 | 23d | 1 | 0.80mi |
| 704 15th St Durham, NC | 3.0 | 1.0–2.5 | 1257 | $3,425 | $2.72 | 13d | 44 | 0.85mi |
| 2710 Lawndale Ave Durham, NC | 3.0 | 1.0 | 1125 | $1,600 | $1.42 | 13d | 1 | 0.94mi |
| 311 Swift Ave Durham, NC | 2.0 | 1.0–2.0 | 980 | $1,405 | $1.43 | 21d | 1 | 0.94mi |
| 807 W Trinity Ave Durham, NC | 1.0 | 1.0 | 600 | $1,562 | $2.60 | 23d | 1 | 0.95mi |
| 334 Clark St Unit A Durham, NC | 2.0 | 1.0 | 796 | $1,150 | $1.44 | 23d | 1 | 0.98mi |
| 1005 W Main St Durham, NC | 1.0 | 1.0 | 909 | $2,179 | $2.40 | 23d | 1 | 1.04mi |
| 701 Washington St Durham, NC | 1.0–3.0 | 1.0–2.0 | 996 | $3,338 | $3.35 | 13d | 214 | 1.05mi |
| 406 Green St Durham, NC | 2.0 | 1.0 | 912 | $1,990 | $2.18 | 23d | 1 | 1.06mi |
| 317 W Trinity Ave Unit J Durham, NC | 1.0 | 1.0 | 575 | $1,275 | $2.22 | 23d | 1 | 1.11mi |
| 317 W Trinity Ave Unit C Durham, NC | 1.0 | 1.0 | 575 | $1,275 | $2.22 | 21d | 1 | 1.11mi |
| 308 W Trinity Ave Unit 19 Durham, NC | 1.0 | 1.0 | 595 | $1,100 | $1.85 | 13d | 1 | 1.12mi |
| 311 Liggett St Durham, NC | 2.0 | 1.0–2.0 | 1008 | $4,525 | $4.49 | 13d | 11 | 1.16mi |
| 620 Foster St Unit 817 Durham, NC | 1.0 | 1.0 | 578 | $1,903 | $3.29 | 21d | 1 | 1.17mi |
| 2335 Broad St Durham, NC | 1.0–3.0 | 1.0–2.0 | 1060 | $1,700 | $1.60 | 13d | 22 | 1.17mi |
| 620 Foster St Durham, NC | 2.0 | 1.0–2.0 | 888 | $3,303 | $3.72 | 13d | 43 | 1.18mi |
| 545 Foster St Durham, NC | 2.0 | 1.0–2.0 | 910 | $2,722 | $2.99 | 13d | 2 | 1.23mi |
| 530 Foster St Durham, NC | 2.0 | 1.0–2.0 | 918 | $2,750 | $3.00 | 13d | 18 | 1.26mi |
| 605 W Main St Durham, NC | 3.0 | 1.0–2.0 | 977 | $2,837 | $2.90 | 13d | 48 | 1.26mi |
| 815 Madison St Durham, NC | 2.0 | 1.0–2.0 | 859 | $2,854 | $3.32 | 21d | 5 | 1.27mi |
| 1404 W Chapel Hill St Unit C Durham, NC | 1.0 | 1.0 | 742 | $1,315 | $1.77 | 13d | 1 | 1.27mi |
| 318 W Corporation St Durham, NC | 3.0 | 1.0–2.0 | 900 | $2,934 | $3.26 | 13d | 55 | 1.27mi |
| 1500 Duke University Rd Durham, NC | 2.0 | 1.0 | 800 | $1,500 | $1.88 | 23d | 1 | 1.29mi |
| 321 W Corporation St Durham, NC | 2.0 | 2.0 | 977 | $2,530 | $2.59 | 13d | 1 | 1.32mi |
| 311 W Corporation St Durham, NC | 2.0 | 1.0–2.0 | 691 | $3,505 | $5.07 | 21d | 5 | 1.32mi |
| 311 W Corporation St Unit 3-201 Durham, NC | 2.0 | 2.0 | 985 | $3,355 | $3.41 | 23d | 1 | 1.32mi |
| 605 W Chapel Hill St Durham, NC | 2.0 | 1.0–2.0 | 760 | $2,011 | $2.64 | 13d | 19 | 1.32mi |
| 200 W Geer St Unit 200-C Durham, NC | 2.0 | 1.0 | 850 | $1,400 | $1.65 | 13d | 1 | 1.34mi |
Listing history 30 events
-
2026-06-18days on market $329,900 Active 146 DOM
-
2026-06-17days on market $329,900 Active 145 DOM
-
2026-06-16days on market $329,900 Active 144 DOM
-
2026-06-15days on market $329,900 Active 143 DOM
-
2026-06-14days on market $329,900 Active 141 DOM
-
2026-06-10days on market $329,900 Active 138 DOM
-
2026-06-09days on market $329,900 Active 137 DOM
-
2026-06-08days on market $329,900 Active 136 DOM
-
2026-06-07days on market $329,900 Active 135 DOM
-
2026-06-05days on market $329,900 Active 132 DOM
-
2026-06-03days on market $329,900 Active 131 DOM
-
2026-06-02days on market $329,900 Active 130 DOM
-
2026-06-01days on market $329,900 Active 129 DOM
-
2026-05-31days on market $329,900 Active 128 DOM
-
2026-05-30days on market $329,900 Active 127 DOM
-
2026-04-14price $329,900
-
2026-01-23$349,900 Active
-
2026-01-23historical
-
2025-11-13$349,900 Active
-
2024-12-17historical $950
-
2024-11-27$950
-
2024-11-06historical $950
-
2024-09-29price $950
-
2024-09-13price $1,025
-
2024-09-05$1,050
-
2024-08-15historical $995
-
2024-08-14$995
-
2024-08-14historical $995
-
2024-08-13$995
-
2022-07-01soldstatus $310,000
ⓘ Source: listings_history table (triggers on properties + properties_extension) + one-shot
backfill from property_details.listing_events for pre-trigger history.
Tax reassessment forecast NC · Resets to sale price
- Current annual tax
- $3,936 · $328/mo
- Projected year-2 tax
- $3,936 · $328/mo
- Expected delta
- $0/yr ($0/mo · -0.0%)
ⓘ Screening estimate from a state-policy table — verify with the county assessor before closing.
Climate risk First Street
- Flood 9/10 Extreme FEMA zone X (unshaded) · 98% chance over 30 yrs
- Wildfire 1/10 Low
- Heat 6/10 Major 7 d/yr ≥105°F today · 16 d/yr by 30 yrs out
- Wind 6/10 Major 27% chance of damaging wind over 30 yrs
- Air quality 2/10 Low 1 unhealthy d/yr today · 1 by 30 yrs out
Nearby sold comps map
Loading sold comps map…
Walkable amenities ~0.75 mi
Loading nearby amenities…
Taxation est. · year 1
- Rental income
- $33,636
- − Mortgage interest
- −$18,480
- − Property taxes
- −$3,936
- − Insurance
- −$2,447
- − Repairs & maintenance
- −$2,691
- − Management
- −$2,691
- − Depreciation
- −$9,597
- Taxable loss
- −$6,205
- Est. tax savings @ 24.0%
- +$1,489
- After-tax cash flow
- $919/yr
For passive investors: Depreciation is non-cash, so a rental often shows a tax loss while cash-flowing — sheltering income. Rental losses are passive: they offset passive income freely, and up to $25,000/yr can offset ordinary (W-2) income if you actively participate and your MAGI is under $100k (phasing out to $0 by $150k); unused losses carry forward. On sale, claimed depreciation is recaptured at up to 25%, and gains may owe capital-gains tax (a 1031 exchange can defer both). Figures are a year-1 estimate at your 24.0% rate — not tax advice; consult a CPA.
Schools (NCES district)
- District
- Durham Public Schools
- NCES district ID
- 3701260
- Math proficiency
- 29% ▼ -3.00%
- Reading proficiency
- 39% ▲ 2.00%
- Median HH income
- $52,143
- Composite
- 29.69/100
- National rank
- #6457
- State rank
- #132 of 178 in NC
Livability — Durham
- Score
- 81/100
- State rank
- #15
- US rank
- #1411
Category grades
Schools grade is shown separately in the Schools card above.
Census & demographics
- Census place
- Durham, NC
- County
- Durham County · 288,747 people
- City population
- 288,747
- Metro
- Durham-Chapel Hill, NC
- Population (ZIP)
- 49,923
- Household income
- $73,066
- Rent vs Own
- Severe rent burden
- 3406.0
Population outlook (Durham County) Hauer SSP2
- Today (2025)
- 368,962 people
- By 2030
- 402,686 · +9.1%
- By 2040
- 468,677 · +27.0%
- By 2050
- 531,727 · +44.1%
- By 2075
- 660,446 · +79.0%
- By 2100
- 739,971 · +100.6%
Race, ethnicity, and origin ACS 2023
- Neighborhood character
- Diverse neighborhood (Simpson 0.65)
- Race & ethnicity
- White 54% Black 17% Hispanic / Latino 14% Two or more races 9% Asian 9%
- Hispanic origin (detail)
- Mexican 7%
- Common ancestry
- Serbian 3% Italian 3% Slovak 2%
- Foreign-born
- 19% · Canada, China, South Korea
- Languages at home
- 77% English-only · Spanish 13% Chinese 4% Other Indo-European 2%
Political lean MEDSL · Durham
- 2024 margin
- Solid D (+61.9) · D 80.2% · R 18.2% · Other 1.6%
- 2008→2024 swing
- +10.0pp toward D · 2008: 51.9pp · 2024: 61.9pp
- All cycles
- 2024: D+61.9 2020: D+62.4 2016: D+60.4 2012: D+52.7 2008: D+51.9
Not yet ingested
- Civics
- —
Market trends
- HPI YoY
- ▼ -446.90%
- Current HPI
- 257.6519
- Rent YoY
- ▲ 2.97%
- Metro
- Durham-Chapel Hill, NC
- State GDP YoY
- ▲ 3.28%
- F500 in state
- 26
Industry mix (Fortune 500 HQ in NC)
| Industry | F500 HQs | Revenue |
|---|---|---|
| Financial Services | 2 | $213B |
|
||
| Retail | 2 | $95B |
|
||
| Industrial Conglomerate | 1 | $38B |
|
||
| Metals / Steel | 1 | $35B |
|
||
| Utilities | 1 | $30B |
|
||
| Industrial Machinery | 1 | $19B |
|
||
Price history
+6.4% since first listed15 events — show timeline
- 2026-04-14 Price Changed $329,900 TMLS
- 2026-01-23 Listing Removed — TMLS
- 2026-01-23 Listed $349,900 TMLS
- 2025-11-13 Listed $349,900 TMLS
- 2024-12-17 Rental Removed $950 RENTALBEAST
- 2024-11-27 Listed for Rent $950 RENTALBEAST
- 2024-11-06 Rental Removed $950 RENTALBEAST
- 2024-09-29 Price Changed $950 RENTALBEAST
- 2024-09-13 Price Changed $1,025 RENTALBEAST
- 2024-09-05 Listed for Rent $1,050 RENTALBEAST
- 2024-08-15 Rental Removed $995 TMLS
- 2024-08-14 Listed for Rent $995 TMLS
- 2024-08-14 Rental Removed $995 TMLS
- 2024-08-13 Listed for Rent $995 TMLS
- 2022-07-01 Sold (Public Records) $310,000 Public Records
Property tax history
+12.2%/yrLatest (2025): $3,936 · +56.7% YoY. Source: county tax records.
Cash-flow waterfall
monthlySold comps — $/sqft
last 12 mo · ≤1 miLoading sold comps…