 40-Plex
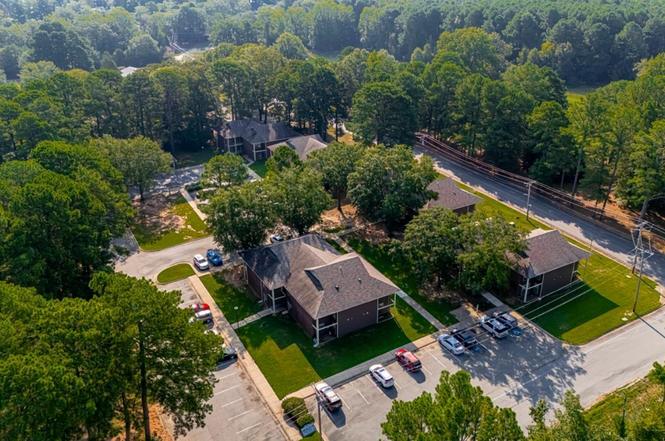
1810 Bishop Rd · Bryant, AR
Flood risk 1/10 · Minimal
- FEMA flood zone
- X (unshaded)
- Chance of flooding over 30 yrs
- 0.0%
- Est. flood insurance / yr
- $507 – $1,088
Fire risk 4/10 · Minor
- Est. fire insurance / yr
- $1,499 – $2,785
Heat risk 6/10 · Moderate
- Hot days now (above 110°F)
- 7 days/yr
- Hot days in 30 yrs
- 19 days/yr
Wind risk 4/10 · Minor
- Chance of severe wind over 30 yrs
- 12.0%
Air-quality risk 2/10 · Minimal
- Unhealthy air days now
- 0 days/yr
- Unhealthy air days in 30 yrs
- 1 days/yr
Risk factors via First Street. Map © Google.
Why this score? — see what drove the B grade
The composite is a weighted blend of 9 inputs, each scored 0–100. Each bar is that input's sub-score; the figure is the points it added to the 100-point composite (weight × sub-score).
- Cash flow +30.0/30.0
- 1% rule +10.0/10.0
- DSCR +10.0/10.0
- ARV discount +7.5/15.0
- Schools +4.2/10.0
- Livability +3.7/5.0
- Rent growth +2.5/5.0
- Condition / age +2.5/5.0
- Appreciation +0.0/10.0
$3,975,000
🖨 Deal sheet (PDF) 📄 Offer letter ✓ Due diligence
Multi-family units
County records classify this as Multi-Family (5+ Unit). Listing-text estimate: 40 units. confirmed
5+ unit building — per-unit beds/baths from public records are typically unavailable; the breakdown below (if shown) is an estimate from the listing text.
Listing remarks
Westside Village Apartments is a well-maintained, 40-unit garden-style community situated on ±3.81 acres at 1810 Bishop Road in Bryant, AR—one of Central Arkansas’ fastest-growing suburbs with immediate access to I-30, Bishop Park, and the Alcoa/Reynolds retail corridor. The property features a balanced unit mix of 16 one-bedroom flats (±646 SF) and 24 two-bedroom flats (±834 SF), all-electric systems, central HVAC, tenant paid water, on-site laundry, and proximity to Bryant’s highly rated school district, making it a proven choice for stable workforce housing. Current market rents (~$735 for 1BR; ~$805–$855 for 2BR with washer/dryer connections)
Key facts
- On site laundry
- 3.81 acre lot
- Built 1985
Tags
Property features AI
Finance
- Financial info: 40 units total; 16 one-bedroom units; 24 two-bedroom units; One-bedroom rent range: $750–$942; Two-bedroom rent range: $850–$1,182; Tenant pays all utilities including electric, water, and sewer; Owner pays taxes, insurance, maintenance/lawn care, management, trash, and electric
Exterior
- Parking: Parking pads
- Utilities: Public sewer; Public water; Municipal electric
- Home design: R2 zoning
- Construction: Slab foundation
- Exterior features: Brick exterior; Architectural shingle roof; Paved road access; Level lot; Inside city limits
Interior
- Kitchen: Electric range; Refrigerator stays
- Flooring: Partial carpet; Vinyl
- Heating & cooling: Central electric heat; Central electric cooling
- Interior features: Washer connection; Electric dryer connection
- Laundry & utility: Washer connection; Electric dryer connection
Neighborhood map
What this means for you Summary
Snapshot
- This is a 40 × 64-bed/1.0-bath units multifamily listed at $3.98M.
Deal economics
- At list price, monthly cash flow is $20k ($234k/yr) — positive. Per door: $488/mo.
- The deal already cash-flows at list — no discount required.
- Meets the 1% rule at list price ($59k rent vs $3.98M).
- Recommended offer: $3.50M (12.0% below list) — sets the bar for market timing.
- Cap rate 12.2% vs local median 3.9% in Bryant — top-decile yield for the area; either an underpriced asset or a hidden risk that comps aren't pricing in. Stress-test before assuming the spread holds.
Location & tenants
- Location reads 74/100 on livability (#16 in AR, #4,487 nationally) — a middle-class / working-renter tenant base. Strengths: cost of living A+, housing A+, health & safety A+; Watch: amenities F, commute F.
- Bryant School District (suburban): math 49% / reading 48% proficiency, ranked #16 of 238 in AR (top 7%) — families likely to look elsewhere, expect single-tenant / working-renter base with shorter leases.
- Market conditions: 97 active listings in the ZIP; 446 units permitted in Saline County in 2024 (0 in 5+ unit buildings).
Forward outlook
- Local home prices are declining (-3.0%/yr); year-one equity from $27k of loan paydown is wiped out by about $119k of value loss. Plan a longer hold.
- Saline County population projected at +39% by 2050 — long-run rental-demand tailwind backs the buy-and-hold thesis.
- At projected returns (-3.0% appreciation + 3.0% rent growth), your $1.11M cash investment doubles in ~6 years — after that, you're playing with house money.
Negotiation context
- It's been on market 227 days — a 12% lower offer ($3.50M) is reasonable based on typical stale-listing flexibility.
- 3 sale attempts with the ask held roughly flat each time — persistent listings suggest the price (not the market) is what's stuck; bring a comps-based counter.
Risks & watch-outs
- Climate carrying-cost: extreme-heat days projected 7→19/yr by 2055 (HVAC capex compounding) — expect insurance premiums to compound above CPI over the hold.
Questions for the listing agent
- It's been on market 227 days. Have you received any prior offers? Is the seller open to a 12% concession, seller financing, or rate buy-down credit?
- Can we see the unit-by-unit rent roll, current vacancy, and any below-market leases? What's the average tenancy length?
- What capital expenditures (roof, boiler, parking lot, exteriors) have been made in the last 5 years, and what's planned in the next 2?
- Why hasn't it sold? Are there any deal-killer items the seller is aware of (foundation, flood, title, zoning, code violations)?
- Is there a deadline driving the sale (1031 exchange, divorce, estate, relocation)? That informs how much negotiation room exists.
- Schools are B-rated — typically a magnet for longer-tenancy family renters. What's the average tenant stay here, and is there a school-zone premium baked into asking?
- What's the average days-on-market for RENTAL listings here right now (not sales)? A rising rental-DOM trend means longer vacancies and softer asking-rent achievability than the comps imply.
- What's the recent tenant-quality profile in this submarket — average credit score on applications, eviction rate, late-payment / NSF rate, and stable-employment percentage? A property-management company in the area should have these aggregated.
- How much new apartment / multifamily construction is in the pipeline within 1–3 miles? Heavy new supply (>2% of stock underway) typically softens rents 12–24 months out; light construction supports rent growth.
Investment metrics
- 1% rule
- 1.50% ✓
- Cap rate
- 12.19%
- Cash-on-cash
- 21.05%
- DSCR
- 1.94
- GRM
- 5.6
CMA / ARV
No comps found within radius.
Projected returns pro-forma
-3.0% appreciation · 3.0% rent growth · sell at horizon
- IRR
- 13.5%
- Equity multiple
- 1.54×
- Total profit
- $600,246
- Equity at exit
- $592,685
- IRR
- 22.4%
- Equity multiple
- 2.91×
- Total profit
- $2,127,495
- Equity at exit
- $343,685
Cash invested: $1,113,000 (down + closing). Projections, not guarantees.
Landlord ↔ Tenant lean methodology
- Overall (STATE)
- 92 Strongly Landlord-Friendly
- State Arkansas
- 92 Strongly Landlord-Friendly · R+14
- County
- — inherits STATE
- City
- — inherits STATE
ZIP-level market 72022
- Home prices YoY
- -16.5%
- Active inventory
- 97
- Price-to-rent
- 222.7×
Monthly cashflow live
- Estimated rent
- $59,486 medium interval (Pro) →
- Mortgage (P&I)
- −$20,845
- Tax est. 1.5%
- −$4,969 /mo · $59,625/yr
- Insurance
- −$1,656
- HOA
- −$0
- Vacancy / Maint / Mgmt
- −$12,492
- Net cashflow
- $19,524
Break-even live
Sensitivity live
| Price | -10% $22,271 | -5% $20,897 | +0% $19,524 | +5% $18,150 | +10% $16,777 |
|---|---|---|---|---|---|
| Rent | -10% $14,824 | -5% $17,174 | +0% $19,524 | +5% $21,873 | +10% $24,223 |
| Rate | -1.0pp $21,525 | -0.5pp $20,535 | base $19,524 | +0.5pp $18,494 | +1.0pp $17,446 |
40-unit breakdown (identical units grouped — click to expand)
| Units | Beds | Baths | Est. rent |
|---|---|---|---|
| 40× units | 64 | 1 | $59,480 |
| #1 | 64 | 1 | $1,487 |
| #2 | 64 | 1 | $1,487 |
| #3 | 64 | 1 | $1,487 |
| #4 | 64 | 1 | $1,487 |
| #5 | 64 | 1 | $1,487 |
| #6 | 64 | 1 | $1,487 |
| #7 | 64 | 1 | $1,487 |
| #8 | 64 | 1 | $1,487 |
| #9 | 64 | 1 | $1,487 |
| #10 | 64 | 1 | $1,487 |
| #11 | 64 | 1 | $1,487 |
| #12 | 64 | 1 | $1,487 |
| #13 | 64 | 1 | $1,487 |
| #14 | 64 | 1 | $1,487 |
| #15 | 64 | 1 | $1,487 |
| #16 | 64 | 1 | $1,487 |
| #17 | 64 | 1 | $1,487 |
| #18 | 64 | 1 | $1,487 |
| #19 | 64 | 1 | $1,487 |
| #20 | 64 | 1 | $1,487 |
| #21 | 64 | 1 | $1,487 |
| #22 | 64 | 1 | $1,487 |
| #23 | 64 | 1 | $1,487 |
| #24 | 64 | 1 | $1,487 |
| #25 | 64 | 1 | $1,487 |
| #26 | 64 | 1 | $1,487 |
| #27 | 64 | 1 | $1,487 |
| #28 | 64 | 1 | $1,487 |
| #29 | 64 | 1 | $1,487 |
| #30 | 64 | 1 | $1,487 |
| #31 | 64 | 1 | $1,487 |
| #32 | 64 | 1 | $1,487 |
| #33 | 64 | 1 | $1,487 |
| #34 | 64 | 1 | $1,487 |
| #35 | 64 | 1 | $1,487 |
| #36 | 64 | 1 | $1,487 |
| #37 | 64 | 1 | $1,487 |
| #38 | 64 | 1 | $1,487 |
| #39 | 64 | 1 | $1,487 |
| #40 | 64 | 1 | $1,487 |
| Total (40 units) | $59,486 | ||
UW: 25.0% down · 7.5% · 30yr · 1.5% tax · 5.0% vac · 8.0% maint · 8.0% mgmt
Financing live
Cash to close
- Down payment
- $993,750
- Closing costs
- $119,250
- Reserves months
- —
- Total cash needed
- —
Loan-product check · same deal, 3 products live
Conventional
25% down · 7.5% · 30yr
- Down + closing
- —
- Monthly P&I
- —
- Monthly cashflow
- —
- DSCR
- —
- Eligible?
- —
Personal DTI + credit; lowest rate.
DSCR
20% down · 8.5% · 30yr
- Down + closing
- —
- Monthly P&I
- —
- Monthly cashflow
- —
- DSCR
- —
- Eligible?
- —
No personal income docs; deal must DSCR.
Hard money
10% down · 12.0% · 12mo
- Down + closing
- —
- Monthly P&I
- —
- Monthly cashflow
- —
- DSCR
- —
- Eligible?
- —
Short-term bridge; refi at stabilization.
Listing history 21 events
-
2026-06-18days on market $3,975,000 Active 227 DOM
-
2026-06-17days on market $3,975,000 Active 226 DOM
-
2026-06-16days on market $3,975,000 Active 225 DOM
-
2026-06-15days on market $3,975,000 Active 224 DOM
-
2026-06-14days on market $3,975,000 Active 222 DOM
-
2026-06-13days on market $3,975,000 Active 221 DOM
-
2026-06-10days on market $3,975,000 Active 219 DOM
-
2026-06-09days on market $3,975,000 Active 218 DOM
-
2026-06-08days on market $3,975,000 Active 217 DOM
-
2026-06-07days on market $3,975,000 Active 216 DOM
-
2026-06-05days on market $3,975,000 Active 213 DOM
-
2026-06-03days on market $3,975,000 Active 212 DOM
-
2026-06-02days on market $3,975,000 Active 211 DOM
-
2026-06-01days on market $3,975,000 Active 210 DOM
-
2026-05-31days on market $3,975,000 Active 209 DOM
-
2026-05-31days on market $3,975,000 Active 208 DOM
-
2026-04-01status Active
-
2026-04-01historical
-
2026-02-12status Back on Market
-
2026-01-02status Under Contract
-
2025-09-01$3,975,000 New Listing
ⓘ Source: listings_history table (triggers on properties + properties_extension) + one-shot
backfill from property_details.listing_events for pre-trigger history.
Climate risk First Street
- Flood 1/10 Low FEMA zone X (unshaded) · 0% chance over 30 yrs
- Wildfire 4/10 Moderate
- Heat 6/10 Major 7 d/yr ≥110°F today · 19 d/yr by 30 yrs out
- Wind 4/10 Moderate 12% chance of damaging wind over 30 yrs
- Air quality 2/10 Low 0 unhealthy d/yr today · 1 by 30 yrs out
Nearby sold comps map
Loading sold comps map…
Walkable amenities ~0.75 mi
Loading nearby amenities…
Taxation est. · year 1
- Rental income
- $713,832
- − Mortgage interest
- −$222,662
- − Property taxes
- −$59,625
- − Insurance
- −$19,875
- − Repairs & maintenance
- −$57,107
- − Management
- −$57,107
- − Depreciation
- −$115,636
- Taxable income
- $181,821
- Est. tax owed @ 24.0%
- −$43,637
- After-tax cash flow
- $190,646/yr
For passive investors: Depreciation is non-cash, so a rental often shows a tax loss while cash-flowing — sheltering income. Rental losses are passive: they offset passive income freely, and up to $25,000/yr can offset ordinary (W-2) income if you actively participate and your MAGI is under $100k (phasing out to $0 by $150k); unused losses carry forward. On sale, claimed depreciation is recaptured at up to 25%, and gains may owe capital-gains tax (a 1031 exchange can defer both). Figures are a year-1 estimate at your 24.0% rate — not tax advice; consult a CPA.
Schools (NCES district)
- District
- Bryant School District
- NCES district ID
- 0503690
- Math proficiency
- 49% ▼ -13.00%
- Reading proficiency
- 48% ▼ -8.00%
- Median HH income
- $57,578
- Composite
- 42.28/100
- National rank
- #3266
- State rank
- #16 of 238 in AR
Livability — Bryant
- Score
- 74/100
- State rank
- #16
- US rank
- #4487
Category grades
Schools grade is shown separately in the Schools card above.
Census & demographics
- Census place
- Bryant, AR
- City population
- 18,350
- Population (ZIP)
- 18,350
Population outlook (Saline County) Hauer SSP2
- Today (2025)
- 140,141 people
- By 2030
- 151,233 · +7.9%
- By 2040
- 173,100 · +23.5%
- By 2050
- 194,368 · +38.7%
- By 2075
- 245,295 · +75.0%
- By 2100
- 279,117 · +99.2%
Race, ethnicity, and origin ACS 2023
- Neighborhood character
- Predominantly White (75%)
- Race & ethnicity
- White 75% Black 13% Two or more races 7% Hispanic / Latino 4% Asian 2%
- Common ancestry
- Slovak 1% Lithuanian 1% Romanian 1%
- Foreign-born
- 3% · Canada, South Korea
- Languages at home
- 94% English-only · Spanish 4% Korean 1% Other Indo-European 1%
Political lean MEDSL · Saline
- 2024 margin
- Solid R (+40.1) · D 28.8% · R 69.0% · Other 2.2%
- 2008→2024 swing
- +0.8pp no change · 2008: -41.0pp · 2024: -40.1pp
- All cycles
- 2024: R+40.1 2020: R+41.2 2016: R+43.5 2012: R+42.7 2008: R+41.0
Not yet ingested
- Civics
- —
Market trends
- HPI YoY
- ▼ -42.32%
- Current HPI
- 213.5119
- Rent YoY
- —
- Metro
- —
- State GDP YoY
- ▲ 3.80%
- F500 in state
- 10
Industry mix (Fortune 500 HQ in AR)
| Industry | F500 HQs | Revenue |
|---|---|---|
| Retail | 1 | $681B |
|
||
| Food / Agriculture | 1 | $53B |
|
||
| Retail / Energy | 1 | $22B |
|
||
| Transportation / Logistics | 1 | $12B |
|
||
| Energy | 1 | $4B |
|
||
Price history
5 events — show timeline
- 2026-04-01 Relisted — CARMLS
- 2026-04-01 Listing Removed — CARMLS
- 2026-02-12 Relisted — CARMLS
- 2026-01-02 Pending — CARMLS
- 2025-09-01 Listed $3,975,000 CARMLS
Cash-flow waterfall
monthlySold comps — $/sqft
last 12 mo · ≤1 miLoading sold comps…