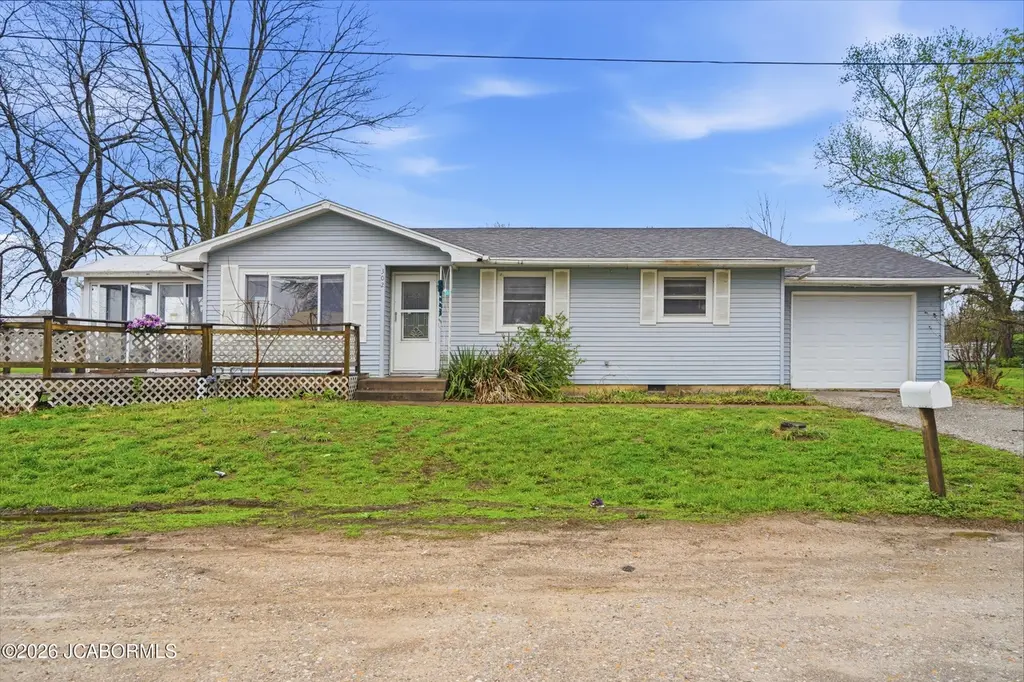
302 Academy St · Clarksburg, MO
Flood risk 1/10 · Minimal
- FEMA flood zone
- X (unshaded)
- Chance of flooding over 30 yrs
- 0.0%
- Est. flood insurance / yr
- $507 – $1,088
Fire risk 3/10 · Minor
- Est. fire insurance / yr
- $1,054 – $1,958
Heat risk 4/10 · Minor
- Hot days now (above 107°F)
- 7 days/yr
- Hot days in 30 yrs
- 18 days/yr
Wind risk 2/10 · Minimal
- Chance of severe wind over 30 yrs
- 0.0%
Air-quality risk 2/10 · Minimal
- Unhealthy air days now
- 0 days/yr
- Unhealthy air days in 30 yrs
- 1 days/yr
Risk factors via First Street. Map © Google.
Why this score? — see what drove the C+ grade
The composite is a weighted blend of 9 inputs, each scored 0–100. Each bar is that input's sub-score; the figure is the points it added to the 100-point composite (weight × sub-score).
- Cash flow +25.1/30.0
- DSCR +8.2/10.0
- ARV discount +7.5/15.0
- Appreciation +5.8/10.0
- 1% rule +5.5/10.0
- Schools +3.6/10.0
- Livability +2.9/5.0
- Rent growth +2.5/5.0
- Condition / age +2.5/5.0
$85,000
🖨 Deal sheet (PDF) 📄 Offer letter ✓ Due diligence
Listing remarks
Affordable living meets small-town charm! This cozy home on a generous lot offers plenty of potential for buyers looking to personalize or invest. With a great footprint, this property provides room to expand, update, or create your ideal space. Enjoy peaceful surroundings, low-traffic streets, and the simplicity of rural living--all at an approachable price point.
Key facts
- Generous lot
- Low-traffic streets
- 0.27 acre lot
Tags
Neighborhood map
What this means for you Summary
Snapshot
- This is a 2-bed/1.0-bath other listed at $85k.
Deal economics
- At list price, monthly cash flow is $187 ($2k/yr) — positive.
- The deal already cash-flows at list — no discount required.
- Meets the 1% rule at list price ($891 rent vs $85k).
- Recommended offer: $82k (3.0% below list) — sets the bar for market timing.
Location & tenants
- Location reads 58/100 on livability (#618 in MO) — a working-class tenant base; expect higher turnover. Strengths: cost of living A+, housing A; Watch: crime F, amenities F, commute F.
- Clarksburg C-2 (rural): math 40% / reading 40% proficiency, ranked #313 of 535 in MO (top 58%) — families likely to look elsewhere, expect single-tenant / working-renter base with shorter leases.
- Zoned schools: Clarksburg Elem. (math 34% / reading 44%, grade F, #537 of 1,115 statewide, top 53%, 54 students, 52% FRL) — zoned schools at 52% FRL track the district average.
- Market conditions: 3 active listings in the ZIP; 3 units permitted in Moniteau County in 2024 (0 in 5+ unit buildings).
Forward outlook
- In year one you build about $2k of equity ($588 loan paydown + $1k appreciation (1.6% local appreciation)).
- At projected returns (1.6% appreciation + 3.0% rent growth), your $24k cash investment doubles in ~5 years — after that, you're playing with house money.
Negotiation context
- It's been on market 32 days — a 3% lower offer ($82k) is reasonable based on typical stale-listing flexibility.
- 4 sale attempts; this cycle's ask has dropped $14k (14%) from the opening price — seller is motivated, your offer sets the floor, not the list.
Questions for the listing agent
- It's been on market 32 days. Have you received any prior offers? Is the seller open to a 3% concession, seller financing, or rate buy-down credit?
- Built in 1961 — when were the roof, HVAC, electrical panel, plumbing, and water heater last replaced?
- Is there a deadline driving the sale (1031 exchange, divorce, estate, relocation)? That informs how much negotiation room exists.
- Schools are D-rated, which usually means shorter tenancies and higher turnover. Who's the typical renter profile here, and what's been the actual vacancy rate?
- Crime grade is F in this area — have there been break-ins, vandalism, or insurance claims at this property in the last 3 years? What carrier currently insures it and at what premium?
- What's the average days-on-market for RENTAL listings here right now (not sales)? A rising rental-DOM trend means longer vacancies and softer asking-rent achievability than the comps imply.
- What's the recent tenant-quality profile in this submarket — average credit score on applications, eviction rate, late-payment / NSF rate, and stable-employment percentage? A property-management company in the area should have these aggregated.
- How much new for-sale + rental construction is in the pipeline within 1–3 miles? Heavy new supply typically softens prices + rents 12–24 months out; constrained supply supports both.
Investment metrics
- 1% rule
- 1.05% ✓
- Cap rate
- 8.94%
- Cash-on-cash
- 9.45%
- DSCR
- 1.42
- GRM
- 7.9
CMA / ARV
No comps found within radius.
Projected returns pro-forma
1.58% appreciation · 3.0% rent growth · sell at horizon
- IRR
- 12.7%
- Equity multiple
- 1.67×
- Total profit
- $15,922
- Equity at exit
- $31,604
- IRR
- 15.8%
- Equity multiple
- 3.02×
- Total profit
- $48,136
- Equity at exit
- $44,078
Cash invested: $23,800 (down + closing). Projections, not guarantees.
Landlord ↔ Tenant lean methodology
- Overall (STATE)
- 81 Strongly Landlord-Friendly
- State Missouri
- 81 Strongly Landlord-Friendly · R+10
- County
- — inherits STATE
- City
- — inherits STATE
ZIP-level market 65025
- Home prices YoY
- 0.6%
- Active inventory
- 3
- Price-to-rent
- 7.9×
Monthly cashflow live
- Estimated rent
- $891 medium interval (Pro) →
- Mortgage (P&I)
- −$446
- Tax from tax record
- −$35 /mo · $425/yr
- Insurance
- −$35
- HOA
- −$0
- Vacancy / Maint / Mgmt
- −$187
- Net cashflow
- $187
Break-even live
Sensitivity live
| Price | -10% $235 | -5% $211 | +0% $187 | +5% $163 | +10% $139 |
|---|---|---|---|---|---|
| Rent | -10% $117 | -5% $152 | +0% $187 | +5% $223 | +10% $258 |
| Rate | -1.0pp $230 | -0.5pp $209 | base $187 | +0.5pp $165 | +1.0pp $143 |
UW: 25.0% down · 7.5% · 30yr · 1.5% tax · 5.0% vac · 8.0% maint · 8.0% mgmt
Financing live
Cash to close
- Down payment
- $21,250
- Closing costs
- $2,550
- Reserves months
- —
- Total cash needed
- —
Loan-product check · same deal, 3 products live
Conventional
25% down · 7.5% · 30yr
- Down + closing
- —
- Monthly P&I
- —
- Monthly cashflow
- —
- DSCR
- —
- Eligible?
- —
Personal DTI + credit; lowest rate.
DSCR
20% down · 8.5% · 30yr
- Down + closing
- —
- Monthly P&I
- —
- Monthly cashflow
- —
- DSCR
- —
- Eligible?
- —
No personal income docs; deal must DSCR.
Hard money
10% down · 12.0% · 12mo
- Down + closing
- —
- Monthly P&I
- —
- Monthly cashflow
- —
- DSCR
- —
- Eligible?
- —
Short-term bridge; refi at stabilization.
Listing history 9 events
-
2026-05-10status Pending
-
2026-04-23status Active
-
2026-04-23status Active
-
2026-04-18status Pending
-
2026-04-18status Pending
-
2026-04-10price $85,000
-
2026-04-10price $85,000
-
2026-04-02$99,000 Active
-
2026-04-02$99,000 Active
ⓘ Source: listings_history table (triggers on properties + properties_extension) + one-shot
backfill from property_details.listing_events for pre-trigger history.
Tax reassessment forecast MO · Resets to sale price
- Current annual tax
- $425 · $35/mo
- Projected year-2 tax
- $824 · $69/mo
- Expected delta
- +$399/yr (+$33/mo · 93.8%)
ⓘ Screening estimate from a state-policy table — verify with the county assessor before closing.
Climate risk First Street
- Flood 1/10 Low FEMA zone X (unshaded) · 0% chance over 30 yrs
- Wildfire 3/10 Moderate
- Heat 4/10 Moderate 7 d/yr ≥107°F today · 18 d/yr by 30 yrs out
- Wind 2/10 Low 0% chance of damaging wind over 30 yrs
- Air quality 2/10 Low 0 unhealthy d/yr today · 1 by 30 yrs out
Nearby sold comps map
Loading sold comps map…
Walkable amenities ~0.75 mi
Loading nearby amenities…
Taxation est. · year 1
- Rental income
- $10,693
- − Mortgage interest
- −$4,761
- − Property taxes
- −$425
- − Insurance
- −$425
- − Repairs & maintenance
- −$855
- − Management
- −$855
- − Depreciation
- −$2,473
- Taxable income
- $898
- Est. tax owed @ 24.0%
- −$215
- After-tax cash flow
- $2,033/yr
For passive investors: Depreciation is non-cash, so a rental often shows a tax loss while cash-flowing — sheltering income. Rental losses are passive: they offset passive income freely, and up to $25,000/yr can offset ordinary (W-2) income if you actively participate and your MAGI is under $100k (phasing out to $0 by $150k); unused losses carry forward. On sale, claimed depreciation is recaptured at up to 25%, and gains may owe capital-gains tax (a 1031 exchange can defer both). Figures are a year-1 estimate at your 24.0% rate — not tax advice; consult a CPA.
Schools (NCES district)
- District
- Clarksburg C-2
- NCES district ID
- 2909090
- Math proficiency
- 40% ▼ -20.00%
- Reading proficiency
- 40% ▼ -20.00%
- Median HH income
- $43,186
- Composite
- 36.27/100
- National rank
- #9419
- State rank
- #313 of 535 in MO
Livability — Clarksburg
- Score
- 58/100
- State rank
- #618
- US rank
- #21406
Category grades
Schools grade is shown separately in the Schools card above.
Census & demographics
- Census place
- Clarksburg, MO
- Population (ZIP)
- 740
Population outlook (Moniteau County) Hauer SSP2
- Today (2025)
- 16,265 people
- By 2030
- 16,309 · +0.3%
- By 2040
- 16,437 · +1.1%
- By 2050
- 16,475 · +1.3%
- By 2075
- 15,956 · -1.9%
- By 2100
- 14,142 · -13.1%
Race, ethnicity, and origin ACS 2023
- Neighborhood character
- Predominantly White (95%)
- Race & ethnicity
- White 95% Hispanic / Latino 2% Two or more races 2%
- Common ancestry
- Italian 1% Iranian 1% Russian 1%
- Foreign-born
- 1% · Canada, South Korea
- Languages at home
- 91% English-only · German/W. Germanic 6% Spanish 2%
Political lean MEDSL · Moniteau
- 2024 margin
- Solid R (+62.8) · D 18.1% · R 80.8% · Other 1.1%
- 2008→2024 swing
- -27.0pp toward R · 2008: -35.8pp · 2024: -62.8pp
- All cycles
- 2024: R+62.8 2020: R+62.0 2016: R+60.3 2012: R+48.0 2008: R+35.8
Not yet ingested
- Civics
- —
Market trends
- HPI YoY
- ▲ 1.58%
- Current HPI
- 255.3724
- Rent YoY
- —
- Metro
- —
- State GDP YoY
- ▲ 1.84%
- F500 in state
- 20
Industry mix (Fortune 500 HQ in MO)
| Industry | F500 HQs | Revenue |
|---|---|---|
| Healthcare | 1 | $163B |
|
||
| Insurance | 1 | $21B |
|
||
| Industrial Technology | 1 | $17B |
|
||
| Retail | 1 | $16B |
|
||
| Industrial Distribution | 1 | $10B |
|
||
| Utilities | 1 | $9B |
|
||
Price history
-14.1% since first listed9 events — show timeline
- 2026-05-10 Pending — JCMLS
- 2026-04-23 Relisted — CBORMLS
- 2026-04-23 Relisted — JCMLS
- 2026-04-18 Pending — JCMLS
- 2026-04-18 Pending — CBORMLS
- 2026-04-10 Price Changed $85,000 CBORMLS
- 2026-04-10 Price Changed $85,000 JCMLS
- 2026-04-02 Listed $99,000 CBORMLS
- 2026-04-02 Listed $99,000 JCMLS
Property tax history
+2.5%/yrLatest (2025): $425 · +0.6% YoY. Source: county tax records.
Cash-flow waterfall
monthlySold comps — $/sqft
last 12 mo · ≤1 miLoading sold comps…