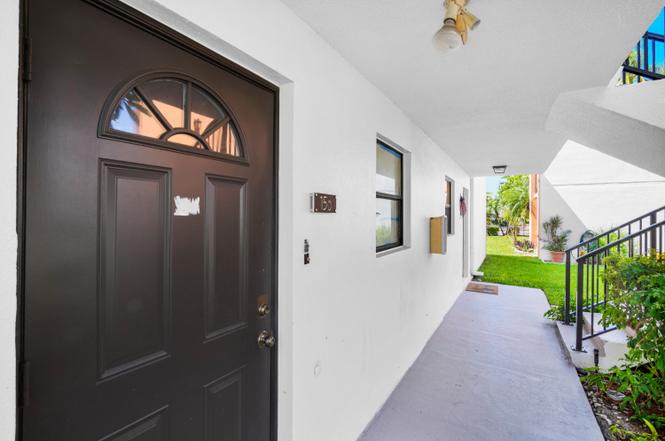
516 Osprey Dr · Delray Beach, FL
Flood risk 1/10 · Minimal
- FEMA flood zone
- X (unshaded)
- Chance of flooding over 30 yrs
- 0.0%
- Est. flood insurance / yr
- $507 – $1,088
Fire risk 1/10 · Minimal
- Est. fire insurance / yr
- $947 – $1,759
Heat risk 9/10 · Severe
- Hot days now (above 106°F)
- 7 days/yr
- Hot days in 30 yrs
- 26 days/yr
Wind risk 10/10 · Severe
- Chance of severe wind over 30 yrs
- 99.0%
Air-quality risk 3/10 · Minor
- Unhealthy air days now
- 2 days/yr
- Unhealthy air days in 30 yrs
- 3 days/yr
Risk factors via First Street. Map © Google.
Why this score? — see what drove the C grade
The composite is a weighted blend of 9 inputs, each scored 0–100. Each bar is that input's sub-score; the figure is the points it added to the 100-point composite (weight × sub-score).
- Cash flow +21.1/30.0
- 1% rule +8.5/10.0
- ARV discount +7.5/15.0
- DSCR +6.7/10.0
- Schools +4.3/10.0
- Livability +3.9/5.0
- Rent growth +2.9/5.0
- Condition / age +2.5/5.0
- Appreciation +0.0/10.0
$225,000
🖨 Deal sheet 📄 Offer letter ✓ Due diligence
Listing remarks
Discover effortless coastal living in this beautifully updated first-floor condo in the heart of Delray Beach. This bright 2-bedroom, 2-bath residence features brand-new appliances, stylish updated flooring, and fresh paint throughout, creating a clean, modern feel that's completely move-in ready. Enjoy the convenience of first-floor living with easy access to the community pool and lush green spaces. The open living and dining area flows seamlessly into the kitchen, perfect for everyday comfort or entertaining guests. Relax on your private screened patio and soak in the peaceful surroundings. Located just minutes from the vibrant shops, dining, and arts scene of Atlantic Avenue, with quick
Key facts
- First-floor condo
- Community pool
- Updated flooring
Tags
Neighborhood map
What this means for you Summary
Snapshot
- This is a 2-bed/2.0-bath single-family listed at $225k.
Deal economics
- At list price, monthly cash flow is $322 ($4k/yr) — positive.
- The deal already cash-flows at list — no discount required.
- Meets the 1% rule at list price ($3k rent vs $225k).
- Cap rate 8.0% vs local median 4.3% in Delray Beach — top-decile yield for the area; either an underpriced asset or a hidden risk that comps aren't pricing in. Stress-test before assuming the spread holds.
Location & tenants
- Location reads 77/100 on livability (#202 in FL, #3,160 nationally) — a middle-class / working-renter tenant base. Strengths: housing A+, health & safety A+, commute A-; Watch: cost of living C-, crime D-, amenities F.
- Palm Beach (suburban): math 46% / reading 53% proficiency, ranked #34 of 73 in FL (top 47%) — families likely to look elsewhere, expect single-tenant / working-renter base with shorter leases.
- Market conditions: Rents rising (+1.6%/yr); 233 active listings in the ZIP; 40 comparable units currently listed for rent nearby; rentals at typical pace (median 22d on market — plan ~3-4 weeks tenant-placement turnaround); 3,974 units permitted in Palm Beach County in 2024 (1,012 in 5+ unit buildings).
- At $3,028/mo this rent would consume 50% of the median local household income ($73k/yr) (locally 1211% of renters already pay >50% of income on rent) — very limited rent-growth headroom before tenants either downsize or default.
Forward outlook
- Local home prices are declining (-3.0%/yr); year-one equity from $2k of loan paydown is wiped out by about $7k of value loss. Plan a longer hold.
- Palm Beach County population projected at +30% by 2050 — long-run rental-demand tailwind backs the buy-and-hold thesis.
Negotiation context
- Only 4 days on market — expect competitive offers; lowballing is unlikely to land.
- 6 sale attempts since 19y ago; this cycle's ask is 8724% above the opening price — seller raised mid-cycle; expect resistance to lowballs.
Risks & watch-outs
- Climate carrying-cost: severe wind risk, 99% chance of damaging wind over 30y; extreme-heat days projected 7→26/yr by 2055 (HVAC capex compounding) — expect insurance premiums to compound above CPI over the hold.
Questions for the listing agent
- Built in 1976 — when were the roof, HVAC, electrical panel, plumbing, and water heater last replaced?
- What does the HOA fee cover, when was the last increase, and are there any pending special assessments or reserve-fund shortfalls?
- Is there a deadline driving the sale (1031 exchange, divorce, estate, relocation)? That informs how much negotiation room exists.
- Schools are B-rated — typically a magnet for longer-tenancy family renters. What's the average tenant stay here, and is there a school-zone premium baked into asking?
- Crime grade is D in this area — have there been break-ins, vandalism, or insurance claims at this property in the last 3 years? What carrier currently insures it and at what premium?
- What's the average days-on-market for RENTAL listings here right now (not sales)? A rising rental-DOM trend means longer vacancies and softer asking-rent achievability than the comps imply.
- What's the recent tenant-quality profile in this submarket — average credit score on applications, eviction rate, late-payment / NSF rate, and stable-employment percentage? A property-management company in the area should have these aggregated.
- How much new for-sale + rental construction is in the pipeline within 1–3 miles? Heavy new supply typically softens prices + rents 12–24 months out; constrained supply supports both.
Investment metrics
- 1% rule
- 1.35% ✓
- Cap rate
- 8.01%
- Cash-on-cash
- 6.13%
- DSCR
- 1.27
- GRM
- 6.2
CMA / ARV
No comps found within radius.
Projected returns pro-forma
-3.0% appreciation · 1.63% rent growth · sell at horizon
- IRR
- -8.7%
- Equity multiple
- 0.69×
- Total profit
- $-19,705
- Equity at exit
- $33,548
- IRR
- -1.4%
- Equity multiple
- 0.91×
- Total profit
- $-5,715
- Equity at exit
- $19,454
Cash invested: $63,000 (down + closing). Projections, not guarantees.
Landlord ↔ Tenant lean methodology
- Overall (STATE)
- 87 Strongly Landlord-Friendly
- State Florida
- 87 Strongly Landlord-Friendly · R+3
- County
- — inherits STATE
- City
- — inherits STATE
ZIP-level market 33444
- Rents YoY
- 1.6%
- Active inventory
- 233
- Price-to-rent
- 6.2×
Monthly cashflow live
- Estimated rent
- $3,028 high interval (Pro) →
- Mortgage (P&I)
- −$1,180
- Tax est. 1.5%
- −$281 /mo · $3,375/yr
- Insurance
- −$94
- HOA
- −$515
- Vacancy / Maint / Mgmt
- −$636
- Net cashflow
- $322
Break-even live
UW: 25.0% down · 7.5% · 30yr · 1.5% tax · 5.0% vac · 8.0% maint · 8.0% mgmt
Financing live
Cash to close
- Down payment
- $56,250
- Closing costs
- $6,750
- Reserves months
- —
- Total cash needed
- —
Loan-product check · same deal, 3 products live
Conventional
25% down · 7.5% · 30yr
- Down + closing
- —
- Monthly P&I
- —
- Monthly cashflow
- —
- DSCR
- —
- Eligible?
- —
Personal DTI + credit; lowest rate.
DSCR
20% down · 8.5% · 30yr
- Down + closing
- —
- Monthly P&I
- —
- Monthly cashflow
- —
- DSCR
- —
- Eligible?
- —
No personal income docs; deal must DSCR.
Hard money
10% down · 12.0% · 12mo
- Down + closing
- —
- Monthly P&I
- —
- Monthly cashflow
- —
- DSCR
- —
- Eligible?
- —
Short-term bridge; refi at stabilization.
Rent comps 40 comps
| Address | Beds | Baths | Sqft | Rent | $/sqft | DOM | Units | Dist |
|---|---|---|---|---|---|---|---|---|
| 2395 Jaeger Dr Unit 3D Delray Beach, FL | 2.0 | 2.0 | 1056 | $2,450 | $2.32 | 24d | 1 | 0.01mi |
| 516 Osprey Dr Delray Beach, FL | 2.0 | 2.0 | 1056 | $2,550 | $2.41 | 20d | 1 | 0.02mi |
| 516 Osprey Dr Unit 16B Delray Beach, FL | 2.0 | 2.0 | 1048 | $3,000 | $2.86 | 24d | 1 | 0.02mi |
| 517 Dotterel Rd Unit 31C Delray Beach, FL | 2.0 | 2.0 | 1056 | $2,200 | $2.08 | 24d | 1 | 0.03mi |
| 450 Egret Cir Delray Beach, FL | 2.0–3.0 | 2.0–2.5 | 1369 | $1,980 | $1.45 | 15d | 5 | 0.10mi |
| 450 Egret Cir Delray Beach, FL | 2.0–3.0 | 2.0–2.5 | 1369 | $2,600 | $1.90 | 16d | 3 | 0.10mi |
| 500 Egret Cir Delray Beach, FL | 2.0 | 2.0 | 1175 | $3,100 | $2.64 | 5d | 2 | 0.12mi |
| 755 Dotterel Rd Delray Beach, FL | 2.0 | 2.0 | 1175 | $3,598 | $3.06 | 4d | 2 | 0.14mi |
| 600 Egret Cir Delray Beach, FL | 1.0–2.0 | 1.0–2.0 | 1024 | $4,000 | $3.91 | 24d | 5 | 0.18mi |
| 750 Egret Cir Delray Beach, FL | 2.0 | 2.0 | 1232 | $3,425 | $2.78 | 16d | 2 | 0.19mi |
| 955 Dotterel Rd Delray Beach, FL | 2.0 | 2.0 | 1175 | $3,825 | $3.26 | 1d | 5 | 0.20mi |
| 950 Egret Cir Delray Beach, FL | 1.0 | 1.0 | 1175 | $2,000 | $1.70 | 5d | 1 | 0.22mi |
| 802 Mallard Dr Delray Beach, FL | 2.0 | 2.0 | 1480 | $8,500 | $5.74 | 24d | 1 | 0.22mi |
| 2255 Lindell Blvd Delray Beach, FL | 1.0–2.0 | 1.0–2.5 | 1007 | $4,500 | $4.47 | 15d | 8 | 0.24mi |
| 2801 Albatross Rd Delray Beach, FL | 2.0 | 2.0 | 1102 | $2,500 | $2.27 | 24d | 1 | 0.24mi |
| 2455 Lindell Blvd Delray Beach, FL | 2.0 | 2.0 | 1175 | $5,125 | $4.36 | 18d | 2 | 0.26mi |
| 2455 Lindell Blvd Delray Beach, FL | 1.0–2.0 | 1.0–2.0 | 1011 | $7,500 | $7.42 | 5d | 3 | 0.26mi |
| 825 Egret Cir Delray Beach, FL | 2.0 | 2.0 | 1213 | $3,025 | $2.49 | 2d | 3 | 0.26mi |
| 955 Egret Cir Delray Beach, FL | 2.0 | 2.0 | 1213 | $3,300 | $2.72 | 3d | 3 | 0.26mi |
| 825 Egret Cir #110 Delray Beach, FL | 2.0 | 2.0 | 1272 | $2,500 | $1.97 | 24d | 1 | 0.26mi |
| 650 Lavers Cir Delray Beach, FL | 1.0–3.0 | 1.0–2.0 | 1035 | $2,736 | $2.64 | 1d | 16 | 0.34mi |
| 2105 Lavers Cir Delray Beach, FL | 2.0 | 2.0 | 1211 | $4,250 | $3.51 | 20d | 1 | 0.38mi |
| 820 Lavers Cir Unit G311 Delray Beach, FL | 1.0 | 1.0 | 731 | $2,000 | $2.74 | 24d | 1 | 0.40mi |
| 1055 Crystal Way Unit A Delray Beach, FL | 2.0 | 2.0 | 948 | $2,500 | $2.64 | 24d | 1 | 0.40mi |
| 2025 Lavers Cir Delray Beach, FL | 2.0 | 2.0 | 1205 | $3,550 | $2.94 | 24d | 2 | 0.41mi |
| 2024 Alta Meadows Ln #808 Delray Beach, FL | 3.0 | 2.0 | 1362 | $3,000 | $2.20 | 24d | 1 | 0.42mi |
| 950 Lavers Cir Delray Beach, FL | 2.0 | 2.0 | 1110 | $3,625 | $3.26 | 24d | 2 | 0.42mi |
| 1915 Lavers Cir Delray Beach, FL | 1.0–2.0 | 1.0–2.0 | 990 | $4,500 | $4.55 | 11d | 5 | 0.42mi |
| 1915 Lavers Cir Delray Beach, FL | 2.0 | 2.0 | 1204 | $3,300 | $2.74 | 5d | 4 | 0.42mi |
| 2030 Alta Meadows Ln #1208 Delray Beach, FL | 3.0 | 2.0 | 1362 | $3,300 | $2.42 | 24d | 1 | 0.44mi |
| 505 Heron Dr Unit 505 Delray Beach, FL | 3.0 | 2.0 | 1435 | $4,000 | $2.79 | 24d | 1 | 0.45mi |
| 2016 Alta Meadows Ln #703 Delray Beach, FL | 2.0 | 2.0 | 1500 | $3,400 | $2.27 | 24d | 1 | 0.46mi |
| 2635 Frederick Blvd Delray Beach, FL | 2.0–3.0 | 2.5 | 1530 | $4,050 | $2.65 | 24d | 1 | 0.46mi |
| 2010 Alta Meadows Ln #209 Delray Beach, FL | 2.0 | 2.0 | 1302 | $2,800 | $2.15 | 3d | 1 | 0.47mi |
| 2036 Alta Meadows Ln #1407 Delray Beach, FL | 2.0 | 2.0 | 1175 | $3,300 | $2.81 | 22d | 1 | 0.50mi |
| 226 N Latitude Cir #205 Delray Beach, FL | 3.0 | 2.0 | 1496 | $3,150 | $2.11 | 10d | 1 | 0.51mi |
| 226 N Latitude Cir Delray Beach, FL | 1.0–3.0 | 1.5–2.0 | 1240 | $2,675 | $2.16 | 14d | 2 | 0.51mi |
| 3120 E Latitude Cir Delray Beach, FL | 3.0 | 2.0–3.0 | 1550 | $4,350 | $2.81 | 22d | 2 | 0.53mi |
| 2920 Florida Blvd #216 Delray Beach, FL | 2.0 | 2.0 | 1226 | $2,495 | $2.04 | 24d | 1 | 0.56mi |
| 1315 Gallinule Dr Delray Beach, FL | 3.0 | 2.0 | 1404 | $4,700 | $3.35 | 24d | 1 | 0.57mi |
HOA detail
- Monthly dues
- $515 · $6,180/yr
- Likely covers
- pool
Listing history 12 events
-
2026-05-22$2,550
-
2026-05-15historical $3,000
-
2026-05-14$3,000
-
2026-03-17status Pending
-
2026-03-11$225,000 Active
-
2024-04-01historical $2,600
-
2024-03-19$2,600
-
2024-02-26historical $2,600
-
2024-01-15$2,600
-
2022-11-23historical
-
2007-04-24historical
-
2007-03-29$190,000
ⓘ Source: listings_history table (triggers on properties + properties_extension) + one-shot
backfill from property_details.listing_events for pre-trigger history.
Climate risk First Street
- Flood 1/10 Low FEMA zone X (unshaded) · 0% chance over 30 yrs
- Wildfire 1/10 Low
- Heat 9/10 Extreme 7 d/yr ≥106°F today · 26 d/yr by 30 yrs out
- Wind 10/10 Extreme 99% chance of damaging wind over 30 yrs
- Air quality 3/10 Moderate 2 unhealthy d/yr today · 3 by 30 yrs out
Nearby sold comps map
Loading sold comps map…
Walkable amenities ~0.75 mi
Loading nearby amenities…
Taxation est. · year 1
- Rental income
- $36,333
- − Mortgage interest
- −$12,603
- − Property taxes
- −$3,375
- − Insurance
- −$1,125
- − Repairs & maintenance
- −$2,907
- − Management
- −$2,907
- − HOA
- −$6,180
- − Depreciation
- −$6,545
- Taxable income
- $691
- Est. tax owed @ 24.0%
- −$166
- After-tax cash flow
- $3,698/yr
For passive investors: Depreciation is non-cash, so a rental often shows a tax loss while cash-flowing — sheltering income. Rental losses are passive: they offset passive income freely, and up to $25,000/yr can offset ordinary (W-2) income if you actively participate and your MAGI is under $100k (phasing out to $0 by $150k); unused losses carry forward. On sale, claimed depreciation is recaptured at up to 25%, and gains may owe capital-gains tax (a 1031 exchange can defer both). Figures are a year-1 estimate at your 24.0% rate — not tax advice; consult a CPA.
Schools (NCES district)
- District
- Palm Beach
- NCES district ID
- 1201500
- Math proficiency
- 46% ▼ -16.00%
- Reading proficiency
- 53% ▼ -4.00%
- Median HH income
- $53,943
- Composite
- 42.72/100
- National rank
- #3160
- State rank
- #34 of 73 in FL
Livability — Delray Beach
- Score
- 77/100
- State rank
- #202
- US rank
- #3160
Category grades
Schools grade is shown separately in the Schools card above.
Census & demographics
- Census place
- Delray Beach, FL
- County
- Palm Beach County · 1,438,312 people
- City population
- 123,167
- Metro
- Miami-Fort Lauderdale-Pompano Beach, FL
- Population (ZIP)
- 22,737
- Household income
- $72,925
- Rent vs Own
- Severe rent burden
- 1211.0
Population outlook (Palm Beach County) Hauer SSP2
- Today (2025)
- 1,637,487 people
- By 2030
- 1,743,255 · +6.5%
- By 2040
- 1,948,712 · +19.0%
- By 2050
- 2,132,979 · +30.3%
- By 2075
- 2,530,027 · +54.5%
- By 2100
- 2,706,979 · +65.3%
Race, ethnicity, and origin ACS 2023
- Neighborhood character
- Diverse neighborhood (Simpson 0.64)
- Race & ethnicity
- Black 48% White 35% Hispanic / Latino 13% Two or more races 10% Asian 1%
- Hispanic origin (detail)
- Mexican 3% Puerto Rican 1% Cuban 1%
- Common ancestry
- Hispanic 17% Romanian 2% Italian 2%
- Foreign-born
- 24% · Canada, Jamaica
- Languages at home
- 70% English-only · French/Haitian/Cajun 18% Spanish 11% Other Indo-European 1%
Political lean MEDSL · Palm Beach
- 2024 margin
- Toss-up / Even · D 50.0% · R 49.2%
- 2008→2024 swing
- -22.1pp toward R · 2008: 22.9pp · 2024: 0.8pp
- All cycles
- 2024: D+0.8 2020: D+12.8 2016: D+15.3 2012: D+17.0 2008: D+22.9
Not yet ingested
- Civics
- —
Market trends
- HPI YoY
- ▼ -743.16%
- Current HPI
- 415.3247
- Rent YoY
- ▲ 1.63%
- Metro
- Miami-Fort Lauderdale-Pompano Beach, FL
- State GDP YoY
- ▲ 3.28%
- F500 in state
- 36
Industry mix (Fortune 500 HQ in FL)
| Industry | F500 HQs | Revenue |
|---|---|---|
| Industrial Technology | 2 | $29B |
|
||
| Insurance | 2 | $17B |
|
||
| Retail | 1 | $60B |
|
||
| Technology Distribution | 1 | $58B |
|
||
| Homebuilding | 1 | $35B |
|
||
| Technology Manufacturing | 1 | $35B |
|
||
Price history
-98.7% since first listed12 events — show timeline
- 2026-05-22 Listed for Rent $2,550 ZUMPER1
- 2026-05-15 Rental Removed $3,000 GFLMLS
- 2026-05-14 Listed for Rent $3,000 GFLMLS
- 2026-03-17 Pending — Beaches MLS
- 2026-03-11 Listed $225,000 Beaches MLS
- 2024-04-01 Rental Removed $2,600 REALLYO
- 2024-03-19 Listed for Rent $2,600 REALLYO
- 2024-02-26 Rental Removed $2,600 RMLSFL
- 2024-01-15 Listed for Rent $2,600 RMLSFL
- 2022-11-23 Rental Removed — RMLSFL
- 2007-04-24 Listing Removed — Beaches MLS
- 2007-03-29 Listed $190,000 Beaches MLS
Cash-flow waterfall
monthlySold comps — $/sqft
last 12 mo · ≤1 miLoading sold comps…