33 Mill St · Lexington, NC
Flood risk 1/10 · Minimal
- FEMA flood zone
- X (unshaded)
- Chance of flooding over 30 yrs
- 0.0%
- Est. flood insurance / yr
- $507 – $1,088
Fire risk 1/10 · Minimal
- Est. fire insurance / yr
- $906 – $1,684
Heat risk 6/10 · Moderate
- Hot days now (above 104°F)
- 7 days/yr
- Hot days in 30 yrs
- 17 days/yr
Wind risk 4/10 · Minor
- Chance of severe wind over 30 yrs
- 12.0%
Air-quality risk 2/10 · Minimal
- Unhealthy air days now
- 1 days/yr
- Unhealthy air days in 30 yrs
- 2 days/yr
Risk factors via First Street. Map © Google.
Why this score? — see what drove the C- grade
The composite is a weighted blend of 9 inputs, each scored 0–100. Each bar is that input's sub-score; the figure is the points it added to the 100-point composite (weight × sub-score).
- Cash flow +16.2/30.0
- ARV discount +15.0/15.0
- DSCR +5.0/10.0
- Livability +3.6/5.0
- 1% rule +3.4/10.0
- Rent growth +2.8/5.0
- Schools +2.8/10.0
- Condition / age +2.5/5.0
- Appreciation +0.0/10.0
$125,800
🖨 Deal sheet (PDF) 📄 Offer letter ✓ Due diligence
Listing remarks
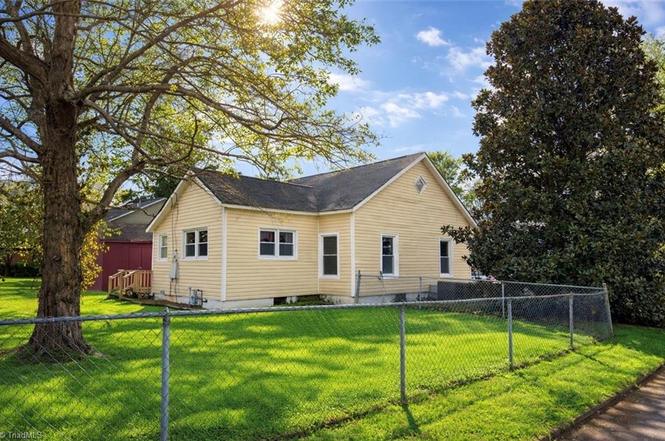
Must see this charming cottage nestled in the historic district of Erlanger Mills neighborhood. This home features spacious rooms with 2 bedrooms and 2 baths. Gas Pack was installed in 2021 and come with a 10-year warranty. Home is being sold As-Is. Seller never lived in home and has limited knowledge of property. Storage shed and all kitchen appliances remain including Refrigerator, Stove, Dishwasher, Washer and Dryer! Living Room, Dining Room and Bedroom furniture is for sale and can be negotiated outside of closing. This property is subject to upset bids Once approved by courts it will be posted at the court house for upset bids. Minimum 5 percent in Ernest money needed with offer. No du
Key facts
- Kitchen appliances
- Storage shed
- Historic district
Tags
Property features AI
Finance
- Other: Subdivision: Erlanger Mills; Directions available
- HOA & community: No homeowners association; Association listed as High Point (no active association)
Exterior
- Parking: Driveway
- Security: Smoke detectors
- Utilities: Public water; Public sewer; Public maintained road
- Home design: Residential stick/site-built house; One story; Built in 1917; Existing structure; Storage structure on property
- Construction: Vinyl siding; Crawl space foundation
- Exterior features: Fenced yard; Public transportation nearby; City lot; Level lot
Interior
- Kitchen: Dishwasher; Range; Cooktop
- Flooring: Tile flooring; Wood flooring
- Bathrooms: 2 full bathrooms
- Heating & cooling: Forced air heating (natural gas); Central air conditioning; Natural gas heating fuel
- Interior features: Ceiling fans; Deadbolt locks; Freestanding tub; Separate shower; Primary bedroom on main level; Total of 5 rooms
- Laundry & utility: Washer hookup; Dryer connection; Main-level laundry; Gas water heater; Water heater (insulated)
Neighborhood map
What this means for you Summary
Snapshot
- This is a 2-bed/1.0-bath single-family listed at $126k.
Deal economics
- At list price, monthly cash flow is $67 ($799/yr) — positive.
- The deal already cash-flows at list — no discount required.
- To meet the 1% rule (rent ≥ 1% of price), the offer needs to be $106k (16.0% below list).
- Recommended offer: $106k (16.0% below list) — sets the bar for 1% rule.
- Cap rate 6.9% vs local median 3.5% in Lexington — top-decile yield for the area; either an underpriced asset or a hidden risk that comps aren't pricing in. Stress-test before assuming the spread holds.
Location & tenants
- Location reads 72/100 on livability (#89 in NC) — a middle-class / working-renter tenant base. Strengths: commute A+, cost of living A+, health & safety A+; Watch: crime F, amenities D-, employment F.
- Lexington City Schools (suburban): math 32% / reading 38% proficiency, ranked #136 of 178 in NC (top 76%) — families likely to look elsewhere, expect single-tenant / working-renter base with shorter leases; 78% free/reduced lunch — lower-income household profile, screen leases tightly.
- Zoned schools: Pickett Elementary School (math 32% / reading 32%, grade F, #908 of 1,410 statewide, top 67%, 394 students, 99% FRL); Lexington Middle School (math 31% / reading 41%, grade F, #273 of 475 statewide, top 58%, 647 students, 100% FRL); Lexington Senior High School (math 27% / reading 52%, grade F, #393 of 535 statewide, top 75%, 928 students, 99% FRL) — zoned schools average 99% FRL vs 78% district-wide (21 pts higher); higher-poverty schools than district average — tighter screening recommended.
- Market conditions: Rents rising (+1.4%/yr); 403 active listings in the ZIP; 3 comparable units currently listed for rent nearby; rentals at typical pace (median 21d on market — plan ~3-4 weeks tenant-placement turnaround); 990 units permitted in Davidson County in 2024 (54 in 5+ unit buildings).
Forward outlook
- Local home prices are declining (-3.0%/yr); year-one equity from $870 of loan paydown is wiped out by about $4k of value loss. Plan a longer hold.
- Davidson County population projected to shrink 6% by 2050 — rents likely to lag national; underwrite the cash flow, not the appreciation.
Negotiation context
- It's been on market 105 days — a 9% lower offer ($114k) is reasonable based on typical stale-listing flexibility.
- Current owner paid $50k; list at $126k implies a 152% gain — meaningful room to come down on a strong offer.
Risks & watch-outs
- Watch-outs: built in 1917 — expect roof / HVAC / electrical / plumbing capex.
- Climate carrying-cost: extreme-heat days projected 7→17/yr by 2055 (HVAC capex compounding) — expect insurance premiums to compound above CPI over the hold.
Questions for the listing agent
- It's been on market 105 days. Have you received any prior offers? Is the seller open to a 16% concession, seller financing, or rate buy-down credit?
- Built in 1917 — when were the roof, HVAC, electrical panel, plumbing, and water heater last replaced?
- Why hasn't it sold? Are there any deal-killer items the seller is aware of (foundation, flood, title, zoning, code violations)?
- Is there a deadline driving the sale (1031 exchange, divorce, estate, relocation)? That informs how much negotiation room exists.
- Schools are D-rated, which usually means shorter tenancies and higher turnover. Who's the typical renter profile here, and what's been the actual vacancy rate?
- Crime grade is F in this area — have there been break-ins, vandalism, or insurance claims at this property in the last 3 years? What carrier currently insures it and at what premium?
- What's the average days-on-market for RENTAL listings here right now (not sales)? A rising rental-DOM trend means longer vacancies and softer asking-rent achievability than the comps imply.
- What's the recent tenant-quality profile in this submarket — average credit score on applications, eviction rate, late-payment / NSF rate, and stable-employment percentage? A property-management company in the area should have these aggregated.
- How much new for-sale + rental construction is in the pipeline within 1–3 miles? Heavy new supply typically softens prices + rents 12–24 months out; constrained supply supports both.
Investment metrics
- 1% rule
- 0.84% ✗
- Cap rate
- 6.93%
- Cash-on-cash
- 2.27%
- DSCR
- 1.10
- GRM
- 9.9
CMA / ARV
- ARV (on-the-fly)
- $209,000
- Comps found
- 12
Show comp detail 12 sales within ~0.75 mi
| Address | Dist | Beds/Ba | Sqft | Sold | Price | $/sf | Match |
|---|---|---|---|---|---|---|---|
| 33 Mill St | 0.00mi | 2/2.0 | 1,104 (+0%) | 1mo | $122,500 | $111 | 95 |
| 4 Hames St | 0.14mi | 3/2.0 (+1) | 1,150 (+4%) | 4mo | $223,000 | $194 | 74 |
| 37 Mill St | 0.05mi | 2/2.0 | 1,199 (+9%) | 11mo | $65,000 | $54 | 70 |
| 10 Hames St | 0.06mi | 3/2.0 (+1) | 989 (-10%) | 4mo | $195,000 | $197 | 68 |
| 13 Longview St | 0.39mi | 2/1.0 | 985 (-10%) | 6mo | $162,500 | $165 | 59 |
| 31 Conrad St | 0.37mi | 2/1.0 | 985 (-10%) | 10mo | $70,000 | $71 | 57 |
| 100 Martin Luther King Jr Blvd | 0.66mi | 2/1.0 | 1,037 (-6%) | 6mo | $185,000 | $178 | 54 |
| 7 Martin Luther King Jr Blvd | 0.56mi | 3/3.0 (+1) | 1,132 (+3%) | 14mo | $230,000 | $203 | 44 |
| 342 Northview Dr | 0.71mi | 3/1.0 (+1) | 1,000 (-9%) | 4mo | $190,000 | $190 | 43 |
| 464 Boaze Rd | 0.69mi | 3/2.0 (+1) | 1,134 (+3%) | 14mo | $218,500 | $193 | 42 |
| 340 Northview Dr | 0.71mi | 3/1.0 (+1) | 1,000 (-9%) | 6mo | $190,000 | $190 | 42 |
| 214 Choyce St Unit B | 0.73mi | 3/2.0 (+1) | 1,237 (+12%) | 12mo | $257,000 | $208 | 26 |
Match score weights: distance 35% · size 25% · config 20% · recency 20%. Top-matched comps best support the ARV.
Projected returns pro-forma
-3.0% appreciation · 1.37% rent growth · sell at horizon
- IRR
- -14.4%
- Equity multiple
- 0.49×
- Total profit
- $-17,896
- Equity at exit
- $18,757
- IRR
- -8.3%
- Equity multiple
- 0.52×
- Total profit
- $-17,081
- Equity at exit
- $10,877
Cash invested: $35,224 (down + closing). Projections, not guarantees.
Landlord ↔ Tenant lean methodology
- Overall (STATE)
- 85 Strongly Landlord-Friendly
- State North Carolina
- 85 Strongly Landlord-Friendly · R+3
- County
- — inherits STATE
- City
- — inherits STATE
ZIP-level market 27292
- Home prices YoY
- -22.1%
- Rents YoY
- 1.4%
- Active inventory
- 403
- Price-to-rent
- 9.9×
Monthly cashflow live
- Estimated rent
- $1,056 medium interval (Pro) →
- Mortgage (P&I)
- −$660
- Tax from tax record
- −$56 /mo · $668/yr
- Insurance
- −$52
- HOA
- −$0
- Lot rent
- −$0
- Vacancy / Maint / Mgmt
- −$222
- Net cashflow
- $67
Break-even live
Sensitivity live
| Price | -10% $138 | -5% $102 | +0% $67 | +5% $31 | +10% $-5 |
|---|---|---|---|---|---|
| Rent | -10% $-17 | -5% $25 | +0% $67 | +5% $108 | +10% $150 |
| Rate | -1.0pp $130 | -0.5pp $99 | base $67 | +0.5pp $34 | +1.0pp $1 |
UW: 25.0% down · 7.5% · 30yr · 1.5% tax · 5.0% vac · 8.0% maint · 8.0% mgmt
Financing live
Cash to close
- Down payment
- $31,450
- Closing costs
- $3,774
- Reserves months
- —
- Total cash needed
- —
Loan-product check · same deal, 3 products live
Conventional
25% down · 7.5% · 30yr
- Down + closing
- —
- Monthly P&I
- —
- Monthly cashflow
- —
- DSCR
- —
- Eligible?
- —
Personal DTI + credit; lowest rate.
DSCR
20% down · 8.5% · 30yr
- Down + closing
- —
- Monthly P&I
- —
- Monthly cashflow
- —
- DSCR
- —
- Eligible?
- —
No personal income docs; deal must DSCR.
Hard money
10% down · 12.0% · 12mo
- Down + closing
- —
- Monthly P&I
- —
- Monthly cashflow
- —
- DSCR
- —
- Eligible?
- —
Short-term bridge; refi at stabilization.
Rent comps 3 comps
| Address | Beds | Baths | Sqft | Rent | $/sqft | DOM | Units | Dist |
|---|---|---|---|---|---|---|---|---|
| 1305 White St Unit 1315-A Lexington, NC | 2.0 | 1.5 | 900 | $875 | $0.97 | 16d | 1 | 0.44mi |
| 110 Ridge Mill Cir Unit 517 Lexington, NC | 2.0 | 2.0 | 864 | $1,225 | $1.42 | 25d | 1 | 0.47mi |
| 420 Salem St Unit H Lexington, NC | 2.0 | 1.5 | 1100 | $875 | $0.80 | 21d | 1 | 0.63mi |
Listing history 6 events
-
2026-05-31status $125,800 Pending 105 DOM
-
2026-05-31days on market $125,800 Due Diligence Period 105 DOM
-
2026-04-06historical Due Diligence Period
-
2026-02-14$125,800 Active
-
2009-05-27soldstatus $50,000
-
1987-10-01soldstatus $25,000
ⓘ Source: listings_history table (triggers on properties + properties_extension) + one-shot
backfill from property_details.listing_events for pre-trigger history.
Tax reassessment forecast NC · Resets to sale price
- Current annual tax
- $668 · $56/mo
- Projected year-2 tax
- $1,032 · $86/mo
- Expected delta
- +$363/yr (+$30/mo · 54.4%)
ⓘ Screening estimate from a state-policy table — verify with the county assessor before closing.
Climate risk First Street
- Flood 1/10 Low FEMA zone X (unshaded) · 0% chance over 30 yrs
- Wildfire 1/10 Low
- Heat 6/10 Major 7 d/yr ≥104°F today · 17 d/yr by 30 yrs out
- Wind 4/10 Moderate 12% chance of damaging wind over 30 yrs
- Air quality 2/10 Low 1 unhealthy d/yr today · 2 by 30 yrs out
Nearby sold comps map
Loading sold comps map…
Walkable amenities ~0.75 mi
Loading nearby amenities…
Taxation est. · year 1
- Rental income
- $12,674
- − Mortgage interest
- −$7,047
- − Property taxes
- −$668
- − Insurance
- −$629
- − Repairs & maintenance
- −$1,014
- − Management
- −$1,014
- − Depreciation
- −$3,660
- Taxable loss
- −$1,357
- Est. tax savings @ 24.0%
- +$326
- After-tax cash flow
- $1,125/yr
For passive investors: Depreciation is non-cash, so a rental often shows a tax loss while cash-flowing — sheltering income. Rental losses are passive: they offset passive income freely, and up to $25,000/yr can offset ordinary (W-2) income if you actively participate and your MAGI is under $100k (phasing out to $0 by $150k); unused losses carry forward. On sale, claimed depreciation is recaptured at up to 25%, and gains may owe capital-gains tax (a 1031 exchange can defer both). Figures are a year-1 estimate at your 24.0% rate — not tax advice; consult a CPA.
Schools (NCES district)
- District
- Lexington City Schools
- NCES district ID
- 3702640
- Math proficiency
- 32% ▲ 3.00%
- Reading proficiency
- 38% ▲ 6.00%
- Median HH income
- $27,758
- Composite
- 28.2/100
- National rank
- #6807
- State rank
- #136 of 178 in NC
Livability — Lexington
- Score
- 72/100
- State rank
- #89
- US rank
- #6051
Category grades
Schools grade is shown separately in the Schools card above.
Census & demographics
- Census place
- Lexington, NC
- County
- Davidson County · 129,088 people
- City population
- 79,578
- Metro
- Winston-Salem, NC
- Population (ZIP)
- 40,311
- Household income
- $57,264
- Rent vs Own
- Severe rent burden
- 1001.0
Population outlook (Davidson County) Hauer SSP2
- Today (2025)
- 167,156 people
- By 2030
- 167,216 · +0.0%
- By 2040
- 164,524 · -1.6%
- By 2050
- 157,229 · -5.9%
- By 2075
- 138,084 · -17.4%
- By 2100
- 112,729 · -32.6%
Race, ethnicity, and origin ACS 2023
- Neighborhood character
- Predominantly White (72%)
- Race & ethnicity
- White 72% Black 13% Two or more races 9% Hispanic / Latino 9% Asian 2%
- Hispanic origin (detail)
- Mexican 7%
- Common ancestry
- Romanian 1% Slovak 1% Serbian 1%
- Foreign-born
- 5% · Canada, Vietnam
- Languages at home
- 91% English-only · Spanish 8%
Political lean MEDSL · Davidson
- 2024 margin
- Solid R (+47.1) · D 25.9% · R 73.0% · Other 1.1%
- 2008→2024 swing
- -13.5pp toward R · 2008: -33.5pp · 2024: -47.1pp
- All cycles
- 2024: R+47.1 2020: R+47.5 2016: R+49.4 2012: R+40.9 2008: R+33.5
Not yet ingested
- Civics
- —
Market trends
- HPI YoY
- ▼ -75.79%
- Current HPI
- 267.074
- Rent YoY
- ▲ 1.37%
- Metro
- Winston-Salem, NC
- State GDP YoY
- ▲ 3.28%
- F500 in state
- 26
Industry mix (Fortune 500 HQ in NC)
| Industry | F500 HQs | Revenue |
|---|---|---|
| Financial Services | 2 | $213B |
|
||
| Retail | 2 | $95B |
|
||
| Industrial Conglomerate | 1 | $38B |
|
||
| Metals / Steel | 1 | $35B |
|
||
| Utilities | 1 | $30B |
|
||
| Industrial Machinery | 1 | $19B |
|
||
Price history
+403.2% since first listed4 events — show timeline
- 2026-04-06 Contingent — Triad MLS
- 2026-02-14 Listed $125,800 Triad MLS
- 2009-05-27 Sold (Public Records) $50,000 Public Records
- 1987-10-01 Sold (Public Records) $25,000 Public Records
Property tax history
+0.1%/yrLatest (2025): $668 · +0.0% YoY. Source: county tax records.
Cash-flow waterfall
monthlySold comps — $/sqft
last 12 mo · ≤1 miLoading sold comps…